
ABSTRACT
Deficiency of TOM5, a mitochondrial protein, causes organizing pneumonia (OP) in mice. The clinical significance and mechanisms of TOM5 in the pathogenesis of OP remain elusive. We demonstrated that TOM5 was significantly increased in the lung tissues of OP patients, which was positively correlated with the collagen deposition. In a bleomycin-induced murine model of chronic OP, increased TOM5 was in line with lung fibrosis. In vitro, TOM5 regulated the mitochondrial membrane potential in alveolar epithelial cells. TOM5 reduced the proportion of early apoptotic cells and promoted cell proliferation. Our study shed light on the roles of TOM5 in OP.
Introduction
Organizing pneumonia (OP) is divided into cryptogenic organizing pneumonia (COP) and secondary organizing pneumonia (SOP). Both exhibit similar clinical organizing pneumonia manifestations, radiological features and pathological features [Citation1]. Unlike COP, SOP has a clear etiology or concomitant clinical diseases [Citation2], such as connective tissue diseases, drugs, bone marrow transplantation, etc. Due to atypical clinical manifestations and uncertain pathogenesis, OP is easily misdiagnosed. Currently, its main diagnosis rests on a combination of clinical features, imaging and pathological findings, in which pathological diagnosis is indispensable. The main pathological features of OP are as follows: (1) mild interstitial inflammation; (2) hyperplasia of type II alveolar epithelial cells; and (3) proliferation of granulation tissue (mainly spindle-shaped fibroblasts and myofibroblasts) in the alveoli or alveolar duct [Citation3–5]. Although the signal initiating lung injury in the course of OP is not completely clear, these signals lead to the activation of type II alveolar epithelial cell proliferation, which is key to maintaining alveolar structural integrity. Glucocorticoids are effective in treating OP [Citation6], but the lungs of patients with OP may still develop fibrosis [Citation5]. There is a dynamic balance between alveoli injury and remodeling in the pathogenesis of OP.
TOM5 is a small subunit of the mitochondrial outer membrane translocase complex (TOM complex), which is used as the entrance of more than 90% of mitochondrial proteins from the cytoplasm to the mitochondria [Citation7]. P. Vogel, etc., found that the lung tissues of TOM5-deficient mice exhibited very similar characteristics to COP histopathology, but the specific mechanism was unclear [Citation8]. TOM5 is responsible for the recognition and transport of mitochondrial receptor proteins [Citation9], which can usually lead to mitochondrial dysfunction and cell death if interfered with [Citation10]. TOM5 is involved in the biogenesis of mitochondrial intermembrane-space (IMS) proteins [Citation7]. Some IMS proteins are extremely important to cells, such as some components in the electron transport chain and some enzymes involved in metabolism and redox, especially some apoptotic factors blocked in the intermembrane space, and their release causes cell apoptosis [Citation11]. Additionally, TOM5 is able to encode mitochondrial proteins directly related to energy metabolism [Citation12]. Taken together, TOM5 may be associated with oxidative stress, cell proliferation and apoptosis.
Accordingly, previous studies have reported that oxidative stress plays an important role in the evolution of OP [Citation12,Citation13]. We hypothesized that TOM5 might be involved in the development of OP via the regulation of oxidative stress. To verify this assumption, we first determined the expression of TOM5 in lung tissues of patients with OP and analyzed the correlation between TOM5 and pulmonary inflammation or fibrosis in patients with OP to explore the possibility of TOM5 as a biomarker of OP. Second, TOM5 expression was assayed in a bleomycin-induced mouse model of OP. Finally, the role of TOM5 in alveolar cell proliferation and apoptosis was studied to explore the mechanisms of TOM5.
Methods and materials
Patients and samples
To detect the expression of TOM5 between OP and non-OP patients, pathology slides for 37 OP patients and 20 non-OP patients were obtained from The First Affiliated Hospital of Nanjing Medical University (Nanjing, China) between 2015 and 2019. The diagnostic criteria of OP refer to the expert consensus on idiopathic interstitial pneumonia published by ATS/ERS in 2013 [Citation14]. The exclusion criteria were as follows: (1) participants with cardiac insufficiency, abnormal liver function, pulmonary embolism, coinfection, tuberculosis and blood system diseases; (2) patients using glucocorticoids or other nonsteroidal anti-inflammatory drugs; and (3) patients with incomplete clinical data and information. Pathological sections from OP patients were obtained from bronchoscopy or transthoracic needle aspiration or from surgical specimens. We correspondingly selected patients with pulmonary nodules who were further diagnosed with in situ carcinoma by operation as the non-OP group. Tissues at least 2 cm away from malignant lung nodules (generally considered to be normal lung tissue) were used to prepare histopathological sections. We collected all clinical data for all patients. The present study was approved by the Ethics Committee of The First Affiliated Hospital of Nanjing Medical University.
Murine model of OP
Wild-type C57BL/6 mice were purchased from the Laboratory Animal Center of Yangzhou University (Yangzhou, China). Male 8 – to 12-week-old mice were used for experiments. The animal protocol was approved by the Institutional Animal Care and Use Committee of Nanjing Medical University.
Bleomycin (BLM) is widely used to mimic idiopathic pulmonary fibrosis (IPF) in rodent models [Citation15]. Both IPF and COP belong to idiopathic interstitial pneumonia (IIP) [Citation16], and their pathological features of lung tissue are similar [Citation16,Citation17]. There was no significant difference in the degree of pulmonary inflammation and fibrosis between OP and IPF [Citation18], and 27.3% of IPF patients completely presented a pattern of OP [Citation19]. It is worth mentioning that the fibrosis induced by single-dose BLM is reversible [Citation15], which is more in line with the pathological characteristics of OP. I Mokhtari et al. [Citation20] retrospectively identified asymptomatic pulmonary nodules in 3 cancer patients after treatment with cumulative doses of bleomycin from 143 to 199 mg. All patients underwent thoracotomy and lung biopsies to determine the nature of the nodules because they were worried about the possibility of metastatic nodules. Pathology showed that all cases were mainly OP. As previously described [Citation21], the low-dose BLM model was used to simulate the pathological changes of OP in the present study. Briefly, 26 mice were randomly categorized into control (n = 5), acute model (inflammatory phase, n = 7) and chronic model (fibrotic phase, n = 14) groups. On day 1, each mouse was anesthetized by intraperitoneal injection of 5% chloral hydrate (5–10 mL/kg), and bleomycin (3 mg/kg body weight in 50 μL saline) or saline alone (50 μL) was administered by intratracheal instillation. The mortality and body weight of the mice were recorded every day. On day 7, the mice in the acute model group were sacrificed by cervical dislocation. On day 21, all remaining mice were euthanized. Lung tissue and blood samples were harvested for analysis.
Pulmonary histology
Sections from formalin-fixed and paraffin-embedded lungs were stained with hematoxylin–eosin (HE) or Masson trichrome staining to assess the degree of pulmonary inflammation infiltration or fibrosis. Three random microscopic fields were captured with a microscope (model BX-53, Olympus Optical, Japan) under 200× magnification by an investigator blinded to the grouping. Total inflammatory area in lung sections was measured as pixels with Image-Pro Plus 6.0, which was divided by total pixels of the entire tissue to calculate the proportion of inflammatory area (%). The collagen volume fraction (CVF) was assessed by Image-Pro Plus 6.0 and calculated as CVF = the sum of all stained interstitial collagen tissue areas/the whole tissue area.
For immunohistochemistry, tissue sections (5 µm) were fixed in 4% paraformaldehyde solution and embedded in paraffin. Endogenous peroxidase activity was inactivated using 3% H2O2. The slides were washed twice with TBS containing 0.025% Triton X-100 for 5 min each, followed by a 2 h blocking step using 10% normal serum and 1% BSA in TBS at room temperature. After blocking, sections were processed for staining with anti-TOM5 (ab151037, rabbit IgG, 1:100, Abcam, Cambridge, UK) diluted in 1% BSA/TBS overnight at 4 °C. Finally, the slides were washed in TBS (2 × 5 min) and captured at 200× magnification with a microscope (model BX-53, Olympus Optical). Three randomly selected areas from each sample were quantitatively analyzed by Image-Pro Plus 6.0. The average optical density of TOM5 was calculated as integral optical density (IOD)/area.
Alveolar epithelia cell culture
A549 cell line showed the same metabolic and transport characteristics as type II pulmonary epithelial cells in vivo [Citation22], and we used A549 cells to simulate type II alveolar cells in vitro [Citation23]. A549 cells were cultured in Dulbecco’s modified Eagle’s medium (DMEM, HyClone, USA) with 10% fetal bovine serum (Lonsera, USA) and 1% penicillin/streptomycin (HyClone, USA) in a humidified atmosphere containing 5% CO2 at 37°C. When needed, the autophagy inhibitor autophinib (HY-101920, MCE, China), MAPK/p38 inhibitor (SB-203580, Selleckchem, USA) or PI3 K/Akt inhibitor (HY-144450, MCE, China) was added to the medium for further analysis. Cells in logarithmic growth phase were used, and all experiments were performed and repeated independently at least three times.
Cell apoptosis and cell proliferation models
To build A549 cell models of apoptosis and proliferation, we used CCK8 (Yeasen, Shanghai, China) to measure relative cell viability. Cell suspensions (100 μL; 50 000 cells/mL) were seeded into 96-well culture plates and placed in an incubator for 24 hours. The next day, the culture medium was replaced with fresh DMEM containing different concentrations of H2O2, and the cells were cultured for another 24 hours. It should be noted at this point that low-serum (2%) DMEM was used to build a proliferation model to reduce the influence of cell proliferation. Then, 10 μL of CCK-8 solution was added to each well, and the plate was incubated at 37°C for 2–3 h. The absorbance at 450 nm was measured with a microplate reader (BioTek, USA). Cell viability (%) = (OD treated − OD blank)/(OD control − OD blank) × 100%. We explored the appropriate concentrations of H2O2 to establish cell apoptosis and proliferation models.
Assessment of cell injury
Cells were cultured in medium for 24 h and subsequently stimulated by different concentrations of H2O2. The activity of lactate dehydrogenase (LDH) in cell culture supernatant was determined by colorimetric method using the LDH kit (Solarbio, Beijing, China).
Immunofluorescence staining
To understand the effect of 250 μM H2O2 on the expression of TOM5 in A549 cells in vitro, immunofluorescence staining was performed. A549 cells (5 × 10⁵ cells/ml) were seeded in confocal dishes (D35–14–1-N, Cellvis, China) and incubated for cell attachment. Then, the medium was removed, and the cells were washed three times with PBS. Cells were fixed in 100% precooled methanol for 15 min at – 20°C and blocked in 5% pure goat serum (36119ES10, Yesen, China) for 1 h at room temperature. After removing the blocking solution, primary anti-human TOM5 antibody (ab151037, rabbit IgG, 1:100, Abcam, Cambridge, UK) was added to confocal dishes and incubated at 4°C overnight. The next day, the cells were washed three times and incubated with the anti-rabbit fluorescent secondary antibody (A-11008, 1:1000, Life Technologies, USA) for 2 h at room temperature in a humid chamber box protected from light. After that, the nuclei were counterstained with 4′−6′-diamidino-2-phenylindole (DAPI, 1:1000 dilution) at room temperature for 5 min. Images were captured with an Olympus IX73 fluorescence microscope using the appropriate lenses and filters.
RNA isolation, reverse transcription PCR and quantitative real-time PCR analysis
Total RNA from A549 cells was extracted using TRIzol reagent (Invitrogen, Carlsbad, USA). The general RNA extraction was reverse transcribed into cDNA using All-in-one RT master mix (Abm, Zhenjiang, China). The expression of RNA was measured by quantitative real-time PCR (ABI, USA) with SYBR Advantage qPCR Premix (Abm, Zhenjiang, China) under recommended reaction conditions: 95°C for 30 sec, followed by 40 cycles of 95°C for 10 sec and 60°C for 34 sec. Each reaction was run in triplicate, and the average cycle threshold (Ct) value was calculated for analysis. The primer sequences were purchased from Suzhou GenePharma Co., Ltd. (Suzhou, China) and are presented in .
Table 1. Primer sequences used for gene amplification in A549 cells.
Protein extraction and Western blotting
Murine pulmonary tissue and A549 cell samples were collected, and cellular protein extracts were prepared using RIPA lysis buffer (Thermo Fisher Scientific, Waltham, MA, USA) in the presence of protease inhibitors and phosphatase inhibitors (Beyotime, Shanghai, China). Cell lysates were sonicated on ice 3 times for 20 s each. The BCA protein assay (Thermo Fisher Scientific, Waltham, MA, USA) was used to measure the concentrations of proteins. Protein samples (30 µg) were electrophoresed in 10% or 15% sodium dodecylsulfate polyacrylamide (SDS-PAGE) gels and transferred to nitrocellulose membranes (Millipore, Billerica, MA, USA). Then, the membranes were blocked with 5% nonfat milk in TBS Tween 20 at room temperature for 1 h. Membranes were probed with anti-TOM5 antibody (25607-1-AP, Proteintech, Wuhan, China), anti-β-actin (4970 L, Cell Signaling Technology, USA), anti-LC3B I/II antibody (3868 T, Cell Signaling Technology, USA), anti-ATG4B antibody (13507S, Cell Signaling Technology, USA), anti-P38 antibody (8690S, Cell Signaling Technology, USA), anti-P-P38 antibody (4511S, Cell Signaling Technology, USA), anti-Akt antibody (9272S, Cell Signaling Technology, USA) and anti-P-Akt antibody (4060S, Cell Signaling Technology, USA) overnight at 4°C. The membrane was washed three times with TBST followed by incubation for 2 h at room temperature with goat anti-rabbit horseradish peroxidase-conjugated IgG (EarthOx Life Sciences, CA, USA). The antibody – antigen complexes were detected with Immobilon Western Chemiluminescent HRP Substrate (Millipore, MA, USA) and visualized using the G: Box gel doc system (Syngene, UK).
Cell transfection
After the plasmid bacteria were cultured overnight, the plasmid DNA was extracted according to the instructions of the plasmid extraction kit (QIAGEN, German). A549 cells were seeded in 6-well plates at a density of 1 × 10⁶ cells/well and incubated with 2 ml complete DMEM for 24 h at 37 °C in 5% CO2. Plasmid DNA (2 µg) was added to 200 µL jetOPTIMUS (117-15, Polyplus transfection, USA) buffer by vortexing. Two microliters of jetOPTIMUS transfection reagent were further added to the above solution by vortexing and incubated for 10 min at room temperature. The transfection mixture described above was added to each well and cultured for 48 h.
Measurement of mitochondrial membrane potential
JC-1 reagent (65-0851-38, Invitrogen, USA) was used to measure changes in mitochondrial membrane potential. Briefly, A549 cells (5 × 10⁵ cells/mL) were seeded into 6-well plates. After transfection for 48 h, the cells were collected, washed in PBS, incubated with 2.5 μg/mL JC-1 for 20 min and protected from light. The cells were then collected by centrifugation and analyzed by flow cytometry (BD FACSVerse, USA). Red fluorescence indicated JC-1 aggregates, whereas green fluorescence indicated JC-1 monomers. Aggregated JC-1 (red fluorescence) indicates a high membrane potential, whereas monomeric JC-1 (green fluorescence) indicates membrane collapse.
Alternatively, A549 cells were provided with plasmids as described. After 48 hours, the cells were incubated with 100 μM tetramethylrhodamine methyl ester (TMRM; T668, Invitrogen, USA) in DMEM for 30 minutes at 37°C. The cells were then washed twice with 1X PBS and resuspended in 1X PBS with 1% BSA. The suspended cells were then visualized and photographed with a fluorescence microscope (Olympus, Japan). ImageJ software was used to analyze the mean fluorescence intensity.
Cell apoptosis and proliferation analysis
Apoptosis was determined by an Annexin V-PE/7-AAD kit (Vazyme, USA). After being harvested and washed twice with PBS, cells were incubated with Annexin V-PE/7-AAD for 10 min at room temperature, protected from light. The samples were analyzed by flow cytometry within 1 h after staining. Cells that were in early apoptosis were PE Annexin V positive and 7-AAD negative. The lower right quadrant was used for calculating the early apoptosis rate and statistical analysis.
Proliferation was determined by an EdU kit (R11053.9, RiboBio, Guangzhou, China) to detect cell proliferation. Cells were seeded into 96-well plates, and then 50 μM EdU solution was added to the culture medium. After 2 h, the cells were fixed in 4% formaldehyde and infiltrated using Triton X-100. Treated cells were incubated with the EDU reaction mixture and counterstained with Hoechst 33342. The staining results were observed under a fluorescence microscope. Images of five randomly selected fields of view were captured to calculate the number of EdU fusion cells.
Statistical analysis
Data are represented as the means ± SEMs. GraphPad Prism 7.0 software was used for statistical analyses. Differences between two groups were assessed by unpaired t test. The differences between 3 or more groups were analyzed with one-way analysis of variance following Tukey test or Fisher’s LSD test. Both t test and one-way ANOVA were performed for normally distributed data. Statistical significance was defined as follows: *P < 0.05; **P < 0.01; *** P < 0.001; and NS, not significant.
Results
Elevated level of TOM5 expression in OP patients
We collected lung tissue samples from 20 non-OP patients and 37 OP patients. As shown in , there were no statistically significant differences in age, sex, peripheral blood eosinophils or lymphocyte count between the OP group and the non-OP group (P > 0.05). The analysis suggested that the WBC, neutrophil, platelet, GGT, LDH and ALP levels of the OP group were significantly higher than those of the non-OP group (P < 0.05). To further understand the role of TOM5 in the pathogenesis of OP, we investigated TOM5 expression levels in tissue sections. First, HE and Masson staining were used to detect the degree of inflammatory infiltration and pulmonary fibrosis in lung sections. Both HE and Masson staining showed a significantly increased proportion of inflammatory area and collagen area in the OP group compared with the non-OP group ((A)). Similarly, as shown in (B), immunohistochemistry revealed that the TOM5 content in the lung tissues of the OP group was higher than that in the non-OP group. The proportion of inflammatory area and collagen area fraction were further tested individually for association with TOM5 expression. The relative TOM5 expression in lung tissue was positively correlated with the collagen volume fraction (R2 = 0.5024, P < 0.0001) but had no significant relationship with inflammatory infiltration (R2 = 0.03761, P = 0.1483) ((C)). In summary, TOM5 was increased in the lung tissue of patients with OP, which was positively correlated with pulmonary fibrosis.
Figure 1. TOM5 expression was elevated and associated with fibrosis in lung tissues of OP patients. (A) HE and Masson staining of lung tissue sections. Black arrow indicated inflammatory cell infiltration stained by HE. Black star indicated the mature collagen stained by Masson. Scale bars = 100 μm; (B) Representative immunohistochemical analysis of TOM5. Scale bars = 100 μm; (C) Correlation analysis between TOM5 DOI/area and the proportion of inflammatory area; Correlation analysis between TOM5 DOI/area and collagen area fraction. All experiments were repeated at least three times. * P < 0.05, ** P < 0.01, *** P < 0.001.
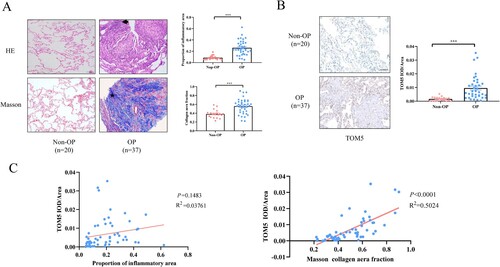
Table 2. Clinical characteristics
TOM5 was increased in the chronic model of OP.
As shown in (A), a single intratracheal injection of BLM (3 mg/kg) in C57BL/6J mice was used to induce OP pathological changes in murine lung tissues. During the observation period, the mice in both the acute model and chronic model groups showed dull hair, poor spirit, obviously reduced activity, dyspnea and a little head-like breathing, audible and wheezing sounds. The survival curves showed that there were no significant increases or decreases in either model with bleomycin treatment compared with the control group ((B)). However, body weight was significantly lower in the two groups of bleomycin-treated mice than in control mice ((B)). Lung inflammation and fibrosis were further evaluated by HE and Masson staining. Compared with the control group and chronic model group, noticeable infiltration of inflammatory cells, rupture of the alveolar wall and destruction of alveolar structural integrity were observed in the acute model group ((C)). Compared with the control group, the infiltration of inflammatory cells in the lung tissues of chronic model mice was not obvious, but the alveolar epithelial cells proliferated obviously ((C)). Masson staining indicated increased levels of collagen in the chronic model group compared with the control group ((C)). However, there was no appreciable accumulation of collagen in acute model mice compared with control mice ((C)).
Figure 2. Elevated expression of TOM5 in a chronic model of OP. (A) Establishment of a murine model of OP; (B) Survival curves and body weight changes; (C) HE and Masson staining of lung tissue sections. Black arrow indicated inflammatory cell infiltration stained by HE. Black star indicated the mature collagen stained by Masson. Scale bars = 100 μm; (D) Representative immunohistochemical analysis of TOM5. Scale bars = 100 μm; (E) TOM5 expression in murine pulmonary tissues. All experiments were repeated at least three times. * P < 0.05, ** P < 0.01, *** P < 0.001.
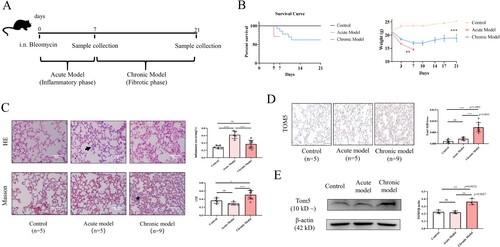
To confirm that TOM5 expression is changed in the murine model of OP, semiquantitative immunohistochemistry analysis was used. We found that TOM5 expression in the lung tissue of the chronic model group was significantly higher than that of the control group and acute model group ((D)). Similarly, the Western blot results also revealed overexpression of TOM5 in the lung tissues of chronic model mice ((E)). Collectively, TOM5 in the lung tissues from the chronic model of OP was increased, further highlighting that TOM5 may be involved in alveolar injury.
High-concentration H2O2 decreased TOM5 in the alveolar epithelial cells by activating the autophagy pathway
Excessive ROS production causes an imbalance between the oxidation products and the antioxidant capacity of cells, resulting in cell and tissue damage [Citation3]. It was previously proposed that apoptosis of alveolar epithelial cells after cell injury may be a key factor in the progression of fibrosis [Citation24,Citation25]. H2O2 is an important ROS. To mimic the pathological process of OP, A549 cells were treated with different concentrations of H2O2 (0, 25, 50, 100, 250, 500 μM), and cell viability was observed. The CCK8 results showed that cell viability first increased at lower H2O2 concentrations and then decreased at higher H2O2 concentrations. Exposure to H2O2 induced an increase in LDH release in a concentration-dependent manner ((A)). In this study, 250 μM H2O2 was used to establish an apoptosis model in A549 cells. Immunofluorescence results showed that the expression of TOM5 in A549 cells was significantly downregulated by 250 μM H2O2 for 24 hours ((B)). In addition, the qPCR and Western blot results showed that the mRNA and protein levels of TOM5 in the apoptosis model induced by 250 μM H2O2 were significantly lower than those in the control group ((C and D)).
Figure 3. High-concentration H2O2 decreased TOM5 in alveolar epithelial cells. (A) CCK8 assay and LDH release assay were used to detect the viability of A549 cells after treatment with different concentrations of H2O2, and 250 μM H2O2 was chosen to build a cell apoptosis model. (B) The expression level of TOM5 in A549 cells was detected by immunofluorescence. Scale bars = 100 μm; (C) The mRNA expression level of TOM5 in A549 cells detected by qPCR; (D) The protein expression level of TOM5 in A549 cells detected by Western blot. (E) LC3B II, LC3B I and ATG4B protein expression in A549 cells stimulated with 250 μM H2O2 for 0, 2, 4 and 8 hours; (F) The optimal intervention concentration of autophinib was detected by Western blot. LC3B II, LC3B I and ATG4B protein expression in A549 cells stimulated with 250 μM H2O2 in the presence or absence of the autophagy inhibitor autophinib; (G) TOM5 protein expression in A549 cells stimulated with 250 μM H2O2 for 8 hours in the presence or absence of autophinib. All experiments were repeated at least three times. * P < 0.05, ** P < 0.01, *** P < 0.001.
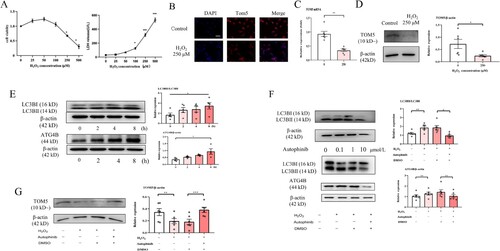
An appropriate level of autophagy is generally regarded as a protective cellular response against stress status [Citation26], while excessive autophagy promotes apoptotic cell death [Citation27]. To determine the underlying mechanisms of the inhibition of TOM5 expression in the apoptosis model, cells were stimulated with 250 μM H2O2 for 0, 2, 4 and 8 hours, and the alteration of autophagy-related proteins was detected. Western blot analysis revealed a significant increase in LC3B II/I and ATG4B expression after A549 cells were treated with 250 μM H2O2 for 8 hours, suggesting that high concentrations of H2O2 could activate the autophagy pathway ((E)). We observed that 1 μM autophinib (an autophagy inhibitor, MCE, China) significantly inhibited the activation of the autophagy pathway ((F)). In addition, 1 μM autophinib was able to effectively rescue TOM5 expression ((G)). These results indicated that high concentrations of H2O2 could inhibit the expression of TOM5 by activating the autophagy pathway.
Low-concentration H2O2 increased TOM5 in alveolar epithelial cells via the MAPK/p38 and PI3K/Akt pathways
Low concentrations of H2O2 (0, 0.1, 1 and 10 μM) were used to establish the proliferation model of A549 cells. We observed that cell viability increased with increasing concentrations of H2O2. This difference was statistically significant at 10 µM H2O2. Meanwhile, there were no significant differences in LDH release ((A)). The expression of TOM5 mRNA was significantly increased in the proliferation model induced by 10 µM H2O2 ((B)). Similarly, as shown in (C), we also observed a substantial increase in TOM5 protein expression in the proliferation model.
Figure 4. Low-concentration H2O2 increased TOM5 in alveolar epithelial cells via the MAPK/p38 and PI3 K/Akt pathways. (A) CCK8 assay and LDH release assay were used to detect the cell viability of A549 cells after intervention with different concentrations of H2O2, and 10 μM H2O2 was chosen to build the cell proliferation model. (B) The mRNA expression level of TOM5 in A549 cells detected by qPCR. (C) The protein expression level of TOM5 in A549 cells detected by Western blot. (D) P-p38, p38, p-Akt and Akt protein expression in A549 cells stimulated with 10 μM H2O2 for 0, 0.25, 0.5, 1, 2 and 4 hours; (E) P-p38, p38 and TOM5 protein expression in A549 cells stimulated with 10 μM H2O2 for 0.25 hours in the presence or absence of the p38 inhibitor. (F) P-Akt, Akt and TOM5 protein expression in A549 cells stimulated with 10 μM H2O2 for 0.25 hours in the presence or absence of the PI3 K/Akt inhibitor. All experiments were repeated at least three times. * P < 0.05, ** P < 0.01, *** P < 0.001.
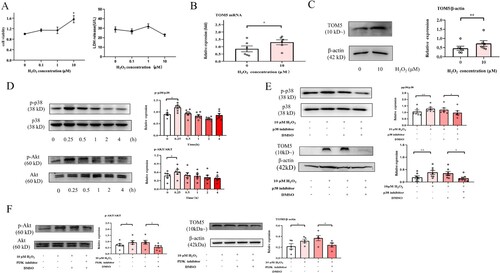
A549 cells were stimulated for 0, 0.25, 0.5, 1, 2 and 4 hours with 10 µM H2O2, and the protein levels of phosphorylated and total p38 and Akt were determined by Western blotting. As shown in (D), phosphorylation of p38 and Akt significantly increased after treatment of A549 cells with 10 µM H2O2 for 0.25 h. The inhibition assay indicated that 10 µM H2O2 could not induce an increase in TOM5 expression in A549 cells when the MAPK/p38 and PI3 K/Akt pathways were inhibited ((E and F)). The above results demonstrated that low concentrations of H2O2 can increase the expression of TOM5 by activating the MAPK/p38 and PI3 K/Akt pathways.
Impact of TOM5 on mitochondrial membrane potential
Fluorescence microscopy or Western blot was carried out to verify the efficiency of transfecting the TOM5-overexpressing plasmid or CRISPR/Cas9 plasmid in A549 cells ((A)). The functionality of mitochondria is based on their membrane potential, which can be assessed by determining the ratio of the monomeric form of JC-1 (green fluorescence) outside mitochondria relative to the aggregated form of JC-1 (red fluorescence) dye trapped in healthy mitochondria. The ratio value increased significantly when TOM5 expression was silenced in A549 cells, suggesting a decreased mitochondrial membrane potential ((B)). Similarly, downregulation of TOM5 in the proliferative model also obviously promoted the decrease in mitochondrial membrane potential ((B)).
Figure 5. Effect of TOM5 expression on mitochondrial membrane potential. (A) The effect of transfection with the TOM5-overexpressing plasmid and CRISPR/Cas9 plasmid was determined in A549 cells by immunofluorescence and Western blot assays. Scale bars = 100 μm; (B) Mitochondrial membrane potential was assessed using JC-1 in A549 cells. Scale bars = 100 μm; (C) Mitochondrial membrane potential was determined using TMRM in A549 cells. Scale bars = 100 μm. All experiments were repeated at least three times. * P < 0.05, ** P < 0.01, *** P < 0.001.
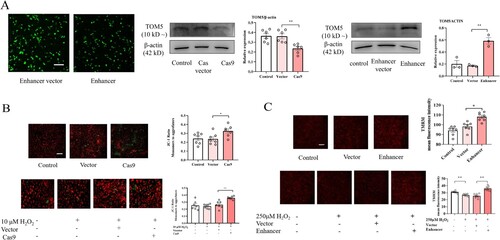
In addition, overexpression of TOM5 significantly enhanced TMRM fluorescence intensity in A549 cells ((C)). In the apoptosis model, overexpression of TOM5 also effectively alleviated the decrease in mitochondrial membrane potential ((C)). These results suggested that the expression level of TOM5 played an important role in maintaining normal mitochondrial membrane potential.
TOM5 influenced cell apoptosis and proliferation
To determine whether depletion or overexpression of TOM5 affects cell apoptosis, the A549 cells were labeled with anti-Annexin V and 7-AAD. The percentage of early apoptotic cells (Annexin V + and 7-AAD −) significantly increased after TOM5 knockdown to 11.9%, compared with 7.53% in the vector group ((A)). Conversely, the percentage of early apoptotic cells significantly decreased after TOM5 overexpression to 4.66% compared with 7.91% in the vector group ((A)).
Figure 6. Effect of TOM5 expression on cell apoptosis and proliferation. (A) and (B) Flow cytometry analysis was used to calculate the early apoptosis rate in A549 cells. All experiments were repeated at least three times. (C)-(E) Cell proliferation tested by EdU assay in A549 cells. Nuclei (blue) were labeled with Hoechst 33342. Cells were visualized and photographed with an inverted fluorescence microscope. * P < 0.05, ** P < 0.01, *** P < 0.001.
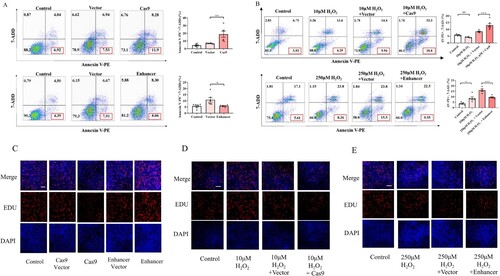
In addition, in the proliferation model of A549 cells, downregulation of TOM5 expression also obviously promoted cell apoptosis ((B)). In contrast, overexpression of TOM5 significantly inhibited apoptosis in the apoptosis model ((B)).
After EdU labeling A549 cells, cell proliferation was decreased in the low TOM5 expression group (cas9 group), whereas it was increased in the high TOM5 expression group (enhancer group) compared with their respective vector controls ((C)). In addition, TOM5 knockdown significantly inhibited cell proliferation induced by 10 µM H2O2 ((D)). Overexpression of TOM5 significantly promoted cell proliferation in the apoptosis model induced by 250 µM H2O2 ((E)). These results suggested that overexpression of TOM5 could promote the proliferation of alveolar epithelial cells.
Discussion
In the present study, we found that the expression level of TOM5 increased significantly in the lung tissue of OP patients. Similar results were observed in the chronic model of OP. We further found that the expression level of TOM5 played an important role in maintaining the normal function of mitochondria and in regulating the apoptosis and proliferation of alveolar epithelial cells.
The white blood cells and neutrophils in OP patients were significantly higher than those in the control group, which suggested elevated inflammation in OP patients. We also observed an increase in the serum levels of GGT, LDH and ALP in OP patients. The elevation of the GGT level is associated with oxidative damage in the lung of rats [Citation28]. GGT activity in type II alveolar epithelial cells increased significantly during the inflammatory stage of BLM-induced lung injury in rats [Citation29]. Likewise, it has been proven that serum LDH levels in fibrotic interstitial lung disease patients were significantly higher than those in nonfibrotic interstitial lung disease patients [Citation30]. Serum ALP is an important indicator to measure the degree of lung fibrosis [Citation31]. These results were in agreement with our findings. Our results showed that the degree of inflammatory cell infiltration and fibrosis in the lung tissue of OP patients was significantly higher than that of the non-OP group. This was consistent with the abovementioned pathological features of OP. We further performed immunohistochemistry of lung tissue for TOM5 expression. The present study demonstrated that the expression of TOM5 in the OP group was significantly higher than that in the non-OP group and was positively associated with the extent of pulmonary fibrosis. This finding may appear to contradict the conclusions of an earlier study where the lung tissue of TOM5-/ – mice presented with OP-like histopathology [Citation8]. Studies have shown that OP is characterized by mitochondrial dysfunction and excessive production of ROS [Citation32–34]. TOM5 deletion interferes with the protein transport process, which may lead to mitochondrial dysfunction and cell death and increase susceptibility to OP [Citation9,Citation10]. Therefore, we speculate that TOM5 might be a protective factor in the occurrence and development of OP. The data obtained from our clinical specimens and murine model showed that the expression of compensatory TOM5 increased during alveolar injury caused by mitochondrial dysfunction due to inflammation and bleomycin. However, in TOM5-/ – mice, the loss of TOM5 expression may exacerbate mitochondrial dysfunction, aggravate the degree of lung injury and damage to alveolar epithelial cells, and contribute to the release of growth factors and profibrotic mediators, which aid in the differentiation of fibroblasts into myofibroblasts, thus accelerating the process of pulmonary fibrosis [Citation34].
In our study, we constructed a mouse model of OP with a low concentration of bleomycin. In the lung tissue of the acute model group, the pathological changes were mainly alveolar epithelial cell injury and inflammatory infiltration, similar to the early features of OP pathology. The pathological changes in the lungs in the chronic model group were mainly fibrosis and epithelial hyperproliferation, while the degree of inflammatory infiltration was significantly less than that in the acute model, which is similar to the pathological characteristics in the middle stage of OP.
At the cellular level, proliferative and apoptosis models of A549 cells were constructed by different concentrations of H2O2. We observed differences in the expression of TOM5 in different models in vitro, namely, the expression of TOM5 was significantly increased in the cell proliferation model, while it was significantly decreased in the cell apoptosis model. As mentioned above, the proliferation of type II alveolar epithelial cells was a predominant pathological feature of OP, which was also consistent with our in vivo results. Various types of idiopathic interstitial lung diseases share similarities in pathogenetic processes [Citation34–36]. The progression of IPF (a kind of idiopathic interstitial lung disease) was confirmed to have an association with autophagy and mitochondrial dysfunction [Citation37]. Type II alveolar epithelial cells are secretory cells with high energy demands and contain abundant mitochondrial mass [Citation38]. In the present study, a high concentration of H2O2 reduced the expression of TOM5 via activation of autophagy in A549 cells. We further found that low concentrations of H2O2 may increase the expression of TOM5 by activating the MAPK/p38 and PI3 K/Akt pathways. It was previously demonstrated that MAPK/p38 pathways could be effectively activated in the middle stage of pulmonary fibrosis, and the use of inhibitors effectively inhibited the progression of pulmonary fibrosis [Citation39], which was consistent with our results. Although we do not understand why the pathological damage in TOM5-/ – mice was limited to alveolar epithelial cells, it suggested that TOM5 was particularly important for maintaining mitochondrial function in this unique environment of the lung [Citation8]. A drop in mitochondrial membrane potential is an early and critical step in the intrinsic apoptosis pathway (also known as the mitochondrial apoptotic pathway) [Citation40]. We found that the decreased expression of TOM5 could cause a decrease in mitochondrial membrane potential, while the overexpression of TOM5 could significantly inhibit the decrease in mitochondrial membrane potential. It was suggested that the expression level of TOM5 played an important role in maintaining normal mitochondrial membrane potential. Through Annexin-V/7-AAD analysis, we found that low expression of TOM5 promoted A549 cell apoptosis, especially early apoptosis, and vice versa. Subsequently, we detected that overexpression of TOM5 facilitated the proliferation of A549 cells, and vice versa. A study showed that quantum dots (QDs, a new type of inorganic semiconductor nanofluorescent material) could increase ROS levels in cells, interfere with mitochondrial membrane potential, affect the morphology of mitochondria, and cause oxidative stress to trigger a cascade reaction leading to cell apoptosis [Citation9]. This series of cellular changes was associated with key nuclear genes such as TOM5 [Citation9]. Likewise, another study showed that H2O2 concentrations above 75μM can directly cause ROS levels to increase, thereby damaging mitochondrial membrane function, which was consistent with our results [Citation41].
CADM1, an epithelial cell adhesion molecule, can produce a membrane-related C-terminal fragment, namely, α CTF. Once αCTF is produced in type II alveolar epithelial cells, it preferentially accumulates in mitochondria, thereby depolarizing the mitochondrial membrane potential and further activating the apoptotic pathway in type II alveolar epithelial cells [Citation42] The αCTF mechanism has profound effects on the pathogenesis of COP [Citation43]. Moreover, Kasturi Mitra et al. used TMRE to detect the mitochondrial membrane potential in cells in different phases of the cell cycle and found that the mitochondrial membrane potential was the highest in G1-S phase [Citation44]. If the mitochondrial membrane potential was reduced, the progression of the cell from late G1 to S phase could be specifically prevented [Citation44]. If mitochondrial function is overamplified, it could lead to the loss of control of the G1 to S transition, which leads to tumorigenesis [Citation44]. Therefore, we speculated that TOM5 might affect apoptosis and proliferation of type II alveolar epithelial cells by regulating mitochondrial membrane potential.
However, our study had certain limitations. First, this animal model can only simulate the changes in lung inflammation and fibrosis in the early and middle stages of OP to a certain extent, and no typical granulation tissue was found. Second, the proliferation and apoptosis of type II alveolar epithelial cells are important but only part of the entire process of OP. It can only explain part of the disease state. With the development of OP, its effect may be attenuated, while the role of fibrosis is gradually strengthened [Citation25]. Third, double immunofluorescence staining for TOM5 and a proliferation marker of lung samples from OP patients and lung sections from murine model may be more intuitive. We intend to explore the intrinsic mechanism of TOM5 and fibrosis in follow-up work.
In summary, we demonstrated that TOM5 may participate in the development of OP.
High concentrations of H2O2 inhibited TOM5 expression in A549 cells by activating the autophagy pathway, while low concentrations of H2O2 promoted TOM5 expression by activating the MAPK/p38 and PI3 K/Akt pathways. Moreover, TOM5 might affect the apoptosis and proliferation of A549 cells by changing the mitochondrial membrane potential. Therefore, our study provided insight into the potential mechanism of occurrence and development of OP.
Author contributions
YQ, XZ, XL and XL performed experiments and statistical analyses; YQ drafted the manuscript; QY and ZW contributed to discussions of the manuscript; MZ, MH and NJ supervised the study, obtained funding, and revised the manuscript. All authors approved the final version of the manuscript.
Disclosure statement
No potential conflict of interest was reported by the author(s).
Data availability statement
The data presented in this study are available upon request from the corresponding author.
Correction Statement
This article has been corrected with minor changes. These changes do not impact the academic content of the article.
Additional information
Funding
References
- Yilmaz S, Akinci Ozyurek B, Erdogan Y, et al. Retrospective evaluation of patients with organizing pneumonia: is cryptogenic organizing pneumonia different from secondary organizing pneumonia? Tuberk Toraks. 2017;65(1):1–8.
- Wang Z, Wu C, Zhu R, et al. Airway invasive aspergillosis with organizing pneumonia: a case report and review of literature. Ann Transl Med. 2020;8(7):504), doi:10.21037/atm.2020.03.162
- Mueller-Mang C, Grosse C, Schmid K, et al. What every radiologist should know about idiopathic interstitial pneumonias. Radiographics. 2007;27(3):595–615. doi:10.1148/rg.273065130
- Kim SJ, Lee KS, Ryu YH, et al. Reversed halo sign on high-resolution CT of cryptogenic organizing pneumonia: diagnostic implications. AJR Am J Roentgenol. 2003;180(5):1251–1254. doi:10.2214/ajr.180.5.1801251
- Kligerman SJ, Franks TJ, Galvin JR. From the radiologic pathology archives: organization and fibrosis as a response to lung injury in diffuse alveolar damage, organizing pneumonia, and acute fibrinous and organizing pneumonia. Radiographics. 2013;33(7):1951–1975. doi:10.1148/rg.337130057
- Kastelik JA, Greenstone M, McGivern DV, et al. Cryptogenic organising pneumonia. Eur Respir J. 2006;28(6):1291), doi:10.1183/09031936.00100106
- Araiso Y, Tsutsumi A, Qiu J, et al. Structure of the mitochondrial import gate reveals distinct preprotein paths. Nature. 2019;575(7782):395–401. doi:10.1038/s41586-019-1680-7
- Vogel P, Read RW, Rehg JE, et al. Cryptogenic organizing pneumonia in Tomm5(-/-) mice. Vet Pathol. 2013;50(1):65–75. doi:10.1177/0300985812450723
- Pasquali F, Agrimonti C, Pagano L, et al. Nucleo-mitochondrial interaction of yeast in response to cadmium sulfide quantum dot exposure. J Hazard Mater. 2017;324(Pt B):744–752.
- Kang Y, Fielden LF, Stojanovski D. Mitochondrial protein transport in health and disease. Semin Cell Dev Biol. 2018;76:142–153. doi:10.1016/j.semcdb.2017.07.028
- Habich M, Salscheider SL, Riemer J. Cysteine residues in mitochondrial intermembrane space proteins: more than just import. Br J Pharmacol. 2019;176(4):514–531. doi:10.1111/bph.14480
- Budzinska M, Galganska H, Karachitos A, et al. The TOM complex is involved in the release of superoxide anion from mitochondria. J Bioenerg Biomembr. 2009;41(4):361–367. doi:10.1007/s10863-009-9231-9
- Kanoh S, Kobayashi H, Motoyoshi K. Exhaled ethane: an in vivo biomarker of lipid peroxidation in interstitial lung diseases. Chest. 2005;128(4):2387–2392. doi:10.1378/chest.128.4.2387
- Travis WD, Costabel U, Hansell DM, et al. An official American Thoracic Society/European Respiratory Society statement: update of the international multidisciplinary classification of the idiopathic interstitial pneumonias. Am J Respir Crit Care Med. 2013;188(6):733–748. doi:10.1164/rccm.201308-1483ST
- Williamson JD, Sadofsky LR, Hart SP. The pathogenesis of bleomycin-induced lung injury in animals and its applicability to human idiopathic pulmonary fibrosis. Exp Lung Res. 2015;41(2):57–73. doi:10.3109/01902148.2014.979516
- Huh JW, Kim DS, Oh YM, et al. Is metalloproteinase-7 specific for idiopathic pulmonary fibrosis? Chest. 2008;133(5):1101–1106. doi:10.1378/chest.07-2116
- Li S, Liu YZ, Huang H, et al. The role of histone deacetylases in the pathogenesis of idiopathic pulmonary fibrosis and cryptogenic organizing pneumonia. Zhonghua Jie He He Hu Xi Za Zhi. 2019;42(5):361–366.
- Pujols L, Xaubet A, Ramirez J, et al. Expression of glucocorticoid receptors and in steroid sensitive and steroid insensitive interstitial lung diseases. Thorax. 2004;59(8):687–693. doi:10.1136/thx.2003.013268
- Oliveira CC, Fabro AT, Ribeiro SM, et al. Evaluation of the use of transbronchial biopsy in patients with clinical suspicion of interstitial lung disease. J Bras Pneumol. 2011;37(2):168–175. doi:10.1590/S1806-37132011000200006
- Strieter RM. Mechanisms of pulmonary fibrosis: conference summary. Chest. 2001;120(1 Suppl):77S–85S.
- Ganzleben I, He GW, Gunther C, et al. PGAM5 is a key driver of mitochondrial dysfunction in experimental lung fibrosis. Cell Mol Life Sci. 2019;76(23):4783–4794. doi:10.1007/s00018-019-03133-1
- Foster KA, Oster CG, Mayer MM, et al. Characterization of the A549 cell line as a type II pulmonary epithelial cell model for drug metabolism. Exp Cell Res. 1998;243(2):359–366. doi:10.1006/excr.1998.4172
- Lieber M, Smith B, Szakal A, et al. A continuous tumor-cell line from a human lung carcinoma with properties of type II alveolar epithelial cells. Int J Cancer. 1976;17(1):62–70. doi:10.1002/ijc.2910170110
- Kuwano K, Hagimoto N, Nakanishi Y. The role of apoptosis in pulmonary fibrosis. Histol Histopathol. 2004;19(3):867–881.
- Chung WY, Sun JS, Park JH, et al. Epithelial apoptosis as a clinical marker in idiopathic interstitial pneumonia. Respir Med. 2010;104(11):1722–1728. doi:10.1016/j.rmed.2010.05.013
- Gump JM, Thorburn A. Autophagy and apoptosis: what is the connection? Trends Cell Biol. 2011;21(7):387–392. doi:10.1016/j.tcb.2011.03.007
- Boya P, Gonzalez-Polo RA, Casares N, et al. Inhibition of macroautophagy triggers apoptosis. Mol Cell Biol. 2005;25(3):1025–1040. doi:10.1128/MCB.25.3.1025-1040.2005
- Takahashi Y, Takahashi S, Yoshimi T, et al. Increases in the mRNA levels of γ-Glutamyltransferase and heme oxygenase-1 in the rat lung after ozone exposure. Biochem Pharmacol. 1997;53(7):1061–1064. doi:10.1016/S0006-2952(97)00104-4
- Karam H, Hurbain-Kosmath I, Housset B. Antioxidant activity in alveolar epithelial type 2 cells of rats during the development of bleomycin injury. Cell Biol Toxicol. 1998;14(1):13–22. doi:10.1023/A:1007460320109
- Dasdemir Ilkhan G, Demirci Ucsular F, Celikhisar H, et al. Original article: clinical research. Sarcoidosis Vasc Diffuse Lung Dis. 2021;38(2):e2021020.
- Liu H, Li Y, Zou Y, et al. Influence of miRNA-30a-5p on pulmonary fibrosis in mice with streptococcus pneumoniae infection through regulation of autophagy by beclin-1. Biomed Res Int. 2021;2021: 9963700.
- Yamashita M, Saito R, Yasuhira S, et al. Distinct profiles of CD163-positive macrophages in idiopathic interstitial pneumonias. J Immunol Res. 2018;2018: 1436236.
- Thomas AQ, Lane K, Phillips, 3rd J, et al. Heterozygosity for a surfactant protein C gene mutation associated with usual interstitial pneumonitis and cellular nonspecific interstitial pneumonitis in one kindred. Am J Respir Crit Care Med. 2002;165(9):1322–1328.
- Samarelli AV, Tonelli R, Marchioni A, et al. Fibrotic idiopathic interstitial lung disease: the molecular and cellular Key players. Int J Mol Sci. 2021;22(16):8952.
- Wells AU, Flaherty KR, Brown KK, et al. Nintedanib in patients with progressive fibrosing interstitial lung diseases-subgroup analyses by interstitial lung disease diagnosis in the INBUILD trial: a randomised, double-blind, placebo-controlled, parallel-group trial. Lancet Respir Med. 2020;8(5):453–460. doi:10.1016/S2213-2600(20)30036-9
- Maher TM, Corte TJ, Fischer A, et al. Pirfenidone in patients with unclassifiable progressive fibrosing interstitial lung disease: a double-blind, randomised, placebo-controlled, phase 2 trial. Lancet Respir Med. 2020;8(2):147–157. doi:10.1016/S2213-2600(19)30341-8
- Vasarmidi E, Sarantoulaki S, Trachalaki A, et al. Investigation of key autophagy-and mitophagy-related proteins and gene expression in BALF cells from patients with IPF and RA-ILD. Mol Med Rep. 2018;18(4):3891–3897.
- Massaro GD, Gail DB, Massaro D. Lung oxygen consumption and mitochondria of alveolar epithelial and endothelial cells. J Appl Physiol. 1975;38(4):588–592. doi:10.1152/jappl.1975.38.4.588
- Madala SK, Schmidt S, Davidson C, et al. MEK-ERK pathway modulation ameliorates pulmonary fibrosis associated with epidermal growth factor receptor activation. Am J Respir Cell Mol Biol. 2012;46(3):380–388. doi:10.1165/rcmb.2011-0237OC
- Zeng M, Huang C, Zheng H, et al. Effects of ghrelin on iNOS-derived NO promoted LPS-induced pulmonary alveolar epithelial A549 cells apoptosis. Cell Physiol Biochem. 2018;49(5):1840–1855. doi:10.1159/000493630
- Park WH. MAPK inhibitors, particularly the JNK inhibitor, increase cell death effects in H2O2-treated lung cancer cells via increased superoxide anion and glutathione depletion. Oncol Rep. 2018;39(2):860–870.
- Mimae T, Hagiyama M, Inoue T, et al. Increased ectodomain shedding of lung epithelial cell adhesion molecule 1 as a cause of increased alveolar cell apoptosis in emphysema. Thorax. 2014;69(3):223–231. doi:10.1136/thoraxjnl-2013-203867
- Kuwano K, Hagimoto N, Maeyama T, et al. Mitochondria-mediated apoptosis of lung epithelial cells in idiopathic interstitial pneumonias. Lab Invest. 2002;82(12):1695–1706. doi:10.1097/01.LAB.0000045084.81853.76
- Mitra K, Wunder C, Roysam B, et al. A hyperfused mitochondrial state achieved at G1-S regulates cyclin E buildup and entry into S phase. Proc Natl Acad Sci U S A. 2009;106(29):11960–5. doi:10.1073/pnas.0904875106