
 ?Mathematical formulae have been encoded as MathML and are displayed in this HTML version using MathJax in order to improve their display. Uncheck the box to turn MathJax off. This feature requires Javascript. Click on a formula to zoom.
Abstract
Advances in information and communication technology (ICT) have provided a platform for the introduction and diffusion of a range of financial technologies that have transformed the financial sector. This study analyses the diffusion of financial technology (fintech) and its interaction with financial inclusion and living standards (GDP per capita). We consider the determinants and effects of technology diffusion in financial services and identify two possible transmission mechanisms from the financial sector to GDP per capita – a fintech diffusion channel and a financial inclusion channel. We specify the interactions between these two channels and their relationship with income per capita. Our empirical analysis focuses on the diffusion of two enabling fintech innovations: ATMs and associated digital networks; and mobile phones and payments systems. The relationships between fintech diffusion, financial inclusion and GDP per capita are estimated using a panel data set for up to 137 countries over the period 1991–2015 using both cross section and panel techniques, including an error correction model that distinguishes short- and long-run effects. A key finding is that fintech diffusion and financial inclusion have long-run effects on GDP per capita over and above their short-run impact and the effects of investment in fixed and human capital.
1. Introduction
The financial sector has experienced something of a technological revolution over recent decades as information and communication technology (ICT) platforms have facilitated the diffusion of an array of financial technologies (fintech) from automated teller machines (ATMs) and associated digital networks, mobile payments systems, mobile wallets online banking, automated credit scoring techniques (robo advisers) and block-chain technologies.Footnote1 It is only recently that the term fintechFootnote2 has slipped into common usage, however, the emergence of fintech has its roots in the development of ATM networks in the 1980s and 1990s. The digitalisation of financial services and the creation of secure, non-proprietary digital networks enabled the growth of ATM networks and provided a technological platform for further advances in fintech, including internet banking, mobile money and digital payments systems. While the diffusion of fintech has transformed the financial sector, few studies have investigated the effect of technological change in the financial services sector on financial inclusion and living standards. The present paper aims to fill this gap by exploring the factors driving the diffusion of two enabling financial technologies and their impact on financial inclusion and per capita incomes in over 130 countries. In particular, we specify a fintech diffusion channel and a financial inclusion channel to explore how technological change in the financial services sector impacts the real economy.
Fintech diffusion provides an important channel via which financial sector development may permanently raise living standards. This channel is worthy of consideration as it is well known that most of the benefits from innovation flow not from the original production of ideas, or inventions, but from their widespread adoption and use by firms and households (Comin and Hobijn Citation2010; Stoneman and Battisti Citation2010). The diffusion of fintech via the creation of digital networks, associated ATM networks, mobile money and payments systems, has direct and indirect effects. Digitalisation of financial services and the creation of non-proprietary digital networks can raise productivity and efficiency in the financial services sector itself – where the effects are likely to be strong because of positive network externalities (Hall and Kahn Citation2003; Scott, Van Reenen, and Zachariadis Citation2017). In addition, digital networks provide a technological platform on which to expand the reach of financial service providers, thus increasing financial inclusion (Batiz-Lazo Citation2018), mobilising savings and enhancing both the extent and allocation of investment in the wider economy. Financial technologies, such as, mobile phones, money and payments systems, may also ‘enable developing countries to “leapfrog” to more efficient and modern economic systems’ (Lashitew, van Tulder, and Liasses Citation2019, 1201), thus promoting convergence across countries.
This paper extends the existing literatures on fintech diffusion and financial inclusion in the following ways. First, we examine the factors shaping the diffusion of two pervasive fintech products – automated teller machines (ATMs) that exemplify the use of digital networks (Batiz-Lazo Citation2018), and mobile phones and payments systems. Second, we consider the factors shaping financial inclusion, including the role of ATMs, digital networks and mobile phone and payments systems, as well as socio-economic factors (Graff Citation2005). Third, we analyse the joint impact of these two effects – fintech diffusion and financial inclusion – on GDP per capita in both the short run and the long run. We also consider the inter-relations between fintech diffusion, financial inclusion and GDP per capita. Our theoretical analysis identifies both a fintech diffusion channel and a financial inclusion channel, thus identifying two transmission mechanisms from the finance sector to the real economy that capture the enabling features of ICT and fintech mentioned by Lashitew, van Tulder, and Liasses (Citation2019), Baldwin (Citation2016) the FSA (Citation2019) and Leong and Sung (Citation2018). The fintech diffusion channel captures the direct and indirect effects of technological progress in financial services on productivity in the financial sector and the wider economy via more efficient provision of financial services to households, business and government. It is distinct from previous work, for example, the ‘ideas' production channel identified by Madsen and Ang (Citation2016) since it focuses on the diffusion and use of financial technologies, associated network externalities and knock on effects.Footnote3
Fourth, in order to capture short and long-run effects, we employ an error correction model that enables us to identify long-run relationships between fintech, financial inclusion and living standards. The model is estimated using a panel data set for up to 137 countries over a 25-year time span (1991–2015). A key finding is that fintech diffusion and financial inclusion have long run effects on GDP per capita over and above their short run impact through capital accumulation.
The remaining sections are organised as follows. Section 2 provides a brief review of the literatures on technology diffusion, financial sector development and growth. Section 3 explains our hypotheses concerning the channels via which key financial technologies may influence financial inclusion and living standards (allowing for the possibility of feedback effects) and describes the derivation and specification of our econometric models. Section 4 provides discussion of our datasets and presents results from our econometric estimations using cross section analysis, including single equation models, three stage least squares and panel data analysis with an error correction model that allows us to identify the short and long-run effects of fintech diffusion and financial inclusion on GDP per capita. The results from our error correction model provide evidence of significant long-run relationships between the extent of diffusion of key financial technologies, financial inclusion and GDP per capita. The final section of the paper draws a number of conclusions for policy makers and identifies areas for further research.
2. Transmission channels in the finance-growth nexus
King and Levine’s (Citation1993) seminal paper on financial development and growth starts from the Schumpeterian thesis that finance is essential for innovation and economic development and explores the relationship between various indicators of financial development and growth. The main channels identified by King and Levine stem from the role of financial intermediaries in catalysing savings and investment, and improving the allocation of capital, thus enabling innovation in the wider economy. Notwithstanding their emphasis on Schumpeter’s ‘finance-innovation-economic development’ thesis, there has been relatively little discussion of how finance leverages technological change. Rather, the emphasis in much of the finance-growth literature has been on the role of financial sector development on savings, investment and capital allocation, and much empirical analysis has focused on reduced form estimates of relationships between indicators of financial development and growth. The lack of attention to the creation and diffusion of innovations is curious, as a well-known result from growth theory is that while savings and investment may affect growth in the short run, in the long run productivity and growth are determined by technological change.
As Madsen and Ang (Citation2016) note, many studies on the finance-growth nexus utilise cross section or panel data techniques to regress growth, or GDP per capita, on indicators of financial development without exploring the transmission mechanisms from the financial sector to the real economy and few studies (King and Levine Citation1993; Beck, Levine, and Loayza Citation2000; Benhabib and Spiegel Citation2000; Graff Citation2005; Laeven, Levine, and Michalopoulos Citation2015; Madsen and Ang Citation2016; Comin and Nanda Citation2019 are notable exceptions) have explored the role of finance in shaping total factor productivity growth (TFP) or technological change. Of these, King and Levine (Citation1993) and Beck, Levine, and Loayza (Citation2000) estimate TFP as a residual after accounting for growth in capital and labour inputs and regress estimates of residual TFP on measures of financial intermediation and development. Both studies find that TFP is positively and significantly correlated with financial development.
However, the question of how technological innovations are created and diffused has received little attention in the finance-growth literature. Madsen and Ang (Citation2016) provide new insight into the invention channel linking finance and growth, by explicitly using an ‘ideas' production function (Porter and Stern Citation2000) as a core mechanism via which financial sector development leads to permanent increases in living standards (Madsen and Ang Citation2016, 552). Using an endogenous growth framework, their results demonstrate the importance of the finance-invention-growth channel (beyond savings, investment and capital allocation) using a specially constructed panel database for 21 OECD countries over the period 1870–2009.
While Madsen and Ang’s study finds empirical evidence of a finance-invention-growth channel, their focus is on ‘ideas' production in the wider economy, and they do not explicitly consider technological innovation in the financial sector per se. Nor do they model the extent of diffusion of financial technologies.Footnote4 Indeed, despite recent interest in fintech, relatively little attention has been devoted to financial innovation as a transmission channel from financial sector development to productivity and growth. An early study by Silber (Citation1983) reviewed 38 financial innovations including ATMs and electronic payments and found that they reduced financial constraints, thus enhancing welfare at the macro level. Similarly, Zilberfarb (Citation1989) found that ATMs increased demand deposits. More recently, Laeven, Levine, and Michalopoulos (Citation2015), Beck et al. (Citation2016), considered the impact of financial innovation on growth and macroeconomic development, while Lashitew, van Tulder, and Liasses (Citation2019) and Jagtiani and Lemieux (Citation2018) explore the effects of mobile phones and fintech on financial inclusion.
The wider literature on innovation and technology diffusion suggests additional channels that may potentially underlie the finance-growth nexus, most notably the adoption and diffusion of financial technologies and their interrelations with financial inclusion and prosperity. While the invention of new products and processes is an important source of productivity growth, it is their diffusion that has the largest impact on the level of economic development and living standards. Comin and Hobijn (Citation2010) estimate that the average time for technologies to diffuse across countries is 45 years, and that differences in the extent of diffusion account for around 25% of the differences in GDP per capita across countries. Yet, the role of technology diffusion generally, and of fintech diffusion in particular, has received little attention in the finance-growth literature to date. Understanding fintech diffusion is important since the omnipresent use of financial services by business, households and government suggests that technology induced productivity gains in the financial sector can have far-reaching effects on the real economy.
The ability of financial systems to mobilise and channel savings to finance both R&D (‘ideas' production) and technology diffusion is important in catalysing technological progress and associated improvements in living standards. The extent of financial inclusion plays a critical part in this process. However, standard models often assume that everyone is banked and ignore differences in financial sector coverage associated with the fact that around 1.7 billion people over the age of 15 are excluded from formal financial systems (World Bank Citation2018). Put differently, formal financial systems are currently unable to mobilise the savings of around 30% of the world’s adult population and the extent of financial inclusion varies significantly across countries and over time. Extant empirical research shows that an increase in financial inclusion is associated with an increase in savings, consumption and productive investments (Dupas and Robinson Citation2013). Given the productivity and equality-enhancing effects of financial inclusion, governments around the world have more inclusive finance as a policy objective as a means of raising savings and investment. Fintech diffusion provides an important transmission mechanism via which productivity gains and increases in financial inclusion raise GDP per capita. It also opens up the possibility of effective policy instruments centred on catalysing technology diffusion and developing fintech infrastructure and support.
In the following section, we set out two specific channels via which financial sector development may influence living standards – the fintech diffusion channel and the financial inclusion channel – and the interactions between them. In particular, we study the diffusion and impact of two key financial technologies that have transformed finance – ATMs and associated digital networks; and mobile phone network payments systems – their interaction with each other and their relationship with financial inclusion and per capita income over time and across countries.
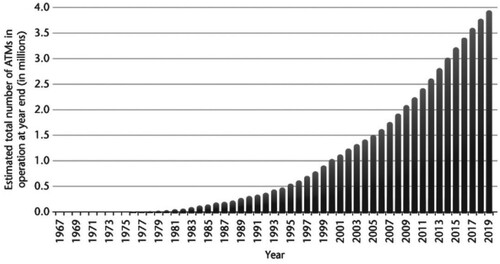
There is some evidence to suggest that ICT technologies are diffusing more quickly than traditional technologies such as rail, passenger cars and electricity production (Comin and Hobijn Citation2010), however, Figure shows that fintech diffusion is a slow and variable process across time and countries. Panels A and B illustrate the point with respect to mobile phones: while the extent of diffusion has increased over time, the variability remains high across countries some 40 years after mobile phone technology was initially introduced. Figure shows the adoption of ATMs which has grown significantly since they were first introduced. As Batiz-Lazo (Citation2018) notes, ATMs embody digital networks and markets, interoperability protocols, security software, and card recognition/reading technologies, that are every bit as significant, if not more significant technologically, than the cash machines themselves. There is considerable variation in the extent of diffusion of ATMs, with the number of ATMs per capita varying from zero to 1.88, and much of the growth in the total number of ATMs reflecting catch up by lagging economies driven by growing financial inclusion (Batiz-Lazo Citation2018).
Figure 1. Mobile phone penetration rate (data from World Development Indicators). Source: figures created by the authors.
Note: This figure shows the penetration rate of mobile phone across the globe before 2000. The penetration rate is measured by the number of mobile cellular subscriptions (per 100 people).
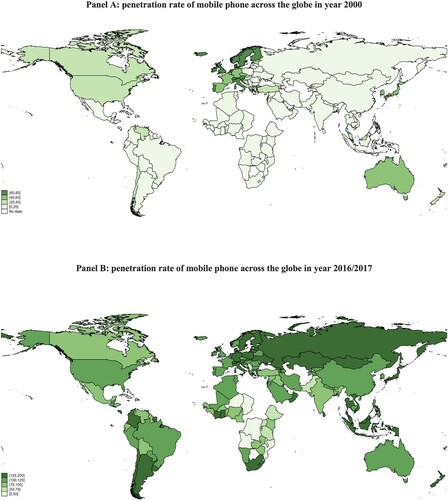
Figure 2. Diffusion of ATMs. Source: Batiz-Lazo (Citation2018).
3. Technology diffusion, financial inclusion and GDP per capita
A variety of approaches have been used in the finance-growth literature. Studies, such as King and Levine (Citation1993) and Beck, Levine, and Loayza (Citation2000) are couched in terms of Solow-type growth models that are used to estimate TFP and seek to endogenise the residual by regressing TFP on finance variables and control variables. Building on this approach, we start from a standard production function (Aghion and Howitt Citation1998),
(1)
(1) where Y is output (GDP), A represents technology and other factors affecting productivity, K is the stock of capital, h is human capital per worker, L is employment and the exponents α and 1-α can be considered as factor shares. Equation (1) can be re-expressed in terms of GDP per capita (Madsen and Ang Citation2016) to obtain,
(2)
(2) When expressed in terms of growth, long-run improvements in GDP per capita depend on improvements in human capital and changes in A or technological progress. In terms of levels of GDP per capita, A is a productivity parameter that represents the extent of technological diffusion (Barro and Sala-i-Martin Citation1997) and non-technological factors that influence the efficiency of technologies and factors of production, for example, social capital, governance, trust (Graff Citation2005; Beck, Levine, and Loayza Citation2000; Comin and Hobijn Citation2010).
Madsen and Ang (Citation2016) identify an ‘ideas' production transmission channel from financial sector development to technological progress, by specifying growth in A as a function of research and development (R&D) intensity, financial development and scale effects. Hence, increases in income per capita are determined in the short run by investment in fixed and human capital, while permanent or long-run increases in productivity are shaped by ‘ideas' production facilitated by financial development. Provided there are scale effects, financial sector development has long-run impact on growth and prosperity.
Instead of focusing on R&D and ideas production, we analyse a diffusion transmission mechanism that captures the impact of fintech diffusion on GDP per capita. The extent of technological diffusion is distinct from ‘ideas' production or invention, and an important determinant of technological capability and productivity. Moreover, it is the diffusion of technology rather than its invention that has the largest impact on productivity and GDP per capita. Fintech diffusion or the adoption of financial technologies also determines and is determined by, financial inclusion – as mobile payments or digital ATM networks expand, the greater the benefits to individual users from network externalities or scale effects. Non-proprietary digital networks and payments systems that connect customers across many banks, provide platforms for improved financial service provision that enhances financial inclusion. Digital networks and payments systems are subject to positive network externalities or scale effects arising from the greater benefits of using mobile payments systems or ATM machines as the network of users and banks expands.
Numerous studies have confirmed that cross country differences in income per capita are related to cross-country differences in the extent of technological diffusion (e.g. Hall and Kahn Citation2003; Caselli Citation2005; Freeman Citation1989; Hall and Jones Citation1999; Hsieh and Klenow Citation2010). In our empirical estimations, we endogenise, A, by specifying it as a function of the extent of the technological diffusion, and non-technological factors, such as, institutional quality (Graff Citation2005) and financial inclusion. Financial inclusion is also determined by the extent of diffusion of financial technology, since mobile phones and ATMs increase access to financial services, and both variables influence income per capita through A.
Thus, we have a three equation system that we specify econometrically across countries and time, where:
income per capita in country i at time t is determined by capital accumulation, human capital, employment and Ait, which is a function of the extent of fintech diffusion, financial inclusion and other variables;
the extent of fintech diffusion is shaped by financial inclusion and GDP per capita and a number of economic and socio-economic variables (Graff Citation2005); and
financial inclusion is determined by GDP per capita, fintech, financial infrastructure, economic structure and socio-economic variables, including political and economic stability and freedom from corruption.
3.1. Determinants of the extent of fintech diffusion
In view of the fact that most of the benefits from inventions come not from ‘ideas' production or invention but from their widespread adoption and diffusion, our econometric specification lets the productivity or technology parameter, Ait, be proxied by the extent of diffusion, :
(3)
(3) where Dict is the extent of diffusion of technology c in country
, at time t.
is the financial inclusion index,
is the GDP per capita,
are control variables, including trade, which is expected to stimulate innovation diffusion (Eaton and Kortum Citation1996), urbanisation, and a composite stability index, while
is a disturbance term.
We proxy the extent of fintech diffusion by ATM networks and mobile phone usage. ATM networks incorporate sophisticated digital networks and security technology, while mobile phones, wallets and associated payments systems rely on complex digital networks and security protocols. Both are subject to positive network externalities because the utility of these technologies increases, as the number of banks, payments system agents, firms, and retail customers connected to the respective networks, increases. We therefore expect financial inclusion to have a positive effect on fintech diffusion. This direct transmission mechanism from financial inclusion to fintech diffusion stems fundamentally from positive network externalities and is in addition to the positive effect that financial inclusion may have on income per capita via savings and capital investment, which is specified in Equation (5) below.
3.2. Effect of fintech diffusion on financial inclusion
Financial inclusion is determined by financial technologies that facilitate efficient access to banking services, human capital (Grohmann, Klühs, and Menkhoff Citation2018) socio-economic variables and financial and political stability (Graff Citation2005). Hence, we specify the following econometric model:
(4)
(4) where the dependent variable (
) represents the financial inclusion index of country
at time t,
is the extent of diffusion of technological innovation,
is a human capital indicator,
are control variables, including absence of corruption (Clausen, Kraay, and Nyiri Citation2011), government spending as a Keynesian demand side factor, socio-economic and political factors identified by Graff (Citation2005) and
is an error term.
We use two indicators of financial inclusion: the first is the percentage of respondents who report having an account at a bank or another type of financial institution.Footnote5 This variable comes from the Global Findex database.Footnote6 This indicator is a direct measure of the access dimension of financial inclusion (see, Allen et al. Citation2016). The second indicator is the overall financial development index and three of its sub-components (financial institutions depth, financial institutions access, and financial institutions efficiency) proposed by Svirydzenka (Citation2016).
3.3. Effects of fintech diffusion and financial inclusion on GDP per capita
The effects of financial inclusion and technology diffusion on living standards are captured by the following specification of Equation (2),
(5)
(5) where
is the log of per capita income of the country
, at time t,
is a human capital indicator,
is investment in fixed capital, and
are controls, including population growth, which may encourage greater investment (Becker, Glaeser, and Murphy Citation1999), composite stability, as a measure of socio-economic and political factors (Graff Citation2005), and a disturbance term,
. In this specification, the productivity parameter is captured by the extent of fintech diffusion (
) and the state of financial inclusion (
).
4. Estimation results
Our empirical strategy is based on three steps. In the first step, we follow the existing literature that uses cross-country regression for Equations (3)–(5). This enables us to have the widest country coverage and make use of available measures of financial inclusion that are not available for the whole time period 1991–2015 (for example, data for holding an account at a formal financial institution and using a mobile money service cover only 3 years, 2011, 2014, 2017). In the second step, we estimate our three-equation model using 3-stage least squares to pick up simultaneities between fintech diffusion, financial inclusion and GDP per capita. For the analysis in steps one and two, we capture time effects by taking the average of existing variables from 2013 to the latest available observation. Therefore, in Table , the number of observations equals the number of countries. At step three, we complement the cross section analysis by estimating an error correction model using panel data regression – this enables us to isolate short run and long-run effects of fintech diffusion and financial inclusion.
To explore the effects of fintech diffusion we sought to construct a panel dataset for the widest coverage of countries and longest time period available. The financial inclusion indices are from Svirydzenka (Citation2016) and cover the period 1991–2015. Data were available for a total of 137 countries as listed in Appendix 2. The choice and the construction of the main variables builds on those used in previous studies on financial innovation (see, e.g. Laeven, Levine, and Michalopoulos Citation2015) and financial inclusion (e.g. Allen et al. Citation2016) and its impact on growth (e.g. Kim, Yu, and Hassan Citation2018). Table 1 lists the variables used, their abbreviated names, their definitions and the sources of data.
Table 1. Description of the variables and data sources.
4.1. Descriptive statistics
The descriptive statistics for all variables used in this study are shown in Table 2. On average, 59% of the population has an account at a formal financial institution. This proportion varies from 7% in Niger and Burundi to almost 100% in Australia, Canada, Denmark, Finland, Netherlands, Norway, New Zealand and Sweden. Over the last five years, the average penetration rate of mobile phone was 109% and varies from 28.72% (Cuba) to 197% (United Arab Emirates). The ATM penetration rate is very low compared to that of the mobile phone. It varies from 0.14 per 100,000 inhabitants in Ethiopia to 188 per 100,000 inhabitants in Korea.
Table 2. Descriptive statistics.
Table 3 reports the correlation matrix. Per capita income is highly and positively correlated with stability indicators (composite or global and political stability), human capital variables (human capital index, primary and secondary school) and financial inclusion – proxied by having an account (correlation greater than 0.7).
Table 3. Correlation matrix.
Financial inclusion – measured by ‘having an account’ and the financial development index and its sub-indices – is also positively correlated with human capital variables and stability indices.
Fintech diffusion (ATM and digital networks, and mobile phones and payments) is positively correlated with the proportion of the population leaving the urban area, GDP per capita, stability indices and human capital variables. There is also a positive correlation between financial inclusion and fintech diffusion. These preliminary results indicate that fintech diffusion, financial inclusion, and economic performance are inter-related. We take these inter-relations into account by estimating our three equations as a system in step two of our empirical analysis. The correlation matrix shows that some variables are highly correlated (correlation greater than 0.7). These variables are therefore not included in the regressions at the same time to limit multicollinearity issues.
4.2. Diffusion of technological innovation across countries: cross section analysis
We first focus on mobile phone and ATM technologies and estimate Equation (3). The main results of the estimates are reported in Table 4. The dependent variables are the number of ATMs per capita and mobile phone subscriptions per capita.
Table 4. Determinants of the diffusion of mobile phone and ATMs.
First, we find that a high level of income per capita is associated with a high level of mobile phone adoption. This is consistent with the literature which finds that the likelihood of having a mobile phone is positively associated with economic development (Buys et al. Citation2009). Second, the higher the proportion of the population that is financially included, the higher the diffusion of mobile phones. Third, composite stability (comprising political, economic and financial stability) tends to enhance the diffusion of innovation. Fourth, a low level of urbanisation decreases the diffusion of innovation.
Focusing on the diffusion of ATMs, the results indicate that GDP per capita and financial inclusion (measured by having an account at a formal institution) are determinants of the diffusion of ATMs. As in the case of mobile phones, the level of urbanisation is also an important determinant of ATM diffusion, as are human capital variables. The number of bank branches does not seem to affect the number of ATMs. This may be due to the sample period (2013–2017). In most countries, the number of ATMs is not necessarily correlated with the number of bank branches since ATMs can be found in train and gas stations, airports, supermarkets, etc.
Fifth, the results indicate that trade is a vehicle for technology diffusion. Our result is consistent with the existing literature which shows that the diffusion of new technologies across countries may take place through international trade in intermediate goods (Eaton and Kortum Citation1999, Citation2002; Rivera-Batiz and Romer Citation1991).
Finally, we analyse the effect of human capital on fintech diffusion. We find that human capital variables (the human capital index, primary and secondary school) are positively and significantly related to the diffusion of technology. This last result indicates that learning and absorptive capacity, captured by human capital, are drivers of technological diffusion. The development of human capital – through education – facilitates the adoption of new technology.
4.3. Financial inclusion and the diffusion of technological innovation
We estimate Equation (4) to understand the determinants of financial inclusion. The results of the estimates are reported in Table 5. Firstly, as expected, GDP per capita and government spending are positively associated with the access to an account at a formal financial institution as demand for financial services from previously unbanked customers increases as incomes rise, and government transfers and expenditure on services, such as, education further stimulate awareness of, and new demand for, financial services.
Table 5. Determinants of having an account at a financial institution.
Secondly, the size of the shadow economy impairs financial inclusion. By definition, ‘the shadow economy includes all economic activities which are hidden from official authorities for monetary (avoid taxes payment), regulatory (avoid governmental bureaucracy or the burden of regulatory framework), and institutional reasons' (Medina and Schneider Citation2018). High levels of shadow economy activity involve financial transactions outside the formal financial system. Thirdly, on average, the technology diffusion (mobile phone and ATM) boosts financial inclusion, i.e. increases the proportion of the population financially included in the formal system. Fourthly, we find that financial inclusion is positively associated with political and composite stability and good governance (absence of corruption). The political and global environment (stability and governance) spur financial inclusion as in Allen et al. (Citation2014). Fifthly, human capital is also a determinant of financial inclusion. Increases in the human capital index or primary, lower and upper secondary educational attainment increase the level of financial inclusion in the economy probability through financial literacy (Grohmann, Klühs, and Menkhoff Citation2018).
4.4. The impact of fintech diffusion and financial inclusion on income per capita
In order to assess the effects of fintech diffusion on living standards, we estimate Equation (5). The dependent variable is the log of per capita income. Column (1) of Table 6 reports the estimates of Equation (3) by considering only three inputs (human capital, physical capital and labour) in a production function. In column (2), we add the financial inclusion variable. Financial inclusion positively contributes to income per capita. In columns (3) and (4), we add two fintech diffusion variables and show that the diffusion of technology increases living standards.
Table 6. The determinants of income per capita.
This analysis shows that, in addition to traditional factors entering the production function (human capital and physical capital), financial inclusion, technology diffusion and stability are key factors that can increase per capita income. At the same time, GDP per capita is positively associated with financial inclusion and the diffusion of innovation. The results remain significant after controlling for other factors.
To gauge the robustness of our findings we extend the analysis by 3-stage least squares to capture simultaneous effects between our three variables – fintech diffusion, financial inclusion and GDP per capita and panel data regressions to distinguish short run and long run effects.
4.5. Systems estimation of fintech diffusion, financial inclusion and GDP per capita
Previously, we found that fintech diffusion can be partly explained by financial inclusion. In addition, fintech diffusion explains financial inclusion and GDP per capita. Moreover, greater financial inclusion also leads to a high level of per capita income. Therefore, all three variables are jointly determined and the estimates attained may be biased. To address this issue of reverse causality, we use three-stage least squares (3SLS) to estimate a series of systems of three equations.Footnote7
Table 7 reports the results of the estimates. We estimate two different systems of equations. In the first system (Equations (1)–(3)) of Table , the variables: mobile phone penetration rate, ATM penetration rate, having an account, GDP per capita and the composite stability index are considered as endogenous.
Table 7. Results of the 3SLS estimations of the system of Equations (1)–(3).
Before interpreting the results, we discuss the identification of the systems of equations and provide the appropriate diagnostic statistics for this purpose. First, the systems are overidentified. There are five endogenous variables (mobile phone penetration rate, ATM penetration rate, having an account, GDP per capita and the composite stability index) in the first system and six endogenous variables (mobile phone penetration rate, ATM penetration rate, having an account, GDP per capita, human capital index, and stock of capital) in the second system. In terms of exogenous variables, there are eight exogenous variables in the first system and six in the second system. In addition, we use the political stability index as an instrument in the ATM equation (the correlation between the ATM penetration rate and the political stability index is 0.61). Moreover, the absolute latitude of each country is used as instrument in the second system of equations. Therefore, the number of exogenous variables (including instruments) is greater than the number of endogenous variables in each system. Second, the Hansen J statistic is calculated to determine the validity of the overidentifying restrictions because the system is overidentified.Footnote8 The null hypothesis is that the overidentification restriction is valid. The p-value associated with Hansen’s J statistic should be greater than 0.10 in all cases for the null hypothesis to be accepted and the system to be overidentified. The last row of the Table reports the Hansen’s J statistic and the associated p-value. There is no evidence against the null of overidentifying restriction hypothesis at 10% level. Finally, we provide evidence for limited risk of weak instruments in the two systems by using the F-statistics calculated after the first stage of the estimation. All F-statistics are greater than 10 (see footnote 8), except the first stage estimation of the mobile phone penetration rate for which this statistic is 9.15. These results indicate that the system is identified and the following paragraphs discuss the main findings.
Fintech diffusion and financial inclusion are two significant determinants of income per capita consistent with our previous findings. Columns (1)–(3) show that the diffusion of innovation enhances financial inclusion and, ultimately GDP per capita through financial inclusion. The second system of equations (columns (4)–(6)) shows the feedback effects from financial inclusion to fintech diffusion (including network externalities) and economic prosperity.
Overall, these new findings do not invalidate our previous results. This indicates limited endogeneity bias in our previous findings.
4.5.1. Panel estimation for up to 137 countries from 1991–2015
In the previous sections, we use cross-section analysis. Therefore, it was not possible to account for country-specific effects nor time dynamics. The main reason why we use cross-section analysis is that the measure of financial inclusion is available only in 2011, 2014 and 2017. To overcome this limitation, we use the financial development database by Svirydzenka (Citation2016). This dataset runs from 1980 to 2015 and covers 137 countries.Footnote9 We restrict our analysis to the period 1991–2015 because data on the shadow economy are not available for later years. We use four indicators to proxy financial inclusion from the financial development database: the financial development index (FD), financial institutions depth (FID), financial institutions access (FIA) and financial institutions efficiency (FIE). Table reports descriptive statistics and Table provides the matrix of Pearson’s correlation coefficients. Stationarity tests were carried out and Table reports panel unit root tests. We find that the dependent variables (except for FD and FIE) are integrated of order one, as are some explanatory variables. This opens up the possibility for cointegration analysis. We perform the Kao (Citation1999), Pedroni (Citation1999, Citation2004), and Westerlund (Citation2005) tests of cointegration on our panel dataset and the presence of cointegration is not rejected.Footnote10 We therefore estimate a dynamic panel model using a dynamic fixed effects technique. The general form of the error-correction equation estimated is,Footnote11
(6)
(6) where
denotes the first difference operator,
is the dependent variable (diffusion of innovation or financial inclusion or GDP per capita),
is a set of control variables,
is the error-correcting speed of adjustment term,
are country-fixed effects and
is an error term. If
, there is no evidence of a long-run relationship. If this parameter, which should lie between 0 and −1 for stability, is significant, then the results provide confirmation of a stable long-run relationship.
In what follows, we report the error correction term () and the long-run parameters (
) for our different models that are estimated using dynamic fixed effects.
4.6. Fintech diffusion
Equation (3) is estimated using the extent of ATM and mobile phone diffusion as dependent variables. The results of the estimates are reported in Tables and . The error correction terms are negative and significant at the 1% level in almost all the estimates, except three (columns 5, 6 and 7 of Table ). This provides evidence of long-run relationships between fintech diffusion, financial inclusion and GDP per capita and the control variables used in the regressions.
Table 8. Determinants of mobile phone diffusion (long-run relationships).
Table 9. Determinants of ATM diffusion (long-run relationships).
More specifically, we find that GDP per capita, urbanisation, trade and financial inclusion – measured by financial development index – are robust determinants of the diffusion of mobile phone technology (Table ). Financial institutional efficiency and, to a lesser extent, financial institutional depth are two critical aspects of financial inclusion that affect the adoption of mobile phone technology. Other important determinants are human capital (measured by human capital index), political and composite stability and FDI inflow in the ICT sector.
Analysis of ATM diffusion shows that financial institution depth is a determinant of ATMs diffusion (at the 10% level). GDP per capita and measures of stability are also determinants of the diffusion of ATMs (Table ). The results are consistent with our previous findings based on cross-sectional analysis. In addition, they provide evidence of the long-run effects of fintech diffusion and financial inclusion on GDP per capita.
To test for possibility of different slopes for developed and developing countries, countries are classified into low (low to lower-middle) and high (upper-middle and high) income groups. We run the regressions for these two groups and compare the error correction terms by using the following statistics (see Equation (4) in Paternoster et al. (Citation1998)):
We findFootnote12 that the error correction terms are significantly different at the 5% level between the two groups for the diffusion of mobile phone but not after controlling for composite stability and changing the measure of financial inclusion. Regarding the diffusion of ATMs, generally, we find no significant difference between the speed of adjustment to long-run equilibrium between the two groups.
We further explore the possibility that fintech diffusion is a function of positive externalities by testing a non-linear relationship between financial inclusion and technology diffusion. Firstly, we regress the diffusion of mobile phones and ATMs on the natural log of the financial development index and find a positive relationship. Secondly, we use the square of financial inclusion and find a U-shaped relationship only for the diffusion of mobile phone and financial inclusion. This second result indicates that financial inclusion drives the diffusion of mobile phones up to a certain threshold above which its contribution declines slightly.
Finally, we consider the possibility that the degree of industrialisation and the level of competition in the banking sector might affect fintech diffusion. Therefore, in addition to the urbanisation variable, we control for the share of the industrial sector in GDP (as a proxy of the level of industrial development) and the concentration of the banking sector measured by the share of the three largest banks (a proxy of competition). We find that these variables are not significantly related to the diffusion of ATMs.
4.7. Financial inclusion
To analyse the determinants of financial inclusion, we estimate Equation (4) using financial institutional depth and access to financial institutions as dependent variables. The results are reported in Table 10. Mobile phone diffusion, the size of the shadow economy and government spending are critical determinants of financial institutional depth. Human capital – measured by a human capital index – and composite stability are also important for the deepening of the financial institutions, and thus inclusion. It is worth noting that the depth of financial institutions is higher in countries where the level of the informal economy is low (a lower value of the shadow economy rate). These findings are consistent with our cross section results, but again they provide additional evidence of the long run relationships between financial inclusion, GDP per capital and fintech diffusion.
Table 10. Determinants of financial institutional depth and access.
The analysis of the access dimension of financial inclusion shows that GDP per capita and the size of the informal sector are two main determinants of financial inclusion. Again, a high level of informal economy is associated with a low level of access to financial institutions – measured by the number of bank branches and ATMs. Conversely, higher GDP per capita stimulates access to financial institutions.
Although we find that the diffusion of mobile phones is related to financial inclusion, one important question is the effectiveness of ICT diffusion, that is the number of years of ICT adoption a country needs before there are sustained effects on financial inclusion. To answer this question, we plot the diffusion curve of mobile phones, that is the average mobile phone penetration rate per year (see Figure ). We also plot the relationship between financial inclusion and the mobile phone penetration rate to obtain the average mobile phone penetration rate at the consolidation point (Figure ). Based on this information, we estimate the effectiveness of the diffusion of mobile phones to be 7 years for low income countries, 8 years for lower-middle income countries, 10 years for high income countries and 12 years for upper-middle income countries using references dates (Table 11). This is consistent with the well-known finding that lower income countries can benefit more quickly from technology diffusion and catch-up.
Table 11. Effectiveness of mobile phone penetration rate.
4.8. GDP per capita
Finally, we estimate Equation (5) using per capita income. Table 12 reports the estimates. Fintech diffusion (mobile phones and ATMs) is positively associated with per capita income, indicating the long-run impact of diffusion on income per capita. Regarding financial inclusion, the results show that financial institutions access and efficiency play an important role, while there is no effect (at conventional significant levels) of the depth dimension on GDP per capita. Composite stability and human capital, however, do also determine income per capita in the long run.
Table 12. Determinants of GDP/N (long-run relationships).
5. Conclusion
The widespread diffusion of ATMs and the associated development of global inter-bank digital networks and markets (Batiz-Lazo Citation2018) has transformed financial services over the past 25 years or so. Similarly, mobile phone technology linked with mobile payments systems and digital financial networks is transforming the way banking services are provided across the globe. Despite this transformation, relatively little research has been conducted on the impact of the widespread diffusion of fintech.
Theoretically, the diffusion of new technology in the financial services sector has the potential to enhance financial inclusion and raise living standards in the wider economy. This paper has focused on two possible transmission mechanisms (the fintech diffusion channel and the financial inclusion channel) the interactions between them, and their impact on income per capita. The existence of positive network externalities means that financial inclusion increases the utility of networked financial services, such as, ATMs and mobile money and payments.
Our empirical analysis is based on cross section estimations for up to 137 countries (using the average value of each variable for 2013–2017) and panel data analysis using an error correction model for the period 1991–2015. The cross section estimations show that the extent of fintech diffusion increases with financial inclusion, human capital and GDP per capita. This last result suggests that financial sector development is partly driven by activity in the real economy. We also find that the extent of fintech diffusion (ATMs and mobile phones and payments systems) increases financial inclusion. In addition, our cross section results show that GDP per capita is increased by investment in fixed and human capital, the diffusion of ATMs and mobile phones, as well as socio-economic variables, such as absence of corruption and composite stability (political, economic and financial risk). In light of evidence of endogeneity, we estimate our 3 equations as a system using three stage least squares. The main results are preserved in nature, with limited endogeneity bias.
Due to the fact that the technology diffusion is a long-run process, and because many of the variables in our panel data set are non-stationary, the panel estimations are conducted using an error correction model with country fixed effects. These results provide evidence of long-run relationships between fintech, financial inclusion and income per capita.
The main findings in this paper open up new avenues for policy and future research. Most governments target living standards as a policy variable. More recently, financial inclusion has also been adopted as a target by policy makers. Our results suggest that fintech diffusion has positive effects on both GDP per capita and financial inclusion, and that financial inclusion also drives fintech diffusion and raises GDP per capita. The positive impact of fintech diffusion and its relationship with financial inclusion suggests that governments should look at a wider set of policy variables to increase the performance of the financial sector. In addition to standard policies to reduce corruption, promote political stability, contain economic and financial risks and control shadow banking activities, government policies should also be designed to enhance the extent of fintech diffusion. Potential policy instruments include: standard setting (particularly in ICT, digital networks and security protocols that can enhance network externalities and inter-operability), infrastructure development (including fibre optic cable, telecommunications networks that give greater access to financial services and the development of mobile payments systems) and education and training in fintech adoption and use, as a means of leveraging financial inclusion and higher GDP per capita.
The present study has focused on two – albeit pervasive – fintech technologies. Both utilise ICT, digital networks, security protocols and inter-bank operability. There is clearly scope for future research to look at the diffusion of other financial technologies to ascertain their effects on key policy targets such as financial inclusion and GDP per capita.
Acknowledgements
We are grateful to the participants of the Financial Inclusion and Fintech Conference at the School of Finance and Management, SOAS University of London, on 25th-26 March 2019 and to Pasquale Scaramozzino, two anonymous referees and the editors, for valuable comments and suggestions, the usual disclaimer applies. We acknowledge financial support from the DFID-ESRC [ES/N013344/2] Research Grant on “Delivering Inclusive Financial Development and Growth” under the Growth Research Programme (DEGRP) Call 3, the ESRC-NSFC [ES/P005241/1] Research Grant on “Developing financial systems to support sustainable growth in China - The role of innovation, diversity and financial regulation”, the AXA Research Fund; Department for International Development; Economic and Social Research Council.
Disclosure statement
No potential conflict of interest was reported by the author(s).
Additional information
Funding
Notes on contributors
Désiré Kanga
Dr Désiré Kanga, Research Fellow, School of Finance and Management, SOAS University of London and Economist at the IMF.
Christine Oughton
Professor Christine Oughton, Professor of Management Economics, School of Finance and Management, SOAS University of London and Fellow of the Academy of Social Sciences.
Laurence Harris
Professor Laurence Harris, Emeritus Professor, School of Finance and Management, SOAS University of London and member of the African Economic Research Consortium.
Victor Murinde
Professor Victor Murinde, AXA Chair in Global Finance and Director of the Centre for Global Finance, School of Finance and Management, SOAS University of London.
Notes
1 See Batiz-Lazo (Citation2009, Citation2018), Konheim (Citation2016), Hall and Kahn (Citation2003), and Scott, Van Reenen, and Zachariadis (Citation2017) for analysis of the introduction and diffusion of ATMs and digital networks; Frame and White Citation2012 for an overview of financial innovations and their diffusion; and Lashitew, van Tulder, and Liasses (Citation2019) on the diffusion of mobile phones, money and payments technology.
2 The Financial Stability Board (Citation2019, 1) defines fintech as, ‘technology-enabled innovation in financial services that could result in new business models, applications, processes or products with an associated material effect on the provision of financial services.’ Leong and Sung (Citation2018, 75) use a similar definition and identify three stages of fintech development – Fintech Mark 1.0 involved the development of enabling technologies that ‘breed related products of financial technology’ reflecting the ‘platform technology’ nature of ATMs, digital networks and security protocols.
3 Madsen and Ang’s study provides valuable analysis of the impact of research and development (R&D) on ideas production or invention for 20 OECD countries. However, the measures they use for the knowledge stock and R&D do not fully capture for R&D in financial services as until recently the collection of data via Business R&D surveys did not cover the financial intermediation sector and the proportion of financial innovations that is patented is low (Dal Borgo et al. Citation2013).
4 The distinction between invention (or ‘ideas’ production) and diffusion is captured by the ‘paradox of patents’ (Robinson Citation1956), i.e. that patents are designed to spur invention by slowing down the rate of diffusion (Rosenberg Citation1972; MacLeod Citation1991). Invention and innovation are also distinct; inventions only become innovations when diffusion begins, i.e. an invention becomes an innovation when it starts to be utilised in the economy by firms, consumers or government (OECD, Oslo Manual, Citation2005).
5 Another indicator used in the literature is the percentage of respondents who report personally using a mobile money service in the 12 months preceding the survey (see, Allen et al. Citation2016). We did not use this indicator due to the limited coverage of this indicator in our dataset.
6 It may be argued that survey respondents are educated people who, on average, have higher income. Thus, using the percentage of respondents who report having an account at a bank or another type of financial institution as indicator of financial inclusion might be biased. However, the Global Findex database is drawn from nationally representative samples using random selection techniques. The target population is the entire civilian, non-institutionalised population age 15 and above without targeting the level of education. Respondents are randomly selected within eligible households by following the Kish grid (eligible households are selected using random technique as well).At present, this is the best source to assess the proportion of the population with a bank account because it is based on the demand side and not collected from suppliers. In developing countries, financial inclusion measured on the supply side is biased due to duplication of the number of bank accounts (the same person has multiple bank accounts in different financial institutions).
7 For a system to be identified, the number of exogenous variables in all the equations, including the instruments (any additional variables), minus the number of exogenous variables in each equation of the system must be greater than or equal to the number of endogenous variables. In other words, there must be at least as many noncollinear exogenous variables in the remaining system as there are endogenous right-hand-side variables in an equation. When the number of exogenous variables is greater than the number of endogenous variables, the system is overidentified and we use the Hansen’s J statistic to determine the validity of the overidentifying restrictions. Tests of overidentifying restrictions test whether: (i) the instruments are uncorrelated with the error term; and (ii) the equation is mis-specified and one or more of the excluded exogenous variables should in fact be included in the structural equation. The p-value associated with the Hansen’s J statistic should be greater than 0.10 in all cases. In addition, the F-statistics calculated after the first stage of the estimation – and usually used to check whether the estimated models are globally significant – is used to test the existence of weak instruments. These F-statistics are expected to be greater than 10 (see Staiger and Stock Citation1997).
8 This is preferred to the Sargan test which is not robust to heteroskedasticity.
9 The maximum number of observations is 3,425, i.e. 137 countries over 25 years from 1991 to 2015, but there are missing observations for some countries and years.
10 The results are available upon request from the authors.
11 This equation does not account for country heterogeneity in parameters. Country effects are captured only through the fixed effects. This assumption can be strong, however, the results of the estimates do not invalidate our previous findings based on cross-sectional analysis.
12 The results are available upon request from the authors.
References
- Aghion, P., and P. W. Howitt. 1998. Endogenous Growth Theory. Massachusetts: MIT Press.
- Allen, F., E. Carletti, R. Cull, J. Q. Qian, L. Senbet, and P. Valenzuela. 2014. “The African Financial Development and Financial Inclusion Gaps.” Journal of African Economies 23 (5): 614–642. doi:https://doi.org/10.1093/jae/eju015.
- Allen, F., A. Demirguc-Kunt, L. Klapper, and M. S. Martinez-Peria. 2016. “The Foundations of Financial Inclusion: Understanding Ownership and use of Formal Accounts.” Journal of Financial Intermediation 27: 1–30. doi:https://doi.org/10.1016/j.jfi.2015.12.003.
- Baldwin, R. 2016. The Great Convergence: Information Technology and the new Globalisation. Cambridge, MA: Harvard University Press.
- Barro, R. J., and X. Sala-i-Martin. 1997. “Technological Diffusion, Convergence and Growth.” Journal of Economic Growth 2 (1): 1–26.
- Batiz-Lazo, B. 2009. “Emergence and Evolution of ATM Networks in the UK, 1967-2000.” Business History 51 (1): 1–27. doi:https://doi.org/10.1080/00076790802602164.
- Batiz-Lazo, B. 2018. Cash and Dash: How ATMs and Computers Changed Banking. Oxford: Oxford University Press.
- Beck, T., T. Chen, C. Lin, and F. M. Song. 2016. “Financial Innovation: The Bright and the Dark Sides.” Journal of Banking & Finance 72: 28–51. doi:https://doi.org/10.1016/j.jbankfin.2016.06.012.
- Beck, T., R. Levine, and N. Loayza. 2000. “Finance and the Sources of Growth.” Journal of Financial Economics 58 (1-2): 261–300. doi:https://doi.org/10.1016/S0304-405X(00)00072-6.
- Becker, G., E. Glaeser, and K. Murphy. 1999. “Population and Economic Growth.” The American Economic Review 89 (2): 145–149.
- Benhabib, J., and M. M. Spiegel. 2000. “The Role of Financial Development in Growth and Investment.” Journal of Economic Growth 5 (4): 341–360. doi:https://doi.org/10.1023/A:1026599402490.
- Buys, P., S. Dasgupta, T. S. Thomas, and D. Wheeler. 2009. “Determinants of a Digital Divide in Sub-Saharan Africa: A Spatial Econometric Analysis of Cell Phone Coverage.” World Development 37 (9): 1494–1505. doi:https://doi.org/10.1016/j.worlddev.2009.01.011.
- Caselli, F. 2005. “Chapter 9, Accounting for Cross Country Differences in Economic Growth.” In Handbook of Economic Growth, Volume 1, Part A, edited by P. Aghion and S. N. Durlauf, 679–742. Amsterdam: Elsevier. doi:https://doi.org/10.1016/S1574-0684(05)01009-9.
- Choi, I. 2001. “Unit Root Tests for Panel Data.” Journal of International Money and Finance 20 (2): 249–272. doi:https://doi.org/10.1016/S0261-5606(00)00048-6s.
- Clausen, Bianca, Aart Kraay, and Zsolt Nyiri. 2011. “Corruption and Confidence in Public Institutions: Evidence from a Global Survey.” World Bank Economic Review 25 (2): 212–249.
- Comin, D., and B. Hobijn. 2010. “An Exploration of Technology Diffusion.” American Economic Review 100 (5): 2031–2059. doi:https://doi.org/10.1257/aer.100.5.2031.
- Comin, D., and R. Nanda. 2019. “Financial Development and Technology Diffusion.” IMF Economic Review 67 (2): 395–419. doi:https://doi.org/10.1057/s41308-019-00078-0.
- Dal Borgo, M., P. Goodridge, J. Haskell, and A. Pesole. 2013. “Productivity Growth in UK Industries: An Intangible Investment Approach.” Oxford Bulletin of Economics and Statistics 75 (6): 806–834.
- Dupas, P., and J. Robinson. 2013. “Savings Constraints and Microenterprise Development: Evidence from a Field Experiment in Kenya.” American Economic Journal: Applied Economics 5 (1): 163–192. doi:https://doi.org/10.1257/app.5.1.163.
- Eaton, J., and S. Kortum. 1996. “Trade in Ideas Patenting and Productivity in the OECD.” Journal of International Economics 40 (3-4): 251–278. doi:https://doi.org/10.1016/0022-1996(95)01407-1.
- Eaton, J., and S. Kortum. 1999. “International Technology Diffusion: Theory and Measurement.” International Economic Review 40 (3): 537–570. https://www.jstor.org/stable/2648766.
- Eaton, J., and S. Kortum. 2002. “Technology, Geography, and Trade.” Econometrica 70 (5): 1741–1779. https://www.jstor.org/stable/3082019.
- Feenstra, R. C., R. Inklaar, and M. P. Timmer. 2015. “The Next Generation of the Penn World Table.” American Economic Review 105 (10): 3150–382.
- Financial Stability Board. 2019. FinTech and Market Structure in Financial Services: Market developments and Potential Financial Stability Implications. Basel: Financial Stability Board.
- Frame, W. S., and L. White. 2012. “Technological Change, Financial Innovation, and Diffusion in Banking.” In The Oxford Handbook of Banking, edited by A. N. Berger, P. Molyneux, and J. O. S. Wilson. Oxford Handbooks. https://doi.org/https://doi.org/10.1093/oxfordhb/9780199640935.013.0019.
- Freeman, C. 1989. “New Technology and Catching up.” European Journal of Development Research 1 (1): 85–99. doi:https://doi.org/10.1080/09578818908426503.
- Graff, M. 2005. “Socio-Economic Factors and the Finance-Growth Nexus.” The European Journal of Finance 11 (3): 183–205. doi:https://doi.org/10.1080/13518470410001674332.
- Grohmann, A., T. Klühs, and L. Menkhoff. 2018. “Does Financial Literacy Improve Financial Inclusion? Cross Country Evidence.” World Development 111: 84–96. doi:https://doi.org/10.1016/j.worlddev.2018.06.020.
- Hall, R. E., and C. I. Jones. 1999. “Why do Some Countries Produce so Much More Output per Worker Than Others?” Quarterly Journal of Economics 114 (1): 83–116. http://www.jstor.org/stable/2586948.
- Hall, B., and B. Kahn. 2003. “Adoption of New Technology.” NBER Working Paper 9730, National Bureau of Economic Research, Cambridge Massachusetts. https://doi.org/https://doi.org/10.3386/w9730.
- Hsieh, C. T., and P. J. Klenow. 2010. “Development Accounting.” American Economic Journal: Macroeconomics 2 (1): 207–223. doi:https://doi.org/10.1257/mac.2.1.207.
- Im, K. S., M. H. Pesaran, and Y. Shin. 2003. “Testing for Unit Roots in Heterogeneous Panels.” Journal of Econometrics 115 (1): 53–74. doi:https://doi.org/10.1016/S0304-4076(03)00092-7.
- Jagtiani, J., and C. Lemieux. 2018. “Do Fintech Lenders Penetrate Areas That are Underserved by Traditional Banks.” Journal of Economics and Business 100 (November-December): 43–54. doi.org/https://doi.org/10.1016/j.jeconbus.2018.03.001.
- Kao, C. 1999. “Spurious Regression and Residual-Based Tests for Cointegration in Panel Data.” Journal of Econometrics 90 (1): 1–44. doi:https://doi.org/10.1016/S0304-4076(98)00023-2.
- Kim, D. W., J. S. Yu, and M. K. Hassan. 2018. “Financial Inclusion and Economic Growth in OIC Countries.” Research in International Business and Finance 43: 1–14. doi:https://doi.org/10.1016/j.ribaf.2017.07.178.
- King, R. G., and R. Levine. 1993. “Finance and Growth: Schumpeter Might be Right.” Quarterly Journal of Economics 108 (3): 717–737. doi:https://doi.org/10.2307/2118406.
- Konheim, A. G. 2016. “Automated Teller Machines: Their History and Authentication Protocols.” Journal of Cryptographic Engineering 6 (1): 1–29. doi:https://doi.org/10.1007/s13389-015-0104-3.
- Laeven, L., R. Levine, and S. Michalopoulos. 2015. “Financial Innovation and Endogenous Growth.” Journal of Financial Intermediation 24 (1): 1–24. doi:https://doi.org/10.1016/j.jfi.2014.04.001.
- La Porta, R., F. Lopez-de-Silanes, A. Shleifer, and R. W. Vishny. 1998. “Law and Finance.” Journal of Political Economy 106 (6): 1113–1155. doi:https://doi.org/10.1086/250042.
- Lashitew, A. A., R. van Tulder, and Y. Liasses. 2019. “Mobile Phones for Financial Inclusion: What Explains the Diffusion of Mobile Money Innovations?” Research Policy 48 (5): 1201–1215. doi:https://doi.org/10.1016/j.respol.2018.12.010.
- Leong, K., and A. Sung. 2018. “FinTech (Financial Technology); What is it and how to use Technologies to Create Business Value in Fintech way?” International Journal of Innovation, Management and Technology 9 (2): 74–78.
- MacLeod, C. 1991. “The Paradoxes of Patenting: Invention and its Diffusion in 18th- and 19th-Century Britain, France, and North America.” Technology and Culture 32 (4): 885–910.
- Maddala, G. S., and S. Wu. 1999. “A Comparative Study of Unit Root Tests with Panel Data and a New Simple Test.” Oxford Bulletin of Economics and Statistics 61 (S1): 631–652. doi:https://doi.org/10.1111/1468-0084.0610s1631.
- Madsen, J., and J. Ang. 2016. “Finance-led Growth in the OECD Since the Nineteenth Century: how Does Financial Development Transmit to Growth?” Review of Economics and Statistics 98 (3): 552–572. doi:https://doi.org/10.1162/REST_a_00513.
- Medina, L., and F. Schneider. 2018. “Shadow Economies Around the World: What Did We Learn Over the Last 20 Years?” IMF Working Paper WP/18/17. International Monetary Fund. https://www.imf.org/en/Publications/WP/Issues/2018/01/25/Shadow-Economies-Around-the-World-What-Did-We-Learn-Over-the-Last-20-Years-45583.
- OECD/Eurostat. 2005. Oslo Manual: Guidelines for Collecting and Interpreting Innovation Data. 3rd ed. The Measurement of Scientific and Technological Activities. OECD Publishing, Paris.
- Paternoster, R., R. Brame, P. Mazerolle, and A. Piquero. 1998. “Using the Correct Statistical Test for the Equality of Regression Coefficients.” Criminology; An interdisciplinary Journal 36 (4): 859–866. doi:https://doi.org/https://doi.org/10.1111/j.1745-9125.1998.tb01268.x.
- Pedroni, P. 1999. “Critical Values for Cointegration Tests in Heterogeneous Panels with Multiple Regressors.” Oxford Bulletin of Economics and Statistics 61 (S1): 653–670. doi:https://doi.org/https://doi.org/10.1111/1468-0084.0610s1653.
- Pedroni, P. 2004. “Panel Cointegration: Asymptotic and Finite Sample Properties of Pooled Time Series Tests with an Application to the PPP Hypothesis.” Econometric Theory 20 (3): 597–625. doi:https://doi.org/10.1017/S0266466604203073.
- Pesaran, M. H. 2007. “A Simple Panel Unit Root Test in the Presence of Cross-Section Dependence.” Journal of Applied Econometrics 22 (2): 265–312. doi:https://doi.org/10.1002/(ISSN)1099-1255.
- Porter, M. E., and S. Stern. 2000. Measuring the “Ideas” Production Function: Evidence from International Patent Output. NBER Working Paper 7891. Cambridge, MA: NBER.
- Rivera-Batiz, L. A., and P. M. Romer. 1991. “Economic Integration and Endogenous Growth.” Quarterly Journal of Economics 106 (2): 531–555. doi:https://doi.org/10.2307/2937946.
- Robinson, J. 1956. The Accumulation of Capital, Third Edition. Basingstoke: Palgrave Macmillan.
- Rosenberg, N. 1972. Technology and American Economic Growth. New York: Harper Row.
- Scott, S. V., J. V. Van Reenen, and M. Zachariadis. 2017. “The Long-Term Effect of Digital Innovation on Bank Performance: An Empirical Study of SWIFT Adoption in Financial Services.” Research Policy 46: 984–1004..
- Silber, W. L. 1983. “The Process of Financial Innovation.” American Economic Review 73 (2): 89–95. https://www.jstor.org/stable/1816820.
- Staiger, D., and J. H. Stock. 1997. “Instrumental Variables Regression with Weak Instruments.” Econometrica: Journal of the Econometric Society 65 (3): 557–586.
- Stoneman, P., and G. Battisti. 2010. “The Diffusion of New Technology.” Chap. 17 in Handbook of Innovation Volume II, edited by B. Hall, and N. Rosenberg. Amsterdam: Elsevier.
- Svirydzenka, K. 2016. Introducing a New Broad-Based Index of Financial Development. IMF Working Paper No. 16/5. International Monetary Fund. https://www.imf.org/en/Publications/WP/Issues/2016/12/31/Introducing-a-New-Broad-based-Index-of-Financial-Development-43621.
- Westerlund, J. 2005. “New Simple Tests for Panel Cointegration.” Econometric Reviews 24 (3): 297–316. doi:https://doi.org/10.1080/07474930500243019.
- World Bank. 2018. Global Financial Database. https://datacatalog.worldbank.org/dataset/global-financial-inclusion-global-findex-database.
- Zilberfarb, B.-Z. 1989. “The Effect of Automated Teller Machines on Demand Deposits: An Empirical Analysis.” Journal of Financial Services Research 2 (1): 49–57.
Appendix 1: Long definitions of some variables taken from PRS Group (2019) List of variables, downloadable from: https://epub.prsgroup.com/list-of-all-variable-definitions
Political risk rating
‘A means of assessing the political stability of a country on a comparable basis with other countries by assessing risk points for each of the component factors of government stability, socioeconomic conditions, investment profile, internal conflict, external conflict, corruption, military in politics, religious tensions, law and order, ethnic tensions, democratic accountability, and bureaucracy quality. Risk ratings range from a high of 100 (least risk) to a low of 0 (highest risk), though lowest de facto ratings generally range in the 30s and 40s.'
Corruption
‘A measure of corruption within the political system that is a threat to foreign investment by distorting the economic and financial environment, reducing the efficiency of government and business by enabling people to assume positions of power through patronage rather than ability, and introducing inherent instability into the political process. (Refer to ICRG Methodology for maximum points for this variable, as well as for related formulas for calculating risk.)'
Appendix 2: list of countries
This table is sorted by region, income level and country name. EAP stands for Europe & Central Asia, LAC stands for Latin America & Caribbean, MENA is Middle East & North Africa, NA stands for North America, SA is South Asia, SSA is Sub-Saharan Africa.
Table B1. List of the countries used in this paper.
Appendix 3: additional econometric evidence (panel data results)
The maximum number of observations is 3,425 – i.e. 137 countries over 25 years from 1991–2015 – there are missing observations for some countries and years.
Table C1. Summary statistics (panel data).
Table C2. Pearson correlation matrix.
Table C2. Continued.
Figure C1. (Average) mobile phone diffusion curve.
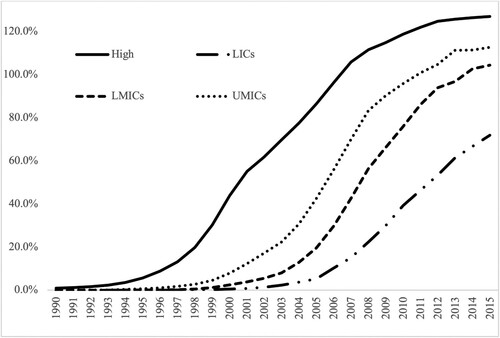
Figure C2. Relationship between financial inclusion and mobile phone diffusion.
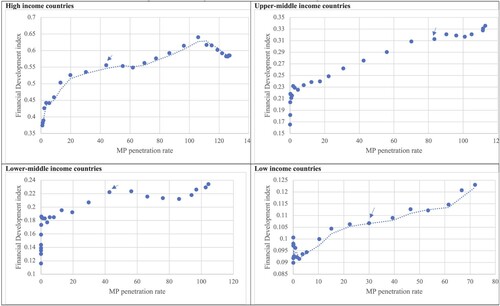
Table C3. Unit root tests.