
 ?Mathematical formulae have been encoded as MathML and are displayed in this HTML version using MathJax in order to improve their display. Uncheck the box to turn MathJax off. This feature requires Javascript. Click on a formula to zoom.
Abstract
Using an entirely new dataset of audited filings from firms that manage hedge funds, this study examines whether the hedge fund compensation contract aligns managerial incentives and investor interests. Our novel dataset allows us to distinguish between firms focused exclusively on hedge fund management and diversified firms offering products in addition to hedge funds. Our results for compensation data of hedge fund only management firms confirm that compensation increases as assets under management increase, despite increased costs and performance diseconomies of scale. Hedge funds managed by diversified firms have significantly lower performance. A relatively small proportion of the compensation from these firms is generated from hedge funds. The results are consistent with diversified hedge fund firms having weaker alignment between managerial incentives and investment performance.
‘Hedge funds vary widely in investment style and performance but fees are invariably high’. Financial Times, May 26, 2015
1. Introduction
The hedge fund compensation contract is designed to incentivise performance, with the manager receiving a performance-based fee, in addition to their annual management fee. The aim of this contract design is to mitigate the motivation for the manager to increase fund assets in order to maximise annual management fees at the cost of reduced performance (due to diseconomies of scale). Existing evidence suggests that the effectiveness of the managerial contract may be limited. To date, due to data limitations, the hedge fund managerial incentive literature uniformly assumes that fee income, estimated from self-reported returns to hedge fund data vendors, equates to manager compensation such that existing studies do not consider cases where not all compensation is generated from hedge funds.
This study directly tests the effectiveness of the managerial contract by using a novel database of actual audited filings by firms who manage hedge funds. Addressing these shortcomings in the literature is important for three reasons. First, the hedge fund databases are self-reported unaudited data, which exhibit several biases. Second, assuming that estimated fee income equates to compensation overlooks the fact that hedge funds are managed by firms which often have very significant costs that increase as assets under management (AUM) increase.Footnote1 Third, if managers generate a large proportion of their compensation from sources other than hedge funds, then the incentives to perform may be weaker.
Estimating fee income from hedge fund databases is problematic for several reasons. First, there is no time series of annual management fees and performance fees, so if the fund fee changes over time it is not captured in the database. Second, the AUM reported to the databases are not reported for all funds and are infrequently updated in many cases. Third, returns data often suffer from backfill bias and survivorship bias. Fourth, as the data is self-reported, there is no information provided on fee discounts offered to investors, which anecdotal evidence suggests are offered for large investment allocations.Footnote2 We are able to overcome all of these issues by using firm filings because the firms report their actual income as accounting turnover in the filing.
Using audited firm filings has a second major advantage in allowing us to control for operating costs. In our sample the firms which manage hedge funds exhibit large cross sectional and time series variability in costs, with, on average, compensation equating to only one third of fee income. Using employee numbers as a proxy for size, the median employees in firms exclusively managing hedge funds is eleven whereas the largest hedge fund only firm has over three hundred employees. By using actual audited compensation, we are able to test the compensation-size relationship, controlling for costs.
We are motivated to distinguish between firms who are entirely focused on hedge funds and diversified firms (with diverse compensation sources) by both the findings of Sun and Teo (Citation2019) and the extensive theoretical literature of corporate diversification. Sun and Teo (Citation2019) show that hedge funds managed by listed firms underperform funds managed by unlisted firms. These large asset management firms tend to raise more capital and launch new funds. Our new dataset of hedge fund compensation data allows us to directly test whether having diverse compensation sources weakens the alignment between hedge fund managers and investors. The corporate diversification literature shows that the units of firms which diversify across industries typically underperform relative to firms which focus on a particular industry, because the internal resource allocation decisions of these diversified firms ignore market indicators of the value of their investments (Lamont Citation1997).Footnote3 Our dataset on diversified and hedge fund only management firms allows us to test whether these theoretical models also apply in the fund management industry.
Our methodology is primarily motivated by the pioneering paper of Yin (Citation2016) who, recognising the shortcomings in the hedge fund management contract, developed and tested a model for the optimal size of a hedge fund. The results reveal significant conflicts of interest between hedge fund managers and their investors, with the manager being motivated to grow the fund beyond the optimal size for performance. Using our sample of hedge fund management firms and data from TASS we first test whether growth in fund assets affects performance. Consistent with the theoretical model of Berk and Green (Citation2004) and the evidence in Yin (Citation2016), we find strong evidence of diseconomies of scale, particularly for hedge fund only firms. That is, there is an optimal size for a hedge fund to maximise performance for the investor, beyond which performance declines. We also find strong evidence showing large differences in performance between hedge fund only firms and firms with diverse compensation streams.
Next, we test for the optimal hedge fund size to maximise compensation for the hedge fund manager. Using audited reported compensation paid to the employees, directors and owners of the firm we find that, consistent with Yin (Citation2016), despite the substantial costs associated with managing a larger fund and our evidence of diseconomies of scale, compensation increases as fund assets grow.
The key contribution of our paper is the specification of our new dataset of hedge fund firm filings to test the efficacy of the hedge fund management contract. For the first time we are able to identify actual compensation earned by the managers of these funds using audited data. Our study is closest to Brown et al. (Citation2008) who use data from the form ADV filing which provides information on ownership and key operational risk factors (but not detailed compensation information) to provide new insights on risk.Footnote4 Recent research has documented new information in 13F filings about hedge fund performance (see for example Aragon, Hertzel, and Shi (Citation2013)) but, again, no information is reported in these filings on hedge fund management firm compensation.
While not focused on hedge fund size, there is a large literature focused on direct and indirect managerial incentives of hedge fund managers. In general, research finds that large direct incentives and investor discretion are associated with better performance (Agarwal, Daniel, and Naik (Citation2009)), but others have focused on some of the indirect incentives, which are less geared towards performance. Goetzmann, Ingersoll Jr, and Ross (Citation2003) model performance fees as a claim on investor wealth to develop a framework for valuing a hedge fund management firm, which increases with AUM, while Lim, Sensoy, and Weisbach (Citation2016) show that high current returns lead to increased AUM, which leads to increased future annual management fees, particularly for younger funds. In related research Aragon and Nanda (Citation2011) focus on the extent of risk shifting behaviour of hedge fund managers, conditioned on the current NAV of the fund relative to the high water mark, to maximise incentive fees. Our findings on the under-performance of managers with diverse compensation streams is consistent with Nohel, Wang, and Zheng (Citation2010) who show that mutual fund managers who manage side-by-side hedge funds tend to have, at best, comparable performance to their hedge fund only peers.
The remainder of the paper is organised as follows. Section 2 describes our data. Section 3 reports results on the size-performance relationship, while Section 4 discusses results on the compensation-size relationship. Section 5 reports robustness checks and Section 6 presents our conclusions.
2. Data
2.1. Databases
We specify two databases for this study. We first use data collected from the Lipper TASS Database to identify hedge fund management firms located in the United Kingdom, and the performance and characteristics of the hedge funds managed by these firms. We then combine this with accounting data from the Bureau Van Dijk FAME database of United Kingdom private firm filings.
In the United States hedge fund management firms are either registered as limited liability corporations or limited liability partnerships. Firms registered in the US are generally not required to file financial accounting data, so to-date it has not been possible to conduct research on the filings of private hedge fund firms. In contrast, in the United Kingdom private limited liability firms are required to file their full accounts at Companies House such that there is a large corporate finance literature examining private UK firms. The Bureau Van Dijk FAME database contains the most recent ten years of digitized accounting information filed by all UK private firms as well as PDF copies of the actual filings made by the firms to Companies House since 2004.
In order to identify UK hedge fund management firms, we match management firms registered in the UK from the TASS database of live and dead hedge funds with the FAME database of UK firm filings. Using the contact details from the TASS database we identify the hedge fund management firm in the FAME database. Within TASS there is an initial sample of 483 UK private hedge fund management firms. We exclude firms which manage hedge funds which are dissolved prior to 2004, firms which are restructured via merger or acquisition or change their accounting policies. Following Yin (Citation2016), we also exclude firms which only manage funds with a dedicated short bias, options strategy and fund-of-funds styles because these funds typically have different incentive fees and are likely to have different inflow performance relations from typical individual hedge funds (Lim, Sensoy, and Weisbach Citation2016). In addition, firms with funds for which TASS does not contain information on returns, AUM or investment style are also deleted.
As is well documented in the literature, the voluntarily reported hedge fund performance in commercial databases suffers from backfill bias. To mitigate this problem, we follow Yin (Citation2016) and remove data preceding the date when funds first report to the TASS database (the add-date). For 29 funds in our sample the add-dates are not reported, so the first 18-months of observations are removed.Footnote5 Following Aggarwal and Jorion (Citation2010) we eliminate duplicate funds by calculating the return correlation between each pair of funds within the same management firm. If the returns are 0.99 correlated and more, we keep the oldest fund, or the fund with longest return record, or the larger of the two funds by AUM.Footnote6 Finally, because our paper focuses on the hedge fund management firms in the UK, for data reported to TASS in currencies other than the UK pound, we convert to UK pounds using end-of-month exchange rates from the IMF website.
As Bureau Van Dijk only keep the most recent ten years of accounting information in their database, having identified the firms in the FAME database, we are only able to download the most recent ten years of accounting data for each firm up to the 2017 accounting year, or their final year of filing. For firms which cease trading before 2017, we are able to download the most recent ten years of accounting information up to and including the final filing year. As this excludes pre 2008 accounting information for all firms still alive at the end of 2017 we also hand collect accounting information for the years 2004–2007 from PDFs of firm filings for these firms.
Finally, to mitigate the effect of micro funds, we set a minimum threshold for AUM of £10 million. To minimise the effect of outliers and reporting errors, we also restrict our sample to funds with at least one year of TASS data available during the sample period and winsorize fund returns at the 0.1% level.
These steps leave us with a final sample of 133 UK private management firms corresponding to 402 firm years, managing 358 hedge funds covering a twelve-year period from 2004 to 2015.
2.2. Measuring hedge fund manager compensation
We measure hedge fund manager compensation in two ways. First, following Yin (Citation2016), we estimate fees using self-reported data to the TASS database (where fees are estimated as a function of management fee), AUM, performance fee and current period performance. Where funds have no high-water mark, performance fees are estimated as a function of the period return and AUM. Where funds have a high-water mark, performance fees are estimated as a function of the period return, when the year-end NAV is in excess of the maximum historical NAV and AUM.
Our second measure is audited compensation from firm filings, where compensation is equal to Turnover less all non-compensation related expenses.
(1)
(1)
2.3. Hedge fund only firms and diversified firms
With our firm filing data, we are able to divide our firm sample into those which are concentrated only on hedge fund management and those with diversified compensation sources. This sub-sample analysis allows us to test the effectiveness of the managerial contract in aligning managerial and investor interests for these two firm types. If manager compensation is less aligned with investment performance for firms with diversified compensation sources, we anticipate that the funds managed by these firms would generate lower returns, and the link between fund size and total compensation will be weaker.
Given that it does not take into account discounts given to large investors, estimated fee income (TASS data) is the upper bound for income from managing TASS hedge funds such that we can compare it to accounting turnover (FAME data) each year to classify firms. Specifically, firms which have accounting turnover greater than estimated fee income are generating compensation from other sources outside of the TASS hedge funds, and are classified as Diversified firms. Likewise, firms with accounting turnover less than or equal to estimated fee income are classified as Hedge fund only firms.Footnote7 Within our sample, seventy percent of firm years are classified as Diversified firm years, with the remaining thirty percent classified as Hedge fund only firm years. Examining the Standard Industry Classification (SIC) codes of Diversified firms there is strong commonality in these firms, with over 80% having a predominant activity classified as either fund management, financial intermediation or security dealing.
2.4. Summary of data
Table reports sample summary statistics. Panel A provides a description of fund characteristics for all hedge funds reporting to TASS. Within our sample, hedge funds generate mean monthly returns of 1.40%. These funds manage on average £196 million of assets across the funds, with the largest managing £5.6 billion. Hedge funds charge a management fee of between 1% and 2%, and an incentive fee of 20%. High-water marks are widely used in hedge funds within our sample, with three quarters of funds having this provision. Panel B reports fund firm information, including the number of investment styles used by the firm and the number of hedge funds, managed by the same firm. On average the management firms in our sample manage two hedge funds within their firm and typically implement the same investment strategy for their hedge funds. Panel C provides a description of firm characteristics for all firms that manage at least one hedge fund reported to the TASS database. Looking at the audited accounting data from FAME, the firms employ an average of 73 staff and report total income of £74.9 million per annum, of which £23.3 million (31%) is paid out to staff and firm owners as compensation.
Table 1. Summary statistics.
3. Performance size relationship
The theoretical and empirical evidence for mutual funds shows that when managers have too much capital they must invest more than is optimal, or find investment opportunities outside of their area of expertise in order to deploy the increased capital. Even when the manager has some skill, Berk and Green (Citation2004) show that having too much capital has a consequent negative effect on fund performance, known as diseconomies of scale. More recently, Yin (Citation2016) presents evidence of diseconomies of scale to hedge funds.
We first aggregate monthly returns into quarterly returns for each fund. Following Yin (Citation2016), we use style-adjusted returns which are defined as the difference between individual fund quarterly returns and the average return of all funds in the same investment style. As our unit of observation is hedge fund firms, rather than hedge funds, where a firm manages more than one fund, we use the average return across all of the funds managed by that firm to measure performance in that quarter. In this study, we use both equal-weighted average returns and asset-weighted average returns for measures of performance.
3.1. Performance comparison: hedge fund only and diversified firms
We first divide hedge fund management firms into size quintiles each quarter and compare the average performance of equal weighted and asset weighted size quintiles.Footnote8 If we compare performance of the size quintiles, we see that the smallest hedge fund management firms generate the highest returns ().
Table 2. Performance comparison of different firms’ funds.
Our accounting data allows us to sub-classify our sample into two distinct types of hedge fund management firms: (1) hedge fund only firms, which generate all of their compensation from hedge funds, and (2) diversified firms, which generate their compensation from other sources in addition to hedge funds. This provides a unique opportunity to test whether the performance incentives are weaker when managers have more diverse compensation streams.
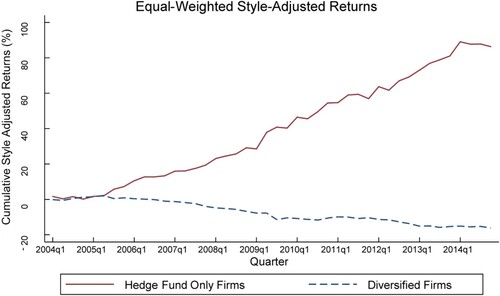
Figure plots the cumulative style adjusted returns of hedge funds managed by hedge fund only firms versus hedge funds managed by diversified firms. The difference in performance is striking. Funds managed by hedge fund only firms generate average cumulative style adjusted returns of 80% (outperforming their peer group hedge funds), whereas the funds managed by diversified firms underperform other funds in their style classification by 15% over the sample period.
Figure 1. Hedge fund only firm versus Diversified firm fund performance.
Notes: Cumulative style adjusted returns of hedge funds managed by hedge fund only firms versus hedge funds managed by diversified firms. Equal-weighted portfolios of hedge funds are constructed by sorting funds based on whether they are managed by a hedge fund only firms.
The outperformance of the smallest hedge fund management firms is particularly prevalent for firms that manage hedge funds only. Performance is markedly lower for firms that also generate compensation from sources other than hedge funds, highlighting the weaker performance incentives for this category of manager. Looking at the difference in performance between the two categories of firms, it is apparent that the outperformance is concentrated in the smaller quintiles. The outperformance is smaller when diseconomies of scale kick in for the largest hedge fund only firms.
The last two rows of Table show that performance decreases as firm size increases. The performance difference between the smallest size group and the largest size group is positive and significant for all firms and for hedge fund only management firms.
3.2. Regression results
Using firm fund returns we then test whether diseconomies of scale exist in fund performance using the following panel regressions:
(2)
(2)
(3)
(3)
(4)
(4)
Where model (2) tests whether the relationship between firm fund size and performance is linear, model (3) tests whether the relationship is quadratic and model (4) tests whether it is cubic. We cluster standard errors by firm following Petersen (Citation2009) and all models include year fixed effects and control variables (Table ).
Table 3. Performance-size relationship.
The regression results in panel A show a significant linear relationship for hedge fund only management firms. The negative coefficient on the linear term indicates that increasing fund assets has a negative effect on fund performance. We do not find evidence of a non-linear relationship between size and performance for these firms. A different story emerges for management firms that generate compensation from sources in addition to hedge funds. Panel B shows that the coefficients are significant for all lagged firm assets in the cubic equation, but the relationship is non-linear. The negative coefficient on lagged firm assets shows that as AUM increase, performance decreases. The positive coefficient on the quadratic term means that as you move away from the average of AUM, the performance of larger funds increases and smaller funds decreases, whereas the negative coefficients on the cubic term means that as you move to AUM extremes, the performance of the smallest funds increases and the largest funds decreases. Consistent with Yin (Citation2016), both panels suggest that hedge fund management firms suffer from diseconomies of scale.
4. Compensation size relationship
4.1. Testing the compensation-size relationship
Having established that diseconomies of scale exist for the firms in our sample and that there is a negative relationship between firm fund performance and firm AUM, we next look at the incentives for a hedge fund management firm to increase its AUM beyond the optimal point for performance, using compensation data from our novel dataset. In particular we test whether the Yin (Citation2016) findings of a strong positive relationship between AUM and compensation hold up when actual compensation (controlling for the increased costs of operating a large hedge fund) is used rather than estimated fee income as a proxy for compensation.
Given the terms of the hedge fund compensation contract we expect that, as AUM increase, the annual management fee will also increase. Consequently, the observed diseconomies of scale will have a negative effect on performance fees but this will, to an extent, be offset by larger AUM. For instance, Yin (Citation2016) finds that the larger AUM more than offset the diseconomies of scale to performance. However, our study extends Yin (Citation2016) by also accounting for the larger costs associated with managing larger AUM. We anticipate that these should decrease the magnitude of the relationship between size and compensation.
To examine the compensation and size relationship, we first sort all hedge fund management firms into size quintiles each year and compare the average compensation of different size quintiles. For comparison, we also report the average of estimated fee income for each size quintile.
The results in Table show that compensation and estimated fee income increase monotonically with AUM. The compensation and fee income of the largest size quintile is much larger than that of the other four groups. The difference between the smallest and largest group is negative and statistically significant for all management firms. When we look at hedge fund only management firms and management firms whose compensation from hedge fund management only accounts for a small proportion of their total compensation, both compensation and estimated fees increase when fund AUM increases.
Table 4. Compensation and Estimated Fees comparison of different firms.
Looking at the difference in compensation between hedge fund only management firms and diversified firms, it is negative and statistically significant. This is because diversified firms generate compensation from sources outside of hedge funds. In contrast, comparing estimated fee income of hedge fund only management firms and diversified firms, the fee income of hedge fund only management firms are higher, due to the incentive fees earned from superior performance.
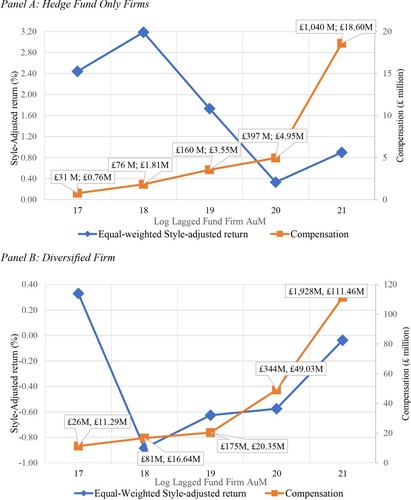
The relationship between fund assets, compensation and fund family returns is reported in Figure . The average lagged fund assets (in GBP millions), average compensation (in GBP millions) for and average style adjusted return (in %) for each size group are shown. Looking first at Panel A for Hedge Fund Only Firms, we can see that style adjusted returns are highest for the bottom two quintiles, before gradually declining in the third and fourth quintile and then showing a slight increase for the largest firms. Compensation increases steadily as the size of the funds managed by the firm increase, before increasing significantly for the largest funds. Panel B shows the same analysis for Diversified Firms. The relatively weak performance is reported on the primary axis, with only the smallest funds generating positive style adjusted returns. However, compensation increases steadily before accelerating for the firms’ managing the largest fund families.
Figure 2. Managerial compensation.
Notes: Fund returns are ranked into five groups based on their lagged fund firm assets. The average managerial compensation for each group is calculated over time. The average lagged fund firm assets under management (AuM in GBP millions) and average compensation (in GBP millions) for each size group are shown. The average lagged fund firm AuM (in GBP millions) and average style-adjusted return (in %) for each size group are shown. Panel A shows Hedge Fund Only Firms. Panel B shows Diversified Firms.
4.2. Regression results
Next, using audited compensation data, we test the relationship between firm assets under management and compensation using the following panel regressions:
(5)
(5)
(6)
(6)
Table presents results on the compensation-size relationship using audited compensation data, net of all costs. For comparison purposes, results are also reported using estimated fees. Looking first at hedge fund only firms in Panel A, we find a strong positive association between firm AUM and compensation.
Table 5. Compensation-size relationship.
In Panel B, when we report the results for diversified firms, which generate their compensation from sources in addition to hedge funds, we see that while there is a strong relationship between estimated fee income and size, the relationship between total compensation and fund size is much weaker. This is because diversified firms (despite having weaker performance and lower estimated fee income) have much higher compensation. By generating compensation from other sources the managers’ compensation is less sensitive to the performance of their funds, leading to weaker alignment between the investors in the funds of these firms and their managers.
5. Robustness
5.1. Backfill bias
Above we document a negative size-performance relationship. In this section, we see if this effect continues to exist if we use an alternative method to control for backfill bias. TASS provides an add-date for 329 funds in our sample, meaning 29 funds require the mechanical removal of some portion of their returns. Results above are based on removing the first 18 months of returns for these funds in our sample. The literature differs on the correct treatment of these funds with Fama and French (Citation2010) arguing that the first three years returns should be removed. To ensure that this arbitrary cut-off is not biasing our results we repeat the analysis with the first 36 months of returns removed.Footnote9
The results reported in Table confirm that the negative size-performance relationship is robust to methodological choices for addressing backfill bias.
Table 6. Performance–size relationship backfill bias robustness check.
5.2. Turnover threshold
To ensure that our results, showing differences in compensation between hedge fund only firms and diversified firms, are not driven by using the threshold of firm turnover being less than or greater than estimated fee income, we employ an alternative cut-off point of eighty percent of estimated fee income. For example, there may be cases where the total income of a diversified firm is below the TASS estimated fee if the hedge fund business contributes significantly to the total income of the firm.
Table reports results based on this alternative threshold for dividing firms in hedge fund only and diversified groupings. The results continue to hold for both categories of firm.
Table 7. Robustness of the Compensation-size relationship to firm classification.
5.3. Monthly and risk adjusted returns
Above we document that diseconomies of scale exist in the hedge fund industry using style-adjusted quarterly returns, following Yin (Citation2016). In this section, we test whether this effect continues to exist when alternative data frequencies and measures of performance are used. The first measure we use is style-adjusted monthly returns, which increases the informational depth of our results. We also use risk-adjusted returns, measured as the alpha calculated from Fung and Hsieh’s (Citation2004) seven-factor model, using a rolling twenty four month estimation period.
Tables and confirm our results that fund growth has a negative effect on performance using monthly style adjusted returns. Looking at the risk-adjusted returns in Table we can see that the relationship between fund size and risk-adjusted performance is non-linear but it is clear that larger funds have poorer performance, controlling for risk.
Table 8. Robustness of performance differences of firms’ funds to monthly and risk-adjusted returns.
Table 9. Robustness of the performance–size relationship to monthly and risk-adjusted returns.
5.4. Compensation per employee
Above, following Yin (Citation2016) we have considered compensation at the firm level. Managers are incentivized to maximise their own salary, not necessarily firm total compensation. If firm growth only leads to hiring more managers, then they will have no incentive to increase the total compensation of the firm. While we do not have manager level compensation data, here we use total compensation scaled by number of employees to briefly investigate the relationship between average employee compensation and firm size.
In Table we can see that for the smallest hedge fund only firms, average compensation is GBP 0.14 million, rising to over GBP 1 million for the largest hedge fund only firms. The difference between the average compensation at the top quintile hedge fund only firms and the bottom quintile hedge fund only firms is GBP 0.89 million. While the differences are not statistically significant they are economically significant.
Table 10. Compensation per employee of different firms.
We can also compare the average compensation at a hedge fund only firm with a diversified firm. For quintiles one to four, employees of diversified firms earn an additional GBP 0.23 million to GBP 0.40 million in total compensation, on average. It is only the largest hedge fund only firms where average compensation exceeds diversified firms.
6. Conclusions
The contract between hedge fund manager and investor is designed to incentivise performance, with the manager receiving a performance-based fee in addition to their annual management fee. Existing evidence suggests that, despite this incentive, the manager is still motivated to grow the AUM of the fund, notwithstanding performance diseconomies to scale. Due to a paucity of data, to date all of this evidence has relied upon the assumption that fees estimated from the hedge fund databases closely approximate the actual compensation earned by the hedge fund manager. This is problematic because it is well recognised that hedge fund databases contain several biases, and also because hedge fund managers have very significant and time varying costs which need to be accounted for to properly measure compensation.
Using our novel dataset of hedge fund manager filings, we are able to use audited compensation data to provide new evidence on the conflict of interest between hedge fund managers and their investors. Our evidence is largely consistent with Yin (Citation2016). We find significant evidence of diseconomies of scale – that is, as AUM increase, performance deteriorates. Nonetheless, our evidence suggests that managers have an incentive to grow assets at the cost of performance, because their compensation, after accounting for all costs, increases with AUM.
Within our sample we have two main types of hedge fund management firm. The first (hedge fund only firms), generate compensation entirely from hedge funds, while the second (diversified firms) generate a relatively small proportion of compensation from hedge funds. The funds managed by these two classifications of hedge fund firm have vastly different performance. Hedge fund only firms outperform by 80% relative to their peers, whereas diversified firms underperform by 15%.
There is also a large variation in the compensation of these two classifications of hedge fund firm. Our results show that the incentives to grow assets are strong for hedge fund only firms because their compensation is tightly linked to AUM. Even when fund firms generate a relatively small proportion of their compensation from hedge fund management, managers are still motivated to maximise fund size, but the relationship is weaker due to their total compensation being less sensitive to fund size.
These results are important for investors. Even accounting for the large cost base of firms who manage bigger funds, managers have strong incentives to grow AUM to maximise their own compensation. Investors should be particularly attentive to diversified firms who manage hedge funds, because managerial incentives in these firms are less closely aligned with the interests of their investors.
Acknowledgements
Mark Hutchinson would like to acknowledge Bill Christie and the Owen Graduate School of Management, Vanderbilt University, for hosting him as a Visiting Scholar, while he worked on this study.
Disclosure statement
No potential conflict of interest was reported by the author(s).
Correction Statement
This article has been corrected with minor changes. These changes do not impact the academic content of the article.
Additional information
Funding
Notes on contributors
Mark C. Hutchinson
Mark C. Hutchinson is Professor and Chair of Finance at Cork University Business School, University College Cork. He is known for his ability to collect novel data and provide new insights on investment strategies, through his strong links with the financial services industry. His current research agenda focuses on two areas: the intersection of hedge funds and trading strategies; and Fintech.
Quang Minh Nhi Nguyen
Quang Minh Nhi Nguyen is a lecturer in the Faculty of Finance, University of Economics, The University of Danang (UD-DUE). Her current research interests include corporate finance, market efficiency and fund performance. She completed her PhD at University College Cork, which focused on the insights from existing and new financial data.
Mark Mulcahy
Mark Mulcahy is Professor in Corporate Finance at Cork University Business School, University College Cork. His current research focus is in the areas of corporate governance and investments and he is widely published in these areas.
Notes
1 Yin (Citation2016) recognises the important role that high costs (for example, risk management, trading software and investments in research) will play in explaining the non-linear performance-size relationship for hedge funds.
2 ‘Hedge funds fees take a trim’, Financial Times, December 22nd 2016.
3 There are several competing explanations as to why managers in diversified firms make poor resource allocation decisions, and over invest in divisions with relatively weak performance. These include agency cost models, based on CEO entrenchment (Shleifer and Vishny Citation1989), influence cost models (Meyer, Milgrom, and Roberts Citation1992) where managers of a division with weak prospects are incentivized to influence top management to channel resources into their division, and models based on internal power struggles amongst competing divisions of different sizes (Rajan, Servaes, and Zingales Citation2000).
4 Prior to the introduction of Form PF, the SEC introduced a requirement to file Form ADV, a regulatory tool designed to allow market participants to measure operational risk of hedge fund investment managers, which was subsequently overturned in the judicial system.
5 As a robustness check, later in the paper we report results with alternative approaches to addressing backfill bias.
6 In unreported results, to ensure our findings are robust to our assumption of duplicate share classes, we aggregate duplicates rather than deleting them. The results are consistent with those reported in the paper.
7 In a robustness test in Section 5, we report results using a threshold of 80% of turnover to classify firms as Hedge Fund Only and Diversified.
8 Due to concerns about the size of our sample we repeat all analyses with sorts into size based terciles and quartiles. Findings are consistent with the quintile based results.
9 In unreported results we also remove the first 24 months of returns. The results are unaffected.
References
- Agarwal, V., N. D. Daniel, and N. Y. Naik. 2009. “Role of Managerial Incentives and Discretion in Hedge Fund Performance.” Journal of Finance 64: 2221–2256.
- Aggarwal, R. K., and P. Jorion. 2010. “The Performance of Emerging Hedge Funds and Managers.” Journal of Financial Economics 96: 238–256.
- Aragon, G. O., M. Hertzel, and Z. Shi. 2013. “Why do Hedge Funds Avoid Disclosure? Evidence from Confidential 13F Filings.” Journal of Financial and Quantitative Analysis 48: 1499–1518.
- Aragon, G. O., and V. Nanda. 2011. “Tournament Behavior in Hedge Funds: High-Water Marks, Fund Liquidation, and Managerial Stake.” Review of Financial Studies 25: 937–974.
- Berk, J. B., and R. C. Green. 2004. “Mutual Fund Flows and Performance in Rational Markets.” Journal of Political Economy 112: 1269–1295.
- Brown, S., W. Goetzmann, B. Liang, and C. Schwarz. 2008. “Mandatory Disclosure and Operational Risk: Evidence from Hedge Fund Registration.” Journal of Finance 63: 2785–2815.
- Fama, E. F., and K. R. French. 2010. “Luck Versus Skill in Mutual Fund Returns.” Journal of Finance 65: 1915–1947.
- Fung, W., and D. A. Hsieh. 2004. “Hedge Fund Benchmarks: A Risk-Based Approach.” Financial Analysts Journal 60: 65–80.
- Goetzmann, W. N., J. E. Ingersoll Jr, and S. A. Ross. 2003. “High-water Marks and Hedge Fund Management Contracts.” Journal of Finance 58: 1685–1718.
- Lamont, O. 1997. “Cash Flow and Investment: Evidence from Internal Capital Markets.” Journal of Finance 52: 83–109.
- Lim, J., B. A. Sensoy, and M. S. Weisbach. 2016. “Indirect Incentives of Hedge Fund Managers.” Journal of Finance 71: 871–918.
- Meyer, M., P. Milgrom, and J. Roberts. 1992. “Organizational Prospects, Influence Costs, and Ownership Changes.” Journal of Economics and Management Strategy 1: 9–35.
- Nohel, T., Z. J. Wang, and L. Zheng. 2010. “Side-by-side Management of Hedge Funds and Mutual Funds.” Review of Financial Studies 23: 2342–2373.
- Petersen, M. A. 2009. “Estimating Standard Errors in Finance Panel Data Sets: Comparing Approaches.” Review of Financial Studies 22: 435–480.
- Rajan, R., H. Servaes, and L. Zingales. 2000. “The Cost of Diversity: The Diversification Discount and Inefficient Investment.” Journal of Finance 55: 35–80.
- Shleifer, A., and R. Vishny. 1989. “Management Entrenchment: The Case of Manager Specific Assets.” Journal of Financial Economics 25: 123–140.
- Sun, L., and M. Teo. 2019. “Public Hedge Funds.” Journal of Financial Economics 131: 44–60.
- Yin, C. 2016. “The Optimal Size of Hedge Funds: Conflict Between Investors and Fund Managers.” Journal of Finance 71: 1857–1894.