
 ?Mathematical formulae have been encoded as MathML and are displayed in this HTML version using MathJax in order to improve their display. Uncheck the box to turn MathJax off. This feature requires Javascript. Click on a formula to zoom.
Abstract
This paper proposes a novel asymmetric jump model for modeling interactions in discontinuous movements in asset prices. Given the jump behavior and high volatility levels in cryptocurrency markets, we apply our model to cryptocurrencies to study the impact of various types of jumps occurring in one cryptocurrency’s price process on the discontinuity component of the realized volatility of other cryptocurrencies. Our model also allows us to assess the impact of co-jumps. Using high-frequency data to compute the daily realized volatility, we show that downside, upside, and small jumps observed in cryptocurrencies negatively affect the jump component of other cryptocurrencies’ realized volatility, while large jumps have the opposite effect. We further find significant asymmetric effects between small and large as well as between downside and upside jumps for several cryptocurrencies. Moreover, we find evidence of co-jumping behavior, which can trigger future jumps. The practical implications of our findings are also discussed. Finally, we extend our analysis to study the effects of jumps in mainstream financial assets on cryptocurrencies’ jump behavior and find that upside and downside jumps observed in the S&P 500 index negatively impact cryptocurrency jumps.
1. Introduction
Over the last decade, blockchain-based applications and cryptocurrencies have been in the limelight, being viewed as technological breakthroughs in finance. Indeed, within only few years since its launch, Bitcoin attracted substantial attention from investors, policy makers, and the media alike, partly due to its nature as a ‘new’ digital currency which could be characterized neither as a ‘commodity’ nor as ‘fiat money’, since it shares features from both categories (Selgin Citation2015), but primarily due to the fact that it has provided its users with remarkably high returns over short periods of time. Following Bitcoin’s success, several alternative digital coins (‘altcoins’) have been introduced, with the total estimated market capitalization exceeding the value of $990bn in January 2021 (coinmarketcap.com accessed on 20th January 2021). Nevertheless, cryptocurrencies have largely been scrutinized for their risks, given that cryptocurrency markets have been characterized by large abrupt price swings in the form of jumps and high levels of volatility.
Jumps constitute ‘sporadic events of a larger amplitude than what a continuous diffusion process can explain’ (Scaillet, Treccani, and Trevisan Citation2020), which not only have important implications for risk management (Bakshi and Panayotov Citation2010) and option pricing (Merton Citation1976) but also for explaining crashes (Bates Citation2000), which are of primary concern to cryptocurrency users and speculators. An asset’s jump behavior is further important for modeling its volatility dynamics (Eraker, Johannes, and Polson Citation2003). Volatility is, in turn, an important element in investment decisions (Poon and Granger Citation2003), since risk management, asset allocation, option pricing, and trading strategy selection require volatility estimations (see, e.g. Bauwens, Hafner, and Laurent Citation2012). Volatility, defined as the second moment of the price process of a financial time series, is also a measure of risk. Moreover, understanding volatility spillovers is of high importance to investors, as such spillover effects can limit their diversification benefits.
Nonetheless, volatility is latent; that is, volatility is not directly observed as a variable, a fact that constitutes an inherent problem noticed when deriving volatility forecasts. Parametric models or GARCH models are considered as latent variable models (Bollerslev Citation1986). Schwartz (Citation1997) highlighted the importance of pricing uncertainties/risks in real options valuation, where parametrically estimated implied volatility is deemed to be an efficient forecast of latent volatility. However, a rational expectations assumption that the market option price exposes the market’s true volatility estimation is required (Latané and Rendleman Citation1976). On the other hand, non-parametric estimators of volatility are often preferred. Indeed, any non-parametric estimator that estimates the quadratic variation is considered as the best estimator of integrated (latent) volatility (Barndorff-Nielsen and Shephard Citation2002; Hansen and Lunde Citation2006; Sun Citation2006). Realized volatility, in particular, can be estimated by non-parametric estimators - as well as by parametric and semi-parametric ones - but high-frequency data make the non-parametric estimation of volatility more accurate (Andersen, Dobrev, and Schaumburg Citation2012; Barndorff-Nielsen and Shephard Citation2002).
Volatility can be decomposed into two components, namely ‘good’ volatility and ‘bad’ volatility (Giot, Laurent, and Petitjean Citation2010). The former is directional and persistent, whereas the latter is jumpy, comprising discontinuous movements in asset prices. Therefore, ‘bad’ volatility is more difficult to be anticipated than ‘good’ volatility. Previous studies have established that the inclusion of jumps improves volatility modeling and forecasting (see, e.g. Duffie, Pan, and Singleton Citation2000; Eraker, Johannes, and Polson Citation2003; Broadie, Chernov, and Johannes Citation2007). Jumps, as discontinuous movements in asset prices, constitute a component of ‘bad’ volatility but at the same time they offer an effective tool to predict volatility, with a large number of studies predicating on jumps in order to predict volatility more accurately (see, e.g. Andersen et al. Citation2003; Andersen et al. Citation2007; Corsi et al. Citation2008; Barndorff-Nielsen, Kinnebrock, and Shephard Citation2010; Corsi, Pirino, and Renò Citation2010; Patton and Sheppard Citation2015). The decomposition of jumps into downside and upside jump components, in particular, increases the accuracy of ‘volatility prediction’ estimations, with the upside/downside variance spread being found a driver of the asymmetry in stock price distributions, thus allowing us to better model and understand risk (see Duong and Swanson Citation2015).
Against this backdrop, in this paper, we propose a novel jump model approach to capture the asymmetric effects of various jump variations in the underlying price process. Motivated by two stylized facts observed in cryptocurrency markets, namely very high volatility levels compared to mainstream financial markets and jumpy behavior, we apply our model to five major cryptocurrencies, namely Bitcoin, Ether, Ripple, Litecoin, and EOS, to investigate the causal effects of various types of jumps occurring in one cryptocurrency’s market on other cryptocurrencies. Specifically, we investigate the impact not only of downside and upside but also of small and large jumps occurring in Bitcoin on the discontinuity component of the realized volatility of the four altcoins considered as well as the impact of such jumps occurring in altcoins on the jump variations of Bitcoin and of other altcoins. Given that jumps in financial asset prices are often incorrectly identified when using low data frequencies but are instead less frequent, accounting for a small proportion of the total price variation, when using higher data frequencies (Christensen, Oomen, and Podolskij Citation2014), in our study we utilize intraday data to construct the realized volatility series.
As will be shown, we find that overall downside, upside as well as small jumps observed in cryptocurrencies have a negative effect on the discontinuity component of the realized volatility of other cryptocurrencies, while large jumps in cryptocurrencies have a positive impact on other cryptocurrencies’ jumpy component. In addition, we find significant asymmetric effects between small and large as well as between downside and upside jumps occurring in Bitcoin on the discontinuity part of the four altcoins’ realized volatility, as well as between downside and upside jumps occurring in altcoins on Bitcoin’s jumpy behavior and between small and large jumps in altcoins on discontinuities of other altcoins. We further find evidence of co-jumping behavior between the considered pairs of cryptocurrencies, which can trigger future jumps. Finally, by extending our analysis to study the effects of jumps in mainstream financial assets on cryptocurrencies’ jump behavior, we find that upside and downside jumps observed in the S&P 500 index negatively affect cryptocurrency jumps.
Our contribution is multifold: First, we study the presence of jumps not only in Bitcoin’s underlying price process but also in altcoins and explore for the first time how different types of jumps (i.e. total jumps, downside, upside and asymmetric jumps, large and small jumps, constructed from intraday data) in one cryptocurrency affect the jump component of another, providing a more systematic characterization of the types of events that cause cryptocurrencies to jump. Specifically, we shed light on the discontinuous sources of volatility (i.e. the ‘bad’ volatility) in cryptocurrency markets and, in particular, on whether a jump occurring in one cryptocurrency can trigger discontinuous price movements in other cryptocurrencies. We therefore contribute not only to the rather limited literature on cryptocurrencies’ jump behavior but also to the literature on interdependencies between cryptocurrencies. Second, we add another dimension to the interlinkages between cryptocurrencies’ ‘bad’ volatility by exploring whether cryptocurrencies’ correlations and/or their co-jumping behavior can trigger large movements. Given that our paper sheds light on the types of events that cause jumps in cryptocurrency markets, it is a natural research extension in our setting to consider these two variables. By accommodating all of these features in our model, we take a completely different approach to past studies on jump/co-jumping behavior in cryptocurrency markets, such as Bouri, Roubaud, and Shahzad (Citation2020). Third, by employing intraday data, our results contribute to the limited literature that utilizes high-frequency cryptocurrency data. Fourth, we find it promising to link the dynamics and asymmetric behavior of various types of jumps to that of the daily jump component of cryptocurrencies in a single model. To this end, we propose a novel model approach that allows for asymmetric effects of various types of jumps and co-jumps capturing various phases in cryptocurrency price movements, but more importantly, that models interactions linked with the non-diversifiable risk (i.e. the ‘bad’ component) of cryptocurrencies’ volatility. This approach therefore controls for asymmetric effects of various jump variations and volatility phases. The general idea behind this model is related to earlier literature that seeks to explain the observed differences in the jump series’ behavior of assets as well as the prices of the underlying assets through the pricing of jump risk. Fifth, we further employ the proposed model to investigate the impact of various types of jumps in equity markets on the jumpy behavior of cryptocurrencies. Our paper therefore also contributes to the growing literature on linkages between cryptocurrencies and traditional assets. Last but not least, we assess the practical implications of our proposed model for portfolio management. More specifically, we take the viewpoint of investors who are exposed to downside jump risk occurred in cryptocurrency markets and we provide a novel portfolio analysis based on Sortino ratios. To the best of the authors’ knowledge, this has not been previously analyzed in the literature.
The remainder of the paper is organized as follows: Section 2 reviews relevant literature. Section 3 details the methodology employed. Section 4 presents the data used in this study. Section 5 discusses the empirical results along with practical implications arising from our model for portfolio management. Finally, section 6 provides the concluding remarks of this study.
2. Literature review
The literature on cryptocurrencies has rapidly emerged over the last few years. The majority of past studies have been reviewed in Corbet et al. (Citation2019). This section therefore provides a brief review of related studies. Specifically, we first present some empirical considerations on cryptocurrencies’ characteristics and then review past studies on the jump and co-jumping behavior in cryptocurrency markets and explain the rationale behind our research design.
Several past studies have investigated cryptocurrencies’ characteristics, revealing that cryptocurrency price returns exhibit heavy distribution tails (Osterrieder and Lorenz Citation2017; Fry Citation2018; Gkillas and Katsiampa Citation2018; Gkillas and Longin Citation2018; Phillip, Chan, and Peiris Citation2018), proneness to speculative bubbles (Cheah and Fry Citation2015; Fry and Cheah Citation2016; Corbet et al. Citation2018; Fry Citation2018; Cretarola and Figà-Talamanca Citation2021), volatility (Katsiampa Citation2017; Phillip, Chan, and Peiris Citation2018; Shen, Urquhart, and Wang Citation2020; Baur and Dimpfl Citation2021), and persistence (Caporale, Gil-Alana, and Plastun Citation2017; Bouri et al. Citation2019), among others. Several studies have also found that cryptocurrency markets tend to be isolated from mainstream financial markets (see, e.g. Baur, Hong, and Lee Citation2017; Corbet et al. Citation2018; Bouri et al. Citation2020) but are interconnected with each other (Corbet et al. Citation2018; Yi, Xu, and Wang Citation2018; Ji et al. Citation2019; Katsiampa Citation2019; Katsiampa, Corbet, and Lucey Citation2019a, Citation2019b; Wang and Ngene Citation2020; Mensi et al. Citation2020; Katsiampa, Yarovaya, and Zięba Citation2021; Mensi et al. Citation2021), with cryptocurrency users facing undifferentiated risks (Gkillas and Katsiampa Citation2018). Interestingly, it has been shown that not only Bitcoin spills over to altcoins but also altcoins spill over to Bitcoin. More specifically, Katsiampa, Corbet, and Lucey (Citation2019b) and Wang and Ngene (Citation2020) studied spillover effects between pairs of cryptocurrencies and found bi-directional shock transmission effects as well as bi-directional volatility spillovers between Bitcoin and altcoins. Furthermore, Yi, Xu, and Wang (Citation2018) found that cryptocurrencies with large market capitalization are more likely to propagate volatility shocks to others but some less noticeable cryptocurrencies, such as Maidsafe Coin, are also significant net transmitters of volatility connectedness and have even larger contribution of volatility spillovers to others.
Nevertheless, despite the fact that cryptocurrencies have received substantial attention over the last few years, the literature on cryptocurrencies’ jump behavior is rather limited, even though the impact of jumps occurring in financial time series has been widely explored in recent times (see, e.g. Barndorff-Nielsen and Shephard Citation2006; Evans Citation2011; Driessen and Maenhout Citation2013; Christensen, Oomen, and Podolskij Citation2014; Clements and Liao Citation2017; Caporin, Rossi, and Magistris Citation2015; Da Fonseca and Ignatieva Citation2019). Among the few studies of cryptocurrency jumps are those of Chaim and Laurini (Citation2018), Gronwald (Citation2019), Scaillet, Treccani, and Trevisan (Citation2020), and Shen, Urquhart, and Wang (Citation2020). More specifically, Chaim and Laurini (Citation2018) studied jumps in Bitcoin returns and volatility and found that jumps in returns only have contemporaneous effects, whereas jumps in volatility are permanent, while Gronwald (Citation2019) using GARCH and jump-GARCH models found that the price dynamics of Bitcoin are affected by extreme price movements with the effect being larger than that in the crude oil and gold markets, and Shen, Urquhart, and Wang (Citation2020) showed that the inclusion of jumps enhances the predictive ability of heterogeneous autoregressive (HAR) models applied to Bitcoin and is therefore important when forecasting its volatility. Moreover, Scaillet, Treccani, and Trevisan (Citation2020) used data from the Mt. Gox exchange and found that, as opposed to large-cap stock markets, jumps in Bitcoin series are frequent. The authors further showed that jumps have a direct positive effect in market activity and illiquidity while causing a persistent change in the price. Other studies of jumps in Bitcoin series include those of Hu, Härdle, and Kuo (Citation2019), Wang et al. (Citation2019), Yu (Citation2019), and Hung, Liu, and Yang (Citation2020). Nonetheless, all of these studies considered only Bitcoin while excluding altcoins, which have been gaining in popularity over the last few years.1
More importantly, though, cryptocurrencies’ co-jumping behavior still remains underexplored in the literature. To the best of the authors’ knowledge, only Bouri, Roubaud, and Shahzad (Citation2020) have examined co-jumping behavior in cryptocurrency markets. Specifically, Bouri, Roubaud, and Shahzad (Citation2020) found significant jump activity in the returns of all the cryptocurrencies considered in their study, and especially in Ripple, Bitcoin, and Litecoin, as well as evidence of co-jumping behavior for most cryptocurrencies, indicating that the occurrence of jumps in one cryptocurrency increases the likelihood of jumps occurring in other cryptocurrencies. However, Bouri, Roubaud, and Shahzad (Citation2020) examined only whether cryptocurrencies jump together without studying any causal effects.2
Identifying causal links when large price movements take place is of high importance for risk management, portfolio allocation as well as derivative pricing (Clements and Liao Citation2017), while the importance of studying the effects of jumps and taking them into account when predicting volatility has been highlighted in several studies (see, e.g. Eraker, Johannes, and Polson Citation2003; Eraker Citation2004; Corsi and Renò Citation2009). Indeed, Corsi and Renò (Citation2009) showed that jumps constitute a key endogenous component in the dynamics of financial market volatility. They further highlighted not only that explicitly modeling jumps has a trimming impact on the dynamics of the persistent volatility component but also that jumps have a positive and significant effect in future volatility. Therefore, in our study, not only do we study how different types of jumps in one cryptocurrency affect the jump component of another but we also assess the impact of co-jumps (i.e. jumps occurring in two cryptocurrency markets simultaneously) on the ‘bad’ component of cryptocurrencies’ volatility.
3. Methodology
In this section, we discuss the methodology employed in our study. We start by presenting the novel model approach proposed in our study. This model approach allows us to study asymmetric effects of various types of jumps (i.e. total jumps, downside, upside, and asymmetric jumps, large and small jumps) and co-jumps in a single model.3 Then, we discuss the tests employed to study the asymmetric effects of the various types of jumps.
3.1. Model
In order to investigate the asymmetric effects not only of downside and upside jumps but also of small and large jumps observed in the price process of one cryptocurrency in the jump component of another cryptocurrency, we include four dummy variables representing each type of the aforementioned jumps in our model. We also include one dummy variable to capture the impact of co-jumps (simultaneous jumps in the volatility processes of two particular cryptocurrencies) as well as a variable to capture the impact of the realized correlation between two cryptocurrencies. Consequently, our model for the asymmetric responses of cryptocurrency i to the various jump components takes the following form
(1)
(1) where
denotes an indicator function (dummy variable),
and
denote jumps in cryptocurrencies
and
, respectively, on day
,
and
represent upside and downside jumps, respectively, in cryptocurrency
on day
, while
and
denote small and large jumps, respectively, in cryptocurrency
on day
. All these types of jumps are defined as detailed in Appendix A. Furthermore,
and
measure the direct effect of downside and upside jumps, respectively, observed in cryptocurrency
on jumps in cryptocurrency
, and
and
measure the direct effect of small and large jumps occurring in cryptocurrency
on jumps in cryptocurrency
, accordingly, whereas
measures the direct effect of co-jumps, and
denotes the effect of the realized correlation (
) between cryptocurrencies
and
. The model coefficients are estimated using the ordinary least squares (OLS) method with heteroskedasticity and autocorrelation consistent (HAC) standard errors. The number of lags,
, was selected according to the Akaike information criterion.
3.2. Tests for asymmetric response to jump components
Once the model parameters are estimated, we proceed with testing for asymmetric effects between different types of jumps. First, we test for the equality of the direct effects of upside and downside jumps occurring in one cryptocurrency on the jump behavior of other cryptocurrencies by testing the null hypothesis using both a t-test statistic (T1 test) and an F-test statistic (F1 test). Second, we test for the equality of the direct effects of small and large jumps occurring in one cryptocurrency on the jump part of other cryptocurrencies by testing the null hypothesis
by employing a t-test statistic (T2 test) and an F-test statistic (F2 test), accordingly. Third, the direct effects of upside and downside jumps are compared to those of small and large jumps using an F-test (F3 test), where the null hypothesis is
. The latter test, in particular, allows us to better understand whether the use of square transformations of positive and negative intraday returns when attempting to model and understand risk is different from the jump decomposition into small and large jumps technique implemented in Duong and Swanson (Citation2011). Jumps add a source of risk and, as noted by Granger (Citation2008), ‘risk relates to an unfortunate event occurring, so for an investment, this corresponds to a low, or even negative, return’. It is worth noting that simillar tests were performed in Apergis and Miller (Citation2006) and Koulakiotis, Kiohos, and Babalos (Citation2015), albeit to answer different research questions.
4. Data
In our study, we restrict to cryptocurrencies with a market capitalization exceeding $5 billion that were in existence for over two years as of 30th June 2019. These criteria result in our dataset to comprise five cryptocurrencies, namely Bitcoin (BTC), Ether (ETH), Ripple (XRP), Litecoin (LTC), and EOS. Specifically, our dataset consists of intraday prices of the aforementioned cryptocurrencies at the hourly frequency and spans the period from 1st July 2017–30th June 2019, thus covering a two-year period and 17,520 hourly observations.4 Using the intraday price data, we calculate the daily realized volatility of each cryptocurrency as discussed in Appendix A, resulting in each realized volatility series to have 730 observations.
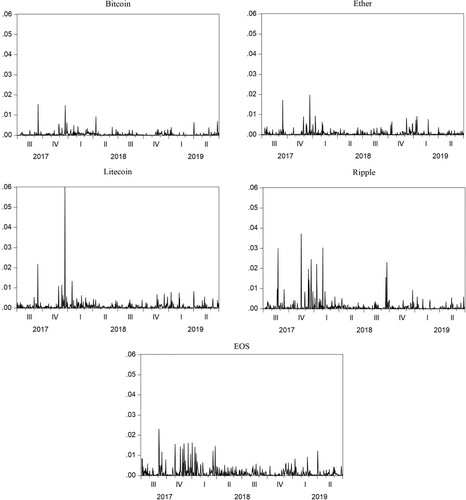
Figure illustrates the total jump series of the five cryptocurrencies considered over our sample period. According to this figure, some of the largest jumps in all cryptocurrencies occurred during the second half of 2017 and in the beginning of 2018, while the size of the jumps has substantially decreased overall since then, in particular throughout the most recent 2018-9 sample period. This is especially true for Bitcoin. The period during which the largest jumps are observed coincides with the period when cryptocurrency markets received increasing attention and witnessed remarkable price increases when Bitcoin’s price reached almost US $20,000 for the first time, while from the beginning of 2018 onwards all cryptocurrency prices gradually decreased. This result is somewhat consistent with Bouri, Roubaud, and Shahzad (Citation2020) who also found that most of the jumps occurred in 2017–2018. It can also be noticed that the most frequent large jumps are observed in EOS. Overall, both the size and occurrence of jumps appear to be more predictable during 2017 and in the beginning of 2018 than in the second half of our sample period, as indicated by their frequency.
Figure 1. Cryptocurrencies’ total jumps.
Note: This Figure depicts the jumps in the five cryptocurrencies considered, namely Bitcoin, Ether, Litecoin, Ripple, and EOS, for the period from 1st July 2017–30th June 2019 (730 observations).
The descriptive statistics of the total jump series for the five cryptocurrencies are reported in Table . Analyzing the distributional properties of cryptocurrencies’ jumps is of high importance to cryptocurrency users and investors. It can be noticed that EOS exhibits the highest and Bitcoin the lowest mean jump value. The total jump series of all the cryptocurrencies considered in our study exhibit a kurtosis value that is far larger than 3, indicating that the distributions of all jump series have thicker tails than the normal distribution, with the distribution of Litecoin’s jump series, in particular, having the highest excess kurtosis. Moreover, all jump series are positively skewed. As expected, the Jarque-Bera test provides evidence against the null hypothesis of normality in all cryptocurrencies’ jump series. Given the descriptive statistics above, it is sensible to expect asymmetries in the employed series.
Table 1. Descriptive statistics of total jump series.
5. Empirical results
This section presents our empirical results. First, we discuss the estimation results of the asymmetric jump model applied to the cryptocurrencies considered in our study. Second, we discuss the results of the tests for asymmetric effects between the different types of jumps. We, then, discuss the implications of our results in terms of optimal portfolio construction. Finally, we extend our analysis by studying the impact of the different types of jumps occurring in the S&P 500 equity index on the jump behavior of cryptocurrencies.
5.1. Estimation results
The estimation results of the asymmetric jump model presenting the impact of jumps occurring in Bitcoin on the discontinuity component of the realized volatility of the four altcoins are reported in Table (Panel A). These include the estimated coefficients of downside, upside, small, and large Bitcoin jumps. According to the results, although there are some discrepancies regarding the magnitude of the various jumps’ effects, we notice rather similar results across the four altcoins considered. Specifically, downside, upside, and small jumps in Bitcoin have a negative, and statistically significant at the 1% (Ether, Litecoin, and EOS) or 5% (Ripple) level, impact on the discontinuity component of the realized volatility of all four altcoins. It is worth noting that, in absolute terms, the largest magnitude of the effects of downside and upside jumps in Bitcoin is found for the discontinuity component of the realized volatility of EOS, and the smallest magnitude is found for that of Ether. More specifically, the estimated coefficient on downside jumps, , in Bitcoin ranges from −0.0021 (EOS) to −0.0006 (Ether), and the estimated coefficient on upside jumps,
, ranges from −0.0024 (EOS) to −0.0006 (Ether), whereas the estimated effect of small jumps (
) in Bitcoin ranges from −0.0014 (Ether) to −0.0007 (Ripple). On the other hand, large jumps in Bitcoin have a positive, and statistically significant at the 1% level, effect on the discontinuity component of the realized volatility of all of the four altcoins considered, with the estimated
coefficient ranging between 0.0007 (Ether) and 0.0014 (Ripple). It is also worth noting that we observe remarkable asymmetries in the magnitude between coefficients
and
across all the four models as well as between coefficients
and
for Litecoin, a fact that justifies the importance of testing for significant asymmetries between the different jumps.
Table 2. Effects of jumps in Bitcoin on jumps in altcoins.
Furthermore, our results reveal that co-jumps between Bitcoin and altcoins have a positive and significant at the 1% level impact on the discontinuity component of the realized volatility of all the altcoins, with the estimated coefficient ranging from 0.0008 (Ether) to 0.0018 (EOS). This finding is to some extent in line with Bouri, Roubaud, and Shahzad (Citation2020) who also found evidence of co-jumping behavior between cryptocurrencies. Similarly, we find that the realized correlation between Bitcoin and altcoins has a positive and statistically significant impact on the jump behavior of altcoins. The only exception to this constitutes the impact of the realized correlation between Bitcoin and Ripple on the jump component of Ripple, which, although positive, is not significant at any conventional level of significance.
Table (Panel A) presents the estimation results of our model illustrating the impact of jumps occurring in altcoins on the discontinuity component of the realized volatility of Bitcoin, accordingly. Upside and small jumps in altcoins are similarly found to have a negative, and statistically significant at the 1% level, impact on the jump behavior of Bitcoin, with the estimated effect of upside jumps ranging from −0.0008 (EOS) to −0.0005 (Ripple), and the estimated impact of small jumps
ranging between −0.0010 (Litecoin) and −0.0007 (EOS and Ripple). Furthermore, with the exception of EOS, downside jumps in altcoins also have a negative and significant at the 1% level effect on the jump component of Bitcoin. On the other hand, downside jumps in EOS have a positive and significant at the 1% level impact on jumps in Bitcoin, which interestingly has the highest magnitude in absolute terms (0.0007). Moreover, similar to the impact of large jumps occurring in Bitcoin on the jump behavior of altcoins, large jumps in altcoins also have a positive and significant effect on Bitcoin jumps, with their estimated effect (
) ranging from 0.0005 (EOS) to 0.0008 (Litecoin). In addition, irrespective of the altcoin under consideration, co-jumps between altcoins and Bitcoin have a positive and significant at the 1% level impact on the jump behavior of Bitcoin, with the estimated coefficient on co-jumps,
, being equal to around 0.0006 in all models, whereas the effect of the realized correlation between altcoins and Bitcoin,
is also positive and significant at the 5% level, ranging from 0.0286 (EOS) to 0.0312 (Ether).
Table 3. Effects of jumps in altcoins on jumps in Bitcoin.
We have also applied our asymmetric jump model to pairs of altcoins. Tables (Panel A) report the estimation results presenting the impact of jumps occurring in each altcoin on the discontinuity component of the realized volatility of the other three altcoins.5 Similar to the earlier findings on the effects of jumps occurring in Bitcoin on the jump behavior of altcoins, and vice versa, we find that downside (), upside (
), and small (
) jumps in each altcoin all have a negative and statistically significant impact on the discontinuity component of the realized volatility of other altcoins, and that large jumps (
) and co-jumps (
) have a positive and significant impact on the jump component of other altcoins. Similarly, realized correlations (
) have a positive and statistically significant impact on the discontinuity component of the realized volatility of Ether, Litecoin, and EOS, but an insignificant effect on Ripple’s jump behavior.
Table 4. Effects of jumps in altcoins on jumps in Ether.
Table 5. Effects of jumps in altcoins on jumps in Ripple.
Table 6. Effects of jumps in altcoins on jumps in Litecoin.
Table 7. Effects of jumps in altcoins on jumps in EOS.
Our findings have therefore revealed significant effects of the different types of jumps observed in Bitcoin and altcoins on the jump behavior of other cryptocurrencies. Consequently, our results are in accordance with prior evidence of volatility connectedness among major cryptocurrencies and significant spillover effects not only from Bitcoin to altcoins but also from altcoins to Bitcoin as well as between altcoins (see, e.g. Corbet et al. Citation2018; Yi, Xu, and Wang Citation2018; Ji et al. Citation2019; Katsiampa, Corbet, and Lucey Citation2019a,b; Wang and Ngene Citation2020; Katsiampa, Yarovaya, and Zięba Citation2021; Mensi et al. Citation2021). In addition, our findings show that co-jumps in cryptocurrencies have a positive and significant effect in cryptocurrency jumps. Although Bouri, Roubaud, and Shahzad (Citation2020) also found evidence of co-jumping behavior between cryptocurrencies, our results suggest that this co-jumping behavior can trigger future jumps. Moreover, in contrast with Bouri, Roubaud, and Shahzad (Citation2020) who found that jumps in some cryptocurrencies such as Ripple are disjointed from other cryptocurrencies, we have found interdependencies between all the cryptocurrency pairs considered.
5.2. Test results for asymmetric response to jump components
In this sub-section, we discuss the results of the statistical tests for asymmetric effects of the various jumps. With regard to testing for asymmetric responses of jumps in altcoins to jumps occurring in Bitcoin (Table , Panel B), we notice that both the t- (T1) and F- (F1) test statistics suggest the rejection of the null hypothesis of equality of the effects of downside and upside jumps in Bitcoin - in favor of the alternative hypothesis of statistically different downside and upside jump coefficients - for Ripple, Litecoin, and EOS, thus revealing significant asymmetric responses of the three altcoins to downside and upside jumps in Bitcoin. It is worth noting that the same conclusion can also be reached for Ether based on the F1 test but not based on the T1 test. The t-test (T2) results further suggest the rejection of the null hypothesis of equality between the effects of small and large jumps in Bitcoin (
) at the 1% level for all four altcoins, therefore indicating significant asymmetric responses of altcoin jumps to small and large jumps occurring in Bitcoin. However, the F-test statistic (F2) provides consistent results only for EOS. In addition, the F-test statistic (F3) results suggest the rejection of the null hypothesis of equality between the sum of the coefficients of upside and downside jumps and the sum of the coefficients of small and large jumps in Bitcoin (
) at the 5% level for all altcoins except for Ether, thus revealing that the total effect of downside and upside jumps observed in Bitcoin is significantly different from the sum of the effects of small and large Bitcoin jumps (
) in the case of Ripple, Litecoin, and EOS.
When testing for asymmetric effects of jumps occurring in altcoins on the jump behavior of Bitcoin (Table , Panel B), the null hypothesis of equality of the effects of downside and upside jumps in altcoins is rejected at the 1% level of significance according to both the T1 and F1 test statistics, irrespective of the altcoin under consideration, therefore indicating significant asymmetric responses of Bitcoin jumps to downside and upside jumps in altcoins, similar to what we found for most altcoins’ responses to downside and upside jumps in Bitcoin. On the other hand, the T2 and F2 test results suggest the rejection of the null hypothesis of equality between the effects of small and large jumps in altcoins
only in the case of Litecoin. Finally, the F3 test results suggest the rejection of the null hypothesis of equality between the sum of the coefficients of upside and downside jumps in an altcoin and the sum of the coefficients of small and large jumps in the same altcoin (
), irrespective of the altcoin under consideration. We therefore observe significant asymmetries between the sum of the effects of upside and downside jumps and the sum of the effects of small and large jumps in altcoins.
As for the test results for asymmetric responses of jumps in one altcoin to jumps occurred in other altcoins (Tables , Panel B)6, we notice that both the T2 and F2 test statistics suggest the rejection of the null hypothesis of equality of the effects of small and large altcoin jumps at the 1% level in all cases. On the other hand, according to the results of the T1 and F1 test statistics, we only find significant asymmetric responses of jumps in Ripple to downside and upside jumps in Litecoin as well as of jumps in EOS to downside and upside jumps in Ripple and Litecoin. Yet, the F3 test results suggest asymmetries between the sum of the effects of upside and downside jumps and the sum of the effects of small and large jumps in almost all cases.
5.3. Practical implications
In this sub-section, we assess the practical implications of jumps in the cryptocurrencies considered in our study for portfolio management. From a practical perspective, we take the viewpoint of investors who are exposed to downside jump risk occurred in cryptocurrency markets and who are always aware of their portfolio performance. In particular, we assume that investors, who have a position in Bitcoin and are interested in including other cryptocurrencies in their portfolio either for investment or portfolio allocation, maintain an acceptable level of downside risk. The decision to include other cryptocurrencies is directly linked to performance and risk relative to the mandated benchmark. The findings discussed above indicate that the ‘bad’ component of volatility of the altcoins considered (i.e. Ether, Litecoin, Ripple, and EOS) are sensitive to downside jumps in Bitcoin raising the downside risk. For this reason, we investigate the performance of a portfolio comprising the five cryptocurrencies considered in this study (Bitcoin, Ether, Litecoin, Ripple, and EOS) by using the Sortino ratio as a measure. Specifically, we calculate the Sortino ratio as the average excess return relative to the downside deviation, presented in detail in Appendix B. Sortino and Price (Citation1994) showed that the Sortino ratio is a minimum acceptable return of the threshold (see Appendix B), where the portfolio produces unfavorable outcomes below the
threshold. As the risk is associated with unfavorable outcomes, returns below the
are associated with risk. The Sortino ratio is preferred on theoretical grounds as it measures risk in terms of underperformance relative to a predefined benchmark. In other words, the Sortino ratio allows us to calculate the risk adjusted return of a portfolio. Therefore, first, we apply the Sortino ratio to a portfolio consisting of the five cryptocurrencies considered in our study (Bitcoin, Ether, Litecoin, Ripple, and EOS). Second, we also apply the Sortino ratio in a rolling window of 365 days to our constructed portfolio. Third, we present our empirical results for optimal allocation.
Table reports the results of the Sortino ratio and the optimal weights of the cryptocurrencies to define the optimal portfolio consisting of the five cryptocurrencies. According to the results, the optimal portfolio is constructed with weights equal to 91.2% for Bitcoin, 1.0% for Ether, 2.2% for Litecoin, 4.5% for Ripple, and 1.1% for EOS. The optimal mean of the return is equal to 0.0019, with the Sortino ratio being equal to 0.0611, indicating that 6.11% of the portfolio consisting of these five cryptocurrencies should be on altcoins rather than Bitcoin, with an average return of 0.19%. The optimal portfolio weight for Bitcoin is thus remarkably high. These results therefore suggest that in portfolios consisting of cryptocurrencies, investors should hold mostly Bitcoin. This result is consistent with Katsiampa (Citation2019) who also found that the optimal proportion invested in Bitcoin should outweigh Ether but is in contrast with Mensi et al. (Citation2020) who found that investors should hold less Bitcoin than Ether, Litecoin, or Ripple. However, the low value of the Sortino ratio indicates the high downside deviation.
Table 8. Asset allocation based on the Sortino ratio.
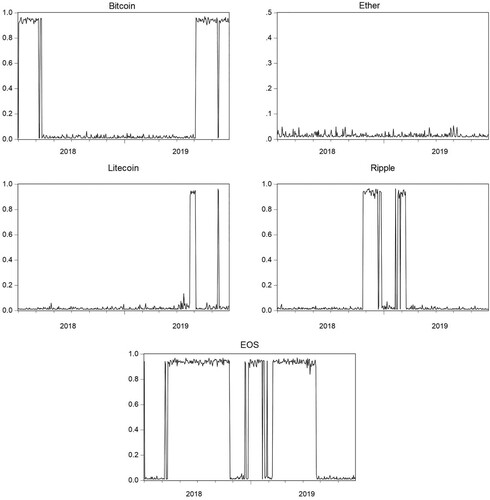
Finally, the Sortino ratio measures of the optimal portfolio consisting of the five cryptocurrencies considered in our study, i.e. the optimal mean and optimal Sortino ratio, are depicted in Figure in a rolling window of 365 days, while Figure illustrates the corresponding weights of the optimal portfolio of the five cryptocurrencies in our rolling window application, showing how the weights of the optimal portfolio change over the sample period. Jumps reflect a local source of non-diversifiable risk in volatility. Among others, it can be inferred that when cryptocurrencies’ jump frequency is increased (e.g. in the first part of our sample period), the portfolio weight for Bitcoin, which is the least risky cryptocurrency as shown in past studies (see, e.g. Gkillas and Katsiampa Citation2018), is remarkably high, taking its high performance during the beginning of our sample period into account. In contrast, Ripple’s weight exhibits remarkable increases at the end of 2018 and in the beginning of 2019 which, however, substantially drops when Ripple exhibits jumps. On the other hand, Ether’s weights remain rather stable.
Figure 2. Optimal mean and Sortino ratio in a rolling window.
Note: These Figures depict the optimal mean portfolio return and optimal Sortino ratio of the portfolio consisting of the five cryptocurrencies considered, namely Bitcoin, Ether, Litecoin, Ripple, and EOS, in a rolling window application for the period from 1st July 2018–30th June 2019 (365 observations).
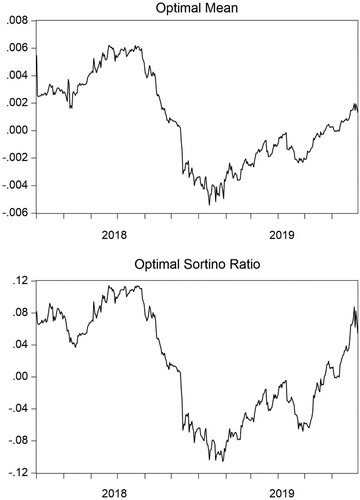
Figure 3. Weights of the optimal portfolio in a rolling window.
Note: This Figure depicts the weights of the optimal portfolio consisting of the five cryptocurrencies considered in our study, namely Bitcoin, Ether, Litecoin, Ripple, and EOS, in a rolling window application for the period from 1st July 2018–30th June 2019 (365 observations).
5.4. Further results
Finally, we extend our analysis by studying the impact of different types of jumps occurring in mainstream financial assets, and in particular in the S&P 500 equity index7, on the discontinuity component of the realized volatility of cryptocurrencies, given the growing interest in the relationship between cryptocurrencies and traditional financial markets in the literature (see, e.g. Baur, Hong, and Lee Citation2017; Bouri et al. Citation2018, Citation2020; Corbet et al. Citation2018, Citation2020; Dahir et al. Citation2020; Maghyereh and Abdoh Citation2020; Okorie and Lin Citation2020). The empirical results are reported in Table (Panel A).8
Table 9. Effects of jumps in the S&P 500 equity index on jumps in cryptocurrencies.
The results reveal that upside jumps in the S&P 500 index have a negative and statistically significant impact on the discontinuity component of the realized volatility of all five cryptocurrencies. Interestingly, the largest magnitude of the effects of upside jumps in the S&P 500 index is found for Ripple and the smallest for Bitcoin in absolute terms. Downside jumps in the S&P 500 index have similarly negative effects which are, however, significant only for Bitcoin, Ether, and EOS, with the largest magnitude in absolute terms being found for EOS and the smallest for Bitcoin. On the other hand, small (large) jumps in the S&P 500 index have positive (negative) effects but are significant only for Ripple (EOS). The above results improve our understanding of the relationship between cryptocurrencies and mainstream financial assets and are overall in accordance with Dahir et al. (Citation2020) who found that Bitcoin is a volatility receiver from equity markets. Our results are further in line with studies finding causality running from financial assets to cryptocurrencies during volatile periods (e.g. Corbet, Katsiampa, and Lau Citation2020; Maghyereh and Abdoh Citation2020) but in contrast with previous evidence that cryptocurrency markets are isolated from mainstream asset markets (e.g. Baur, Hong, and Lee Citation2017; Corbet et al. Citation2018; Bouri et al. Citation2020). Furthermore, co-jumps of the S&P 500 index with cryptocurrencies have a positive and significant at the 1% level impact on the discontinuity component of the realized volatility of all five cryptocurrencies, with the estimated effect ranging from 0.0006 (Bitcoin) to 0.0020 (EOS).
We further test for asymmetric effects of the different types of jumps in the S&P 500 index. The test results are also presented in Table (Panel B) and reveal statistically significant asymmetric responses of jumps in Ripple to the downside and upside jumps of the S&P 500 index (according to both the T1 and F1 tests) as well as significant asymmetric effects of small and large jumps occurring in the S&P 500 index on the discontinuity component of the realized volatility of Ripple and EOS (according to both the T2 and F2 tests). Nonetheless, we find significant asymmetries between the sum of the effects of upside and downside jumps and the sum of the effects of small and large jumps in the S&P 500 index for all cryptocurrencies except for Litecoin, as shown by the F3 test results.
6. Conclusions
Analyzing the jumping behavior of financial assets has recently received substantial attention from academics and practitioners alike due to their implications for portfolio and risk management. In this paper, we shed light on the type of jumps that affect cryptocurrency markets during periods of large price movements. Compared to mainstream financial assets, cryptocurrency markets exhibit very high volatility levels, which are of primary concern to investors who are interested in including cryptocurrencies in their portfolios. To this end, we proposed a novel model to capture the asymmetric effects of jumps due to high volatility levels observed in cryptocurrencies. By considering five major cryptocurrencies, namely Bitcoin, Ether, Ripple, Litecoin, and EOS, we quantified the effects of total jumps, downside and upside jumps, and large and small jumps observed in each cryptocurrency on the discontinuity component of the realized volatility of the other cryptocurrencies, and detected directional predictability of the different types of jumps to the jump component of the realized volatility of the cryptocurrencies considered.
The results revealed that overall downside, upside, and small jumps occurring in each cryptocurrency negatively impact the discontinuity component of the realized volatility of other cryptocurrencies, whereas large jumps have the opposite effect. With regard to the magnitude of the various types of jumps, we confirmed the existence of asymmetric effects between small and large as well as between downside and upside jumps occurring in Bitcoin on discontinuities of the four altcoins. We further confirmed the existence of asymmetric effects between downside and upside jumps occurring in the four altcoins on Bitcoin jumps, and between small and large jumps in each altcoin on discontinuities of other altcoins. Moreover, in line with Bouri, Roubaud, and Shahzad (Citation2020), we found evidence of co-jumping behavior between the considered cryptocurrencies, but our results also suggested that this co-jumping behavior can trigger future jumps. We further assessed the practical implications of jumps in cryptocurrencies for portfolio management using the Sortino optimization method, and found that in portfolios consisting of the five cryptocurrencies considered in our study, investors should hold mainly Bitcoin, whereas less than ten percent of the portfolio should consist of altcoins. Finally, we explored the impact of various jumps occurring in the S&P 500 index on the discontinuity component of the realized volatility of cryptocurrencies and found that upside and downside jumps observed in the S&P 500 index negatively impact cryptocurrency jumps.
The findings of this study provided evidence not only of the various types of jumps existing in cryptocurrencies’ behavior but also of their significant impact on other cryptocurrencies’ jumping behavior, highlighting the importance of the inclusion of jumps when modeling volatility in cryptocurrency markets, as consistent with past studies signifying that the inclusion of jumps improves volatility measuring in conventional financial markets (e.g. Duffie, Pan, and Singleton Citation2000; Eraker, Johannes, and Polson Citation2003; Broadie, Chernov, and Johannes Citation2007). Our findings further suggest the importance of also integrating co-jumps when modeling cryptocurrencies’ volatility dynamics. Our results add to our understanding of interdependencies of cryptocurrency markets, which are of high importance to cryptocurrency traders, investors, and risk managers, as they indicate reduced diversification benefits. These findings could further have implications in terms of asset pricing, option, and volatility modeling (Bouri et al. Citation2020). It would be interesting to extend this research by investigating the impact of downside, upside, small, and large jumps occurring in other financial markets, such as the gold or oil market, in the jumping behavior of cryptocurrencies in the future.
REJF_2015416_Supplementary Material
Download MS Word (30.9 KB)Disclosure statement
No potential conflict of interest was reported by the authors).
Additional information
Notes on contributors
Konstantinos Gkillas
Dr Konstantinos Gkillas (Gillas) is a Research Fellow at the Department of Management Science and Technology of the University of Patras, Greece, and a Teaching Fellow at the Department of Management Science and Technology of the University of Patras and at the School of Social Science of the Hellenic Open University. He holds a Ph.D. in Quantitative Economics and his research interests include computational statistics, digital finance, economic analysis, extreme value theory, financial econometrics, quantitative economics, risk management, volatility, and times series analysis. His research has been published in several peer-reviewed international journals.
Paraskevi Katsiampa
Dr Paraskevi Katsiampa is a Lecturer in Financial Management at the Sheffield University Management School, UK. She holds a PhD in Economics and her research interests include financial econometrics, financial markets, spillover effects, digital finance, and FinTech, among others.
Christoforos Konstantatos
Dr Christoforos Konstantatos is an Adjunct Lecturer at the Department of Business Administration of the University of Patras, Greece. He holds a PhD in Finance and his research interests focus on systemic risk, financial economics, and economic analysis.
Athanasios Tsagkanos
Dr Athanasios Tsagkanos is an Assοciate Professor at the Department of Business Administration of University of Patras, Greece. He holds a PhD in Finance and Econometrics. His research interests relate to financial management, quantitative methods, and applied economics. He has published in several peer-reviewed international journals.
Notes
1 While in May 2013 Bitcoin represented about 94% of the total estimated market capitalization, its market share dropped to 33% in January 2018 (coinmarketca.com accessed on 20th January 2021) as a result of the increase in popularity and, thus, in market capitalization of altcoins.
2 It should be noted that Bouri, Roubaud, and Shahzad (Citation2020) found evidence of co-jumping behavior in cryptocurrencies’ returns by using parametric models and daily closing price data. In contrast, we examine whether co-jumps can trigger future jumps using a non-parametric approach to estimate volatility, and in our study jumps and co-jumps are constructed from intraday (hourly) price data. The rationale for using a non-parametric approach lies in the fact that, given that volatility is latent (as discussed in the introduction), any non-parametric estimator of quadratic variation is regarded as the best estimator of latent volatility (Barndorff-Nielsen and Shephardet al., Citation2002). Furthermore, intraday data are considered to be superior to daily data, as they reveal important information about the market, such as intraday changes and market microstructures, not easily captured at the daily frequency (see Hansen and Huang Citation2016, among others).
3 A detailed discussion of the detection and construction of the various types of jumps (i.e., (i) total jumps; (ii) downside, upside, and asymmetric jumps; and (iii) large and small jumps) used in Equation 1 is presented in Appendix A.
4 The data was retrieved from Coindatabase and cross-checked using several data sources, including Bloomberg.
5 More specifically, Panel A of Tables 4-7 present the estimated effects on the jump behavior of Ether, Ripple, Litecoin, and EOS, respectively, of the various types of jumps occurring in other altcoins.
6 More specifically, Panel B of Tables 4-7 present the test results for asymmetric responses of jumps in Ether, Ripple, Litecoin, and EOS, respectively, to jumps in other altcoins.
7 For consistency, we collected data on the S&P 500 index at the hourly frequency over the same period, i.e., from 1st July 2017 to 30th June 2019, and used the data corresponding to trading times in both markets (see, e.g., Gençay et al.., Citation2001). Hourly data on the S&P 500 index was collected from https://pitrading.com/historical-data.html. Pi Trading is a leading provider of historical intraday data products for professional traders and institutions, providing high quality and reliable data. More information can be found https://pitrading.com/historical-data.html.
8 It should be noted that the results of the LASSO regressions which were first performed indicated to drop the realized correlation as a regressor in this case. This was supported by statistically insignificant estimates on the realized correlation when including it in our asymmetric jump model for studying the effects of jumps in the S&P 500 index on cryptocurrencies. For the above reasons, the realized correlation has now been excluded from the estimated models.
9 The intensity and magnitude of volatility jumps did not significantly change when a 99% significance level was employed.
10 For more details about upside and downside jumps, see Duong and Swanson (Citation2015).
References
- Andersen, T. G., T. Bollerslev, F. X. Diebold, and P. Labys. 2003. “Modeling and Forecasting Realized Volatility.” Econometrica 71 (2): 579–625. http://doi.wiley.com/10.1111/1468-0262.00418.
- Andersen, T. G., T. Bollerslev, F. X. Diebold, and C. Vega. 2007. “Real-Time Price Discovery in Global Stock, Bond and Foreign Exchange Markets.” Journal of International Economics 73 (2): 251–277. https://www.sciencedirect.com/science/article/pii/S0022199607000608.
- Andersen, T. G., D. Dobrev, and E. Schaumburg. 2012. “Jump-Robust Volatility Estimation Using Nearest Neighbor Truncation.” Journal of Econometrics 169 (1): 75–93.
- Apergis, N., and S. M. Miller. 2006. “Consumption Asymmetry and the Stock Market: Empirical Evidence.” Economics Letters 93 (3): 337–342.
- Bakshi, G., and G. Panayotov. 2010. “First-passage Probability, Jump Models, and Intra-Horizon Risk.” Journal of Financial Economics 95 (1): 20–40.
- Barndorff-Nielsen, Ole E., S. Kinnebrock, and N. Shephard. 2010. “Measuring downside risk-realised semivariance.” Unpublished Working Paper. University of Aarhus and University of Oxford.
- Barndorff-Nielsen, Ole E., and N. Shephard. 2002. “Estimating Quadratic Variation Using Realized Variance.” Journal of Applied Econometrics 17 (5): 457–477.
- Barndorff-Nielsen, Ole E., and N. Shephard. 2004. “Econometric Analysis of Realized Covariation: High Frequency Based Covariance, Regression, and Correlation in Financial Economics.” Econometrica 72 (3): 885–925.
- Barndorff-Nielsen, Ole E, and N. Shephard. 2006. “Econometrics of Testing for Jumps in Financial Economics Using Bipower Variation.” Journal of Financial Econometrics 4 (1): 1–30. https://academic.oup.com/jfec/article-lookup/doi/10.1093/jjfinec/nbi022.
- Bates, D. S. 2000. “Post-'87 Crash Fears in the S&P 500 Futures Option Market.” Journal of Econometrics 94 (1-2): 181–238.
- Baur, D. G., and T. Dimpfl. 2021. “The Volatility of Bitcoin and Its Role as a Medium of Exchange and a Store of Value.” Empirical Economics 61: 2663–2683.
- Baur, D. G., K. Hong, and A. D. Lee. 2017. “Bitcoin: Medium of Exchange or Speculative Assets?” Journal of International Financial Markets, Institutions and Money 54: 177–189.
- Bauwens, L., C. Hafner, and S. Laurent. 2012. Handbook of Volatility Models and Their Applications. Hoboken: Wiley.
- Bollerslev, T. 1986. “Generalized Autoregressive Conditional Heteroskedasticity - ScienceDirect.” Journal of Econometrics 31 (3): 307–327. https://www.sciencedirect.com/science/article/pii/0304407686900631.
- Bouri, E., M. Das, R. Gupta, and D. Roubaud. 2018. “Spillovers Between Bitcoin and Other Assets During Bear and Bull Markets.” Applied Economics 50 (55): 5935–5949.
- Bouri, E., L. A. Gil-Alana, R. Gupta, and D. Roubaud. 2019. “Modelling Long Memory Volatility in the Bitcoin Market: Evidence of Persistence and Structural Breaks.” International Journal of Finance and Economics 24 (1): 412–426.
- Bouri, E., D. Roubaud, and S. J. H. Shahzad. 2020. “Do Bitcoin and Other Cryptocurrencies Jump Together?” The Quarterly Review of Economics and Finance 76: 396–409.
- Bouri, E., S. J. H. Shahzad, D. Roubaud, L. Kristoufek, and B. Lucey. 2020. “Bitcoin, Gold, and Commodities as Safe Havens for Stocks: New Insight Through Wavelet Analysis.” The Quarterly Review of Economics and Finance 77: 156–164. doi:https://doi.org/10.1016/J.QREF.2020.03.004.
- Broadie, M., M. Chernov, and M. Johannes. 2007. “Model Specification and Risk Premia: Evidence from Futures Options.” The Journal of Finance 62 (3): 1453–1490. http://doi.wiley.com/10.1111/j.1540-6261.2007.01241.x.
- Caporale, G. M., L. Gil-Alana, and A. Plastun. 2017. “Persistence in the Cryptocurrency Market.” Research in International Business and Finance 46: 141–148.
- Caporin, M., E. Rossi, and P. S. D. Magistris. 2015. “Volatility Jumps and Their Economic Determinants.” Journal of Financial Econometrics 14 (1): 29–80.
- Chaim, P., and M. P. Laurini. 2018. “Volatility and Return Jumps in Bitcoin.” Economics Letters 173: 158–163.
- Cheah, E. T., and J. Fry. 2015. “Speculative Bubbles in Bitcoin Markets? An Empirical Investigation Into the Fundamental Value of Bitcoin.” Economics Letters 130: 32–36. https://www.sciencedirect.com/science/article/pii/S0165176515000890.
- Christensen, K., R. C. Oomen, and M. Podolskij. 2014. “Fact or Friction: Jumps at Ultra High Frequency.” Journal of Financial Economics 114 (3): 576–599.
- Clements, A., and Y. Liao. 2017. “Forecasting the Variance of Stock Index Returns Using Jumps and Cojumps..” International Journal of Forecasting 33 (3): 729–742.
- Corbet, S., P. Katsiampa, and C. K. M. Lau. 2020. “Measuring Quantile Dependence and Testing Directional Predictability Between Bitcoin, Altcoins and Traditional Financial Assets.” International Review of Financial Analysis 71: 101571.
- Corbet, S., B. Lucey, A. Urquhart, and L. Yarovaya. 2019. “Cryptocurrencies as a Financial Asset: A Systematic Analysis.” International Review of Financial Analysis 62: 182–199. doi:https://doi.org/10.1016/J.IRFA.2018.09.003.
- Corbet, S., A. Meegan, C. Larkin, B. Lucey, and L. Yarovaya. 2018. “Exploring the Dynamic Relationships Between Cryptocurrencies and Other Financial Assets.” Economics Letters 165: 28–34. https://www.sciencedirect.com/science/article/pii/S0165176518300041?via%3Dihub.
- Corsi, F., S. Mittnik, C. Pigorsch, and U. Pigorsch. 2008. “The Volatility of Realized Volatility.” Econometric Reviews 27 (1–3): 46–78. http://www.tandfonline.com/doi/abs/10.1080/07474930701853616.
- Corsi, F., D. Pirino, and R. Renò. 2010. “Threshold Bipower Variation and the Impact of Jumps on Volatility Forecasting.” Journal of Econometrics 159 (2): 276–288.
- Corsi, F., and R. Renò. 2009. “HAR volatility modelling with heterogeneous leverage and jumps.” Available at SSRN 1316953.
- Cretarola, A., and G. Figà-Talamanca. 2021. “Detecting Bubbles in Bitcoin Price Dynamics via Market Exuberance.” Annals of Operations Research 299 (1): 459–479.
- Da Fonseca, J., and K. Ignatieva. 2019. “Jump Activity Analysis for Affine Jump-Diffusion Models: Evidence from the Commodity Market.” Journal of Banking & Finance 99: 45–62.
- Dahir, A. M., F. Mahat, B. A. Amin Noordin, and N. Hisyam Ab Razak. 2020. “Dynamic Connectedness Between Bitcoin and Equity Market Information Across BRICS Countries: Evidence from TVP-VAR Connectedness Approach.” International Journal of Managerial Finance 16 (3): 357–371. doi:https://doi.org/10.1108/IJMF-03-2019-0117.
- Driessen, J., and P. Maenhout. 2013. “The World Price of Jump and Volatility Risk.” Journal of Banking & Finance 37 (2): 518–536.
- Duffie, D., J. Pan, and K. Singleton. 2000. “Transform Analysis and Asset Pricing for Affine Jump-Diffusions.” Econometrica 68 (6): 1343–1376. http://doi.wiley.com/10.1111/1468-0262.00164.
- Duong, D., and N. R. Swanson. 2011. “Volatility in Discrete and Continuous-Time Models: A Survey with New Evidence on Large and Small Jumps.” In, 179–233. http://www.emeraldinsight.com/doi/10.1108/S0731-9053%282011%29000027B006.
- Duong, D., and N. R. Swanson. 2015. “Empirical Evidence on the Importance of Aggregation, Asymmetry, and Jumps for Volatility Prediction.” Journal of Econometrics 187 (2): 606–621. https://www.sciencedirect.com/science/article/pii/S0304407615000676.
- Eraker, B. 2004. “Do Stock Prices and Volatility Jump? Reconciling Evidence from Spot and Option Prices.” The Journal of Finance 59 (3): 1367–1403.
- Eraker, B., M. Johannes, and N. Polson. 2003. “The Impact of Jumps in Volatility and Returns.” The Journal of Finance 58 (3): 1269–1300. http://doi.wiley.com/10.1111/1540-6261.00566.
- Evans, K. P. 2011. “Intraday Jumps and US Macroeconomic News Announcements.” Journal of Banking & Finance 35 (10): 2511–2527.
- Fry, J. 2018. “Booms, Busts and Heavy-Tails: The Story of Bitcoin and Cryptocurrency Markets?” Economics Letters 171: 225–229.
- Fry, J., and E. T. Cheah. 2016. “Negative Bubbles and Shocks in Cryptocurrency Markets.” International Review of Financial Analysis 47: 343–352.
- Gencay, R., M. M. Dacorogna, U. Miller, R. B. Olsen, and O. B. Pictet. 2001. An Introduction To High-Frequency Finance. London: Academic Press.
- Giot, P., S. Laurent, and M. Petitjean. 2010. “Trading Activity, Realized Volatility and Jumps.” Journal of Empirical Finance 17 (1): 168–175. https://www.sciencedirect.com/science/article/pii/S0927539809000437.
- Gkillas, K., and P. Katsiampa. 2018. “An Application of Extreme Value Theory to Cryptocurrencies.” Economics Letters 164: 109–111. https://www.sciencedirect.com/science/article/pii/S0165176518300284.
- Gkillas, K., and F. Longin. 2018. “Is Bitcoin the New Digital Gold? Evidence from Extreme Price Movements in Financial Markets.” SSRN Electronic Journal, doi:https://doi.org/10.2139/ssrn.3245571.
- Granger, C. W. J. 2008. “In Praise of Pragmatic Econometrics.” In The Methodology and Practice of Econometrics: A Festschrift in Honour of David F Hendry, edited by J. L. Castle and N. Shephard, 255–267. New York: Oxford University Press.
- Gronwald, M. 2019. “Is Bitcoin a Commodity? On Price Jumps, Demand Shocks, and Certainty of Supply.” Journal of International Money and Finance 97: 86–92.
- Hansen, P. R., and Z. Huang. 2016. “Exponential GARCH Modeling With Realized Measures of Volatility.” Journal of Business & Economic Statistics 34 (2): 269–287. doi:https://doi.org/10.1080/07350015.2015.1038543.
- Hansen, P. R., and A. Lunde. 2006. “Realized Variance and Market Microstructure Noise.” Journal of Business & Economic Statistics 24 (2): 127–161. doi:https://doi.org/10.1198/073500106000000071.
- Hu, J., W. K. Härdle, and W. Kuo. 2019. “Risk of Bitcoin Market: Volatility, Jumps, and Forecasts.” arXiv preprint arXiv:1912.05228.
- Huang, X., and G. Tauchen. 2005. “The Relative Contribution of Jumps to Total Price Variance.” Journal of Financial Econometrics 3 (4): 456–499. https://academic.oup.com/jfec/article-lookup/doi/10.1093/jjfinec/nbi025.
- Hung, J. C., H. C. Liu, and J. J. Yang. 2020. “Improving the Realized GARCH’s Volatility Forecast for Bitcoin with Jump-Robust Estimators.” The North American Journal of Economics and Finance 52: 101165.
- Ji, Q., E. Bouri, C. K. M. Lau, and D. Roubaud. 2019. “Dynamic Connectedness and Integration in Cryptocurrency Markets.” International Review of Financial Analysis 63: 257–272. doi:https://doi.org/10.1016/J.IRFA.2018.12.002.
- Katsiampa, P. 2017. “Volatility Estimation for Bitcoin: A Comparison of GARCH Models.” Economics Letters 158: 3–6.
- Katsiampa, P. 2019. “Volatility co-Movement Between Bitcoin and Ether.” Finance Research Letters 30: 221–227.
- Katsiampa, P., S. Corbet, and B. Lucey. 2019a. “High Frequency Volatility co-Movements in Cryptocurrency Markets.” Journal of International Financial Markets, Institutions and Money 62: 35–52.
- Katsiampa, P., S. Corbet, and B. Lucey. 2019b. “Volatility Spillover Effects in Leading Cryptocurrencies: A BEKK-MGARCH Analysis.” Finance Research Letters 29: 68–74.
- Katsiampa, P., L. Yarovaya, and D. Zięba. 2021. “High-Frequency Connectedness between Bitcoin and Other Top-Traded Crypto Assets during the COVID-19 Crisis.” Available at SSRN 3871405.
- Koulakiotis, A., A. Kiohos, and V. Babalos. 2015. “Exploring the Interaction Between Stock Price Index and Exchange Rates: an Asymmetric Threshold Approach.” Applied Economics 47 (13): 1273–1285.
- Latané, Henry A., and Richard J. Rendleman. 1976. “Standard Deviations of Stock Price Ratios Implied in Option Prices.” The Journal of Finance 31 (2): 369–381. doi:https://doi.org/10.1111/j.1540-6261.1976.tb01892.x.
- Maghyereh, A., and H. Abdoh. 2020. “Tail Dependence Between Bitcoin and Financial Assets: Evidence from a Quantile Cross-Spectral Approach.” International Review of Financial Analysis 71: 101545.
- Mensi, W., K. H. Al-Yahyaee, I. M. W. Al-Jarrah, X. V. Vo, and S. H. Kang. 2020. “Dynamic Volatility Transmission and Portfolio Management Across Major Cryptocurrencies: Evidence from Hourly Data.” The North American Journal of Economics and Finance 54: 101285.
- Mensi, W., K. H. Al-Yahyaee, I. M. Wanas Al-Jarrah, X. V. Vo, and S. H. Kang. 2021. “Does Volatility Connectedness Across Major Cryptocurrencies Behave the Same at Different Frequencies? A Portfolio Risk Analysis.” International Review of Economics & Finance 76: 96–113. doi:https://doi.org/10.1016/J.IREF.2021.05.009.
- Merton, R. C. 1976. “The Impact on Option Pricing of Specification Error in the Underlying Stock Price Returns.” The Journal of Finance 31 (2): 333–350.
- Okorie, D. I., and B. Lin. 2020. “Crude oil Price and Cryptocurrencies: Evidence of Volatility Connectedness and Hedging Strategy.” Energy Economics 87: 104703. doi:https://doi.org/10.1016/J.ENECO.2020.104703.
- Osterrieder, J., and J. Lorenz. 2017. “A Statistical Risk Assessment of Bitcoin and Its Extreme Tail Behavior.” Annals of Financial Economics 12 (01): 1750003. http://www.worldscientific.com/doi/abs/10.1142/S2010495217500038.
- Patton, A. J., and K. Sheppard. 2015. “Good Volatility, Bad Volatility: Signed Jumps and The Persistence of Volatility.” Review of Economics and Statistics 97 (3): 683–697. http://www.mitpressjournals.org/doi/10.1162/REST_a_00503.
- Phillip, A., J. Chan, and S. Peiris. 2018. “A New Look at Cryptocurrencies.” Economics Letters 163: 6–9. https://www.sciencedirect.com/science/article/pii/S0165176517304731.
- Poon, S. H., and C. W. J. Granger. 2003. “Forecasting Volatility in Financial Markets: A Review.” Journal of Economic Literature 41 (2): 478–539. http://pubs.aeaweb.org/doi/abs/10.1257/002205103765762743.
- Scaillet, O., A. Treccani, and C. Trevisan. 2020. “High-frequency Jump Analysis of the Bitcoin Market.” Journal of Financial Econometrics 18 (2): 209–232.
- Schwartz, Eduardo S. 1997. “The Stochastic Behavior of Commodity Prices: Implications for Valuation and Hedging.” The Journal of Finance 52 (3): 923–973. doi:https://doi.org/10.1111/j.1540-6261.1997.tb02721.x.
- Selgin, G. 2015. “Synthetic Commodity Money.” Journal of Financial Stability 17: 92–99. https://www.sciencedirect.com/science/article/pii/S1572308914000722 (April 18, 2019).
- Shen, D., A. Urquhart, and P. Wang. 2020. “Forecasting the Volatility of Bitcoin: The Importance of Jumps and Structural Breaks.” European Financial Management 26 (5): 1294–1323.
- Sortino, F. A., and L. N. Price. 1994. “Performance Measurement in a Downside Risk Framework.” The Journal of Investing 3: 59–64. doi:https://doi.org/10.3905/joi.3.3.59.
- Sun, Y. 2006. “Best Quadratic Unbiased Estimators of Integrated Variance in the Presence of Market Microstructure Noise.” SSRN Electronic Journal. doi:https://doi.org/10.2139/SSRN.1714751.
- Wang, J. N., H. C. Liu, S. M. Chiang, and Y. T. Hsu. 2019. “On the Predictive Power of ARJI Volatility Forecasts for Bitcoin.” Applied Economics 51 (44): 4849–4855.
- Wang, J., and G. M. Ngene. 2020. “Does Bitcoin Still own the Dominant Power? An Intraday Analysis.” International Review of Financial Analysis 71: 101551.
- Yi, S., Z. Xu, and G. J. Wang. 2018. “Volatility Connectedness in the Cryptocurrency Market: Is Bitcoin a Dominant Cryptocurrency?” International Review of Financial Analysis 60: 98–114.
- Yu, M. 2019. “Forecasting Bitcoin Volatility: The Role of Leverage Effect and Uncertainty.” Physica A: Statistical Mechanics and Its Applications 533: 120707.
Appendices
Appendix A. Jump detection and calculation
In this Appendix, we describe in detail the methodology followed to detect the jumps in cryptocurrency prices. The detection of jumps is deemed to be necessary, prior to constructing the realized measures of continuous and jump components of a price process. First, we therefore discuss the jump detection scheme employed in this study. We then describe the framework for detecting large and small jumps as well as upside and downside jumps. Finally, we discuss the method used to construct measures of realized correlation.
Jump detection
We assume that the logarithmic price, , of a cryptocurrency at time
follows a general jump-diffusion process which is formed as
(A1)
(A1) where
denotes the drift term with a continuous variation sample path,
is the stochastic volatility process which is strictly positive with a sample path that is right continuous and exhibits well-defined left limits (permitting for occasional jumps in volatility),
denotes the driving standard Brownian motion, whereas the last part,
, is associated with the jumpy part in the price process, representing the random jump size, with
. In our study, we take a complementary non-parametric approach, squarely in the tradition of the realized volatility literature but specifically distinguishing jump from non-jump movements, relying on both the recent emergence of high-frequency data and the powerful asymptotic theory.
For a discrete price process, the volatility on a given day is not an unbiased estimator of integrated volatility, since it includes the jump variation. The return volatility is constructed by Quadratic Variation (QV) as follows
(A2)
(A2) where
and
represent the continuous and jump variations, respectively, in the
interval. The price increments can be distinguished between jumps and continuous price movements, and the jump variation can be computed as the difference between the total variation, which can be estimated by the realized volatility
, and the total variation due to continuous price movements (also called integrated variance).
We thus start by computing the realized volatility series. In our study, we employ hourly price returns to estimate the daily realized volatility series by summing up all successive intraday squared returns, as follows
(A3)
(A3) where
is the hourly price return within day
, calculated as the difference between two consecutive logarithmic hourly prices, with
, and
referring to the total number of intraday returns on any given day
, resulting from
hourly prices. The realized volatility,
, is a consistent estimator of quadratic variation,
, as
, and is considered to be the best estimator of integrated (latent) volatility
(A4)
(A4) On the other hand, there are several estimators of the total variation due to continuous price (jump-robust) movements in the existing literature. The study of Barndorff-Nielsen and Shephard (Citation2006) was one of the first contributors in this regard that developed the bi-power variation. Following Barndorff-Nielsen and Shephard (Citation2006), we therefore employ the bi-power variation (
), which is given as follows
(A5)
(A5) where
stands for the absolute value of the mean of a standard normally distributed random variable Z. Furthermore, Barndorff-Nielsen and Shephard (Citation2006) introduced the jump detection scheme based on bi-power variation and the adjusted jump ratio statistic of Huang and Tauchen (Citation2005). In our study, following Andersen et al. (Citation2007), we estimate the jump ratio statistic
as follows
(A6)
(A6) where
is the total number of intraday returns per day, and
is the realized tri-power quarticity, which is an asymptotically unbiased estimator of integrated quarticity in the absence of microstructure noise, given as
. The
jump ratio statistic follows the standard normal distribution (
), as
. The
jump ratio statistic is also used as a pre-test, testing the null hypothesis of no jumps against the alternative hypothesis of existence of jumps. Thus, a jump is considered to be significant when the test statistic exceeds the critical value of the standard normal distribution, denoted by
at the
level of significance. In our study, we employ the 95% confidence level.9 The (total) jump component is given by
(A7)
(A7) where
is the indicator function of the
jump ratio statistic exceeding the given critical value of the standard normal distribution
. Under the null hypothesis of non-existence of jumps, the difference between the estimators of variation of the continuous component and the quadratic variation should therefore be close to 0.
Large and small jumps
Following Duong and Swanson (Citation2015), we estimate the large and small jump variations using a decomposition based on a fixed truncation level (). The realized measure of truncated large jump variation,
, based on the jump detection scheme we apply, is given by
(A8)
(A8) while the realized measure of truncated small jump variation,
, based on the employed jump detection scheme, is calculated as
(A9)
(A9)
Upside and downside jumps
Duong and Swanson (Citation2011) further introduced upside and downside
jumps as
(A10)
(A10) and
(A11)
(A11) respectively, where
is the asymmetry variable affecting the limiting behavior of the estimator.10 In our study, we also consider upside and downside jumps and, similar to Duong and Swanson (Citation2011), we set
equal to
to improve the statistical significance of the coefficients, as opposed to, e.g.
= 5. The asymmetric jump
is then computed as follows
(A12)
(A12)
Realized correlation estimation
In our study we further account for the impact of the realized correlation between cryptocurrencies’ intraday returns. Following Barndorff-Nielsen and Shephard (Citation2004), we employ a theoretically consistent approximation of realized correlation (), calculated as
(A13)
(A13) where
and
are the realized variances of cryptocurrencies
and
, respectively, while
is the realized covariance estimated using the realized covariance estimator developed by Barndorff-Nielsen and Shephard (Citation2004), calculated as
(A14)
(A14) where
and
are the intraday (hourly) returns for hour
within day
for cryptocurrencies
and
, respectively.
Appendix B. Sortino optimization process
In this Appendix, we describe the Sortino portfolio optimization method which we apply to optimize the portfolio consisting of different cryptocurrencies.
The th order lower partial moment (LPM) for discrete data is calculated as follows
(B1)
(B1) where
is some given threshold,
is the number of daily returns, and
is the portfolio’s return on day
. The LMP is a type of risk measure that encompasses many different cases; one of them is the downside deviation risk measure used in the Sortino ratio. The downside deviation (DD) assumes that in Equation (B1) m = 2 and the threshold is equal to the minimum acceptable return (
), i.e.
, in which any return below the
gives an unfavorable outcome, and vice versa. In our analysis, we use
. Thus, the DD is given by
(B2)
(B2) In our study, the benchmark is assumed to be a passive portfolio of securities that should be mandated to exceed. Considering that excess return (a) is defined as the return of a given portfolio minus a benchmark (or
), the benchmark is equal to zero (
), since a positive a implies that portfolio is outperforming the mandated passive benchmarks. Therefore, we can formally define the Sortino ratio as follows
(B3)
(B3) where SR is the Sortino ratio, and
is the average return above the benchmark of a passive portfolio.