
 ?Mathematical formulae have been encoded as MathML and are displayed in this HTML version using MathJax in order to improve their display. Uncheck the box to turn MathJax off. This feature requires Javascript. Click on a formula to zoom.
Abstract
In a context of market volatility, the growing complexity of financial products, and a shift towards self-employment, there is an increasing demand for inclusive financial services for sole traders and micro-organizations. To address this need, we conducted a study using real-time data from a Fintech lender in the Czech Republic to assess the effectiveness of a new financial literacy based psychometric credit scoring model (PSM) in improving access to finance for micro, small and medium sized enterprises (MSME) sector, particularly sole traders, and micro-organizations, during volatile market conditions. This study affirms that PSMs play a significant role in responsibly including this underserved sector. Specifically, we observed a 30% higher approval rate and a 23% lower default rate when utilizing the PSM versus the traditional credit scoring model (TCSM). Moreover, during the period of substantial market volatility and instability, such as the state-of-emergency during the COVID-19 pandemic, the PSM exhibited a 13% higher approval rate at a 20% lower default rate than the TCSM. This evidence supports the proposition that PSMs offer a viable option for promoting financial inclusion and targeted financial education among MSMEs in the face of instable financial markets.
1. Introduction
Micro, small and medium-sized enterprises (MSMEs) play an exclusive role and prominence in the world economy, wherein global prosperity is anchored on the continued growth of a thriving MSME sector (Rao et al. Citation2023). The Organization for Economic Cooperation and Development (OECD) categorizes MSMEs into micro-enterprises, including sole traders or self-employed (fewer than 10 employees), small enterprises (10–49 employees) and medium-sized enterprises (50–249 employees) (OECD Citation2023). Moreover, MSMEs can provide substantial contributions toward the United Nations Sustainable Development Goals (SDGs) through employment generation, sustainable industrialization, innovation nurturing, and income disparity reduction (Šebestová and Sroka Citation2020). SDGs are crucial aspirations and endeavours while sustaining MSMEs and improving their financial performance (Bartolacci, Caputo, and Soverchia Citation2020). Likewise, MSMEs constitute 90% of the world’s economy and create 60–70% of employment and 55% of GDP and drive inclusion, which highlights MSMEs continued importance as drivers of economic growth and development now, and in the future (The World Trade Report Citation2016; Citation2023, 63, 66). Despite these statistical reports and contributions, MSMEs face multiple challenges and constraints to survive during periods of volatility (The World Trade Report Citation2023, 66). Extant literature reveals that access to finance is one of the most, if not the most, pressing issue that currently hinders MSMEs growth trajectories (Ang Citation1991, Citation1992; Baker and Judge Citation2020; Carpenter and Petersen Citation2002; Chittenden, Hall, and Hutchinson Citation1996; Gibson Citation1992; Guariglia, Liu, and Song Citation2011; Gupta and Barua Citation2018; Hall and Hutchinson Citation1993; Hamilton and Fox Citation1998; Hughes Citation1997; Hutchinson and Xavier Citation2006; Jordan, Lowe, and Taylor Citation1998; Lopez-Gracia and Aybar-Arias Citation2000; Moscalu, Girardone, and Calabrese Citation2020; Rao et al. Citation2023; Robson and Bennett Citation2000).
In addition, the digital transformation of financial services via digital technologies (machine learning and artificial intelligence) can be leveraged to help increase financial access and broaden inclusion. For instance, Open Banking (OB) tools via Application Programming Interfaces (APIs) enable data sharing and functionality to literally ‘open’ the marketplace and increase consumers and entrepreneurs’ ability to compare and select preferred product and service offers (e.g. OECD Citation2023). McKinsey (Citation2017) espouse that OB may facilitate benefits and encourage sustainable service models, particularly for underserved markets, such as MSMEs (Long et al. Citation2020).
The range of OB data sources moves beyond banking data to public data – images from satellites, company data, social media, and messenger services. Thus, interactional big datasets permit creating an arbitrary profile of the consumer using artificial intelligence (AI) (Mhlanga Citation2021). These profiles assist lenders in assessing the general behaviours of applicants and verify the probability of potential borrowers defaulting on a loan repayment, in essence reducing the lender’s risk in granting loans (Biallas and O'Neill Citation2020). Research supports OB-based payment models (Rishabh Citation2022); mobile phone data (Liu et al. Citation2017; Óskarsdóttir et al. Citation2019; San Pedro, Proserpio, and Oliver Citation2015; Shema Citation2019) and social media data (Tan and Phan Citation2018; Wei et al. Citation2016; Yuan et al. Citation2018; Zhang et al. Citation2016) in producing higher predictive credit performance and repayment likelihood compared to traditional credit scoring models (TCSMs).
This obvious, but overlooked data emanates from established psychometric models, affording insights into an individual’s skills, abilities, personality traits, attributes, competencies, and intelligence levels. Such attributes have been linked to predicting human behaviour – crucial in assessing credit worthiness and predicting default behaviours which could lead to an accrual of arrears for lenders, therefore, predicting an applicant’s propensity to default on repayments (Aitken Citation2017; Arráiz, Bruhn, and Stucchi Citation2017; Djeundje et al. Citation2021; Goel and Rastogi Citation2023). The use of psychometric data to predict financial behaviour, is not new, however, a holistic but granular financial behavioural approach for responsible lending to MSMEs during period of market instability is missing (Bernards Citation2019).
Small businesses face a liability of ‘smallness’, thus, when crises create volatility and unstable market conditions, resource, and liquidity contracts to stifle MSMEs access to finance and therefore, growth (Eggers Citation2020). The situation is compounded by consumer market contraction as spending reduces, and financiers become more risk averse in their investment and lending protocols (Eggers Citation2020). For example, the lingering effects of the global financial crisis 2008–2009, combined with persistent financial instability and emergent economic crises, diffused risk in credit markets, impacts the levels of job creation and income security in many OECD economies (Bakhtiari et al. Citation2020). Smaller FS/FinTech businesses bear the brunt, as the marketplace contracts through mergers into larger enterprises or even their disappearance. This could potentially lead to greater market concentration among larger businesses in the FS/FinTech sector (see The World Trade Report Citation2023, 66).
Simultaneously, digital transformation has changed workforce structures from traditional- to self-employment following the 2008 recession, and the recent pandemic, disrupting the traditional employee-employer relationship (Robison Citation2013), paving the way for the digital and gig economies to emerge (Istrate and Harris Citation2017). Consequently, the MSME sector has witnessed rapid growth and demand for digital freelancers and gig workers, anticipated to surpass traditional employment by 2027 (Kässi and Lehdonvirta Citation2018; Pew Research Center Citation2019). This seismic shift away from traditional employment is driven by 46% of Generation Z (born 1996–2012) members preferring the flexibility of independent work (Upwork Citation2023). At the other end of the generational spectrum, the ‘baby boomers’ (born 1946–1964) are increasingly turning to self-employment as a transition to, and means of funding their retirement (Pew Research Center Citation2019; Robison Citation2013). If this sector is unable to access finance, the sector will be monopolised by larger organizations and create the reverse of inclusion.
Previous research supports this observation, that the access to finance gap widens for sole traders and micro-organizations, when applying for bank loans, venture capital, and government support during economic volatility (Demirel and Parris Citation2015). In summary, while FinTech has accelerated financial inclusion, the key customer base centres on small borrowers, most affected by market instability. We have chosen a FinTech lender to test our novel PSM solution to assess bridging the access to finance gap utilizing data from a Czech (CZ) FinTech lender during market instability (e.g. COVID-19).
CZ was selected as a representative EU country based on several factors: (i) Gross Domestic Product (GDP) to debt ratio, (ii) levels of digital technological innovation, readiness and adoption, (iii) an identified 50% access to finance gap for small businesses that shares similarities with comparable EU countries and the UK (WBES, Citation2023), and (iv) CZ is a technologically advanced Eastern European country and ranks among the world’s most innovative countries (Hlomane Citation2022). Alternative lending leveraging digital technologies are suggested as a viable solution for closing the access to finance gap for small businesses per se (Mhlanga Citation2021; Sahay et al. Citation2020). Thus, CZ proffers an ideal testbed to explore the use of our PSM solution. Our central research question therefore specifically, asks:
To what extent can psychometric credit scoring models predict the likelihood of arrears, and increase access to finance for micro-organizations and sole traders during market instability?
This paper makes three contributions to the field of PSMs, utilizing FS/FinTech innovation to facilitate financial inclusion for small businesses and their associated lenders. First, despite attention towards the value of PSMs for small business lending, ours is the first that counterfactually explores the stability of a PSM during a period of high macro-economic instability. Second, at the time of writing, this study is the first to consider the European lending sector. Finally, where prior studies have applied small back-test experiments (e.g. use of traditional financial data sources) for probability of default testing, we employ dynamic near real-time psychometric and financial data from a CZ-based FS/FinTech firm (August 2019-February 2022) to not only assess the validity of the PSM for incorporation in both FS/FinTech and mainstream credit scoring procedures for probability of default testing, but translate the results into profit impact of lenders.
This remainder of this paper is structured as follows. Section 2 illustrates the context, concepts, and components underpinning the PSM and builds our hypotheses. Section 3 describes the empirical methodology and methods employed in developing the PSM, the subsequent CZ sample and variables used to further test and validate the model. Section 4 presents and discusses the main results including discussing our hypotheses. Section 5 concludes our study, providing closing remarks and examines the PSM in relation to extant literature. Section 6 discusses research limitations and insights for FinTech practitioners to consider while offering new PSM research avenues to pursue.
2. Literature review
2.1. Credit scoring classification: a historical perspective
Since the mid-twentieth century, both researchers and practitioners have emphasized developing empirical models that assist retail lenders to engage in responsible practices, offering affordable credit to consumers and businesses. Today, commercial banks retain billions in capital via consumer loans and the consumer credit sector are now of substantial economic importance to the global economy. The large volume of loans illustrates that incremental improvements in the accuracy of credit scoring models can result in considerable financial gains for lenders and consumers. Hence, developing accurate credit scoring models is a major priority for financial institutions to optimize profits while effectively managing exposure to lending risk (Baesens et al. Citation2003; Jiang et al. Citation2019; Lessmann et al. Citation2015; Luo, Wu, and Wu Citation2017; Thomas, Allen, and Morkel-Kingsbury Citation2002). Historically, managers evaluated an applicant’s creditworthiness based on their intuitive experience. However, with the support of empirical models, managers can now evaluate credit applicants efficiently, consistently, and accurately. Consequently, attention has been paid to empirical credit scoring (cf. prior citations), resulting in several techniques, referred to as credit scoring models (CSMs). CSMs classify credit applicants into a dichotomous group of ‘good’ or ‘bad’ applicants, indicating their respective likelihood of repaying or defaulting on a loan agreement. Credit scoring problems can be positioned within the scope of the more widely discussed classification issues and bias reducing access to credit for applicants (Akkoç Citation2012; Baesens, Roesch, and Scheule Citation2016; Saberi et al. Citation2013; Verbraken et al. Citation2014). The emergence of machine learning and sophisticated classification techniques, such as neural networks, support vector machines and random forests classifiers has led to extensive benchmarking studies aimed at improving CSMs statistical performance and accuracy (Óskarsdóttir et al. Citation2019). Lessmann et al. (Citation2015), concludes that multiple studies found that traditional credit scoring models (TCSMs) based on simple logistic regression models, performed very well and newer classification techniques offer marginal performance gains. Among statistical techniques, Multivariate discriminant analysis (MDA) (Altman Citation1968; Fisher Citation1936) and logistic regression (LR) (Baesens et al. Citation2003; Wiginton Citation1980) are two popular methods, because they are easy to implement and interpret (Xiao, Xiao, and Wang Citation2016). However, limitations emerge in application, because the data should be linear separable and strictly follow certain distribution. Whereas, AI techniques, such as k-nearest neighbours (KNN) (Henley and Hand Citation1996), genetic algorithm (GA) (Ong, Huang, and Tzeng Citation2005), support vector machines (SVM) (Huang, Chen, and Wang Citation2007), decision trees (DT) (Wang et al. Citation2012), random forest (RF) (Malekipirbazari and Aksakalli Citation2015; Van Thiel and van Raaij Citation2019) and artificial neural network (ANN) (Lee and Chen Citation2005) now provide alternatives to prior statistical techniques based on improved performance. This is achieved via the combination of individual classifiers and ensemble models for credit scoring application, which perform better than individual classifiers in accuracy and stability and are now mainstream for CSMs.
The digitization of credit eliminates the traditional ability of lenders to evaluate a borrower's personality. Consequently, a common drawback of all Credit Scoring Models (CSMs) is their inability to quantify the importance of the borrower's character. Among the ‘six Cs’ of granting credit criterion— Condition, Collateral, Credit, Character, Capacity and Currency, the assessment of the most crucial ‘C’, namely, the borrower’s character, remains questionable, inadequately considered, and measured to evaluate an applicant’s creditworthiness (Capon Citation1982). We argue that to enhance Credit Scoring Models (CSMs), the solution lies in adopting advanced classification techniques and, even more crucially, in harnessing innovative big data sources like psychometrics to incorporate the borrower's character traits as evaluation criteria in both traditional and contemporary classification methods. This approach can lead to the development of comprehensive credit scoring models.
Traditional credit scoring models (TCSMs) predominantly rely on demographic and financial data, creating limitations for assessing the creditworthiness of MSMEs and specifically, sole traders and micro-organizations. As a result, TCSMs are undergoing rapid transformations to broaden financial inclusion via access to finance (Goel and Rastogi Citation2023). Recent innovations include adopting alternative variables, such as the borrower’s social media data (De Cnudde et al. Citation2019; Hendricks and Budree Citation2019), utility data (Djeundje et al. Citation2021), mobile phone data (Agarwal and Alam Citation2020), psychometric data (Azma et al. Citation2019; Van Thiel, Goedee, and Leenders Citation2023) and so on. The idea behind utilizing open and alternative data sets is to serve underbanked sectors and populations who face financial constraints due failing to meet the ‘Know your Customer’ (KYC) financial data requirements to verify customer identity (Elliott et al. Citation2022). Such studies have shown that credit scoring is not limited to demographic and economic variables, other variables can be explored that increase the accuracy in predicting the default traits of borrowers. A systematic literature review examining CSMs suggests that a minimal number of articles have considered alternative variables to assess the borrower’s creditworthiness (Onay and Öztürk Citation2018). For the above reasons, and drawing on theoretical insights from psychometrics in identifying the stable ‘character traits’ of sole traders and micro- business entrepreneurs to inform CSMs, our core research hypothesis is:
H1. Psychometric credit scoring models increase responsible access to finance for small businesses in unstable market conditions.
2.2. Psychometric credit scoring
Extant psychometric literature suggests variables and constructs that could assist in improving the accuracy of OB data for AI-enabled credit scoring models. To explain, the human trait of impatience is found to be correlated with defaulting behaviours (Meier and Sprenger Citation2007). Similarly, sixty-six psychometric variables (not defined in the study) were applied to data relating to credit applicants from MSMEs in Peru (N = 275), to establish psychological traits linked to the repayment traits an Area Under the Curve (AUC) measure of 0.7 was reported, indicating excellent levels of discriminatory model power ( Goel and Rastogi Citation2023, see methodology section for AUC description). To test the resultant default model premised on psychological constructs, the authors estimated a similar model with data from four African countries—Kenya, South Africa, Ghana, and Nigeria, and the prior Peruvian data set. The findings reported an AUC of 0.56-0.58 in relation to an average default period of ≥60 days which indicates low model discrimination effects and limits the usability of the model for these data sets. Furthermore, the lack of clarity regarding which sixty-six variables applied to the two data sets raises questions of internal and external validity to warrant replicating the protocol for this study.
This problematic trend of psychometric variables within the literature providing interesting insights but failing to define which variables were tested is reflected in Arráiz, Bruhn, and Stucchi (Citation2017). The authors used a larger sample (N = 1993) investigating psychometric variables integrated into TCSMs and concluded that psychometric models’ predictive capabilities for repayment or default proved worse in rejecting applicants in contrast to traditional models alone. A limitation emerges in terms of sample which contained banked entrepreneurs and excluded underbanked entrepreneurs. For financial inclusion of this latter group and facilitating their access to finance, data relating to micro-entrepreneurs in Kenya was explored from a psychometric perspective (Dlogosch, Klinger, and Frese Citation2017). The psychometric variables were based on the ‘big five’ psychometric model constructs to measure the role of conscientiousness, emotional stability, openness to experience and integrity in defaulting behaviour of micro-entrepreneurs (Tupes and Christal Citation1992). Findings reported an AUC of 0.67, signifying acceptable levels of discriminatory model power including psychometric predictors and concluded that psychometrics created additional predictive power for identifying defaulting traits of MSME entrepreneurs. Such studies combined psychometric covariates with traditional financial variables like business credit history, financial statements, business assets, market conditions and a business plan. Nevertheless, while some studies indicate that there is no advantage in incorporating psychometric measures with established target segments, the majority contend that psychometrics can improve the prediction of default risk, particularly for underbanked customer segments such as small businesses.
Recent research has supported the inclusion of behavioural traits and attitudes to substantially influence financial behaviour (Liberati and Camillo Citation2018). The authors extracted six psychological constructs from responses to a questionnaire administered by an Italian bank. These were (i) preference for advice, (ii) duty/pleasure, (iii) attachment/detachment, ( iv) sublimation/materialism, (v) idealization/pragmatism, and (vi) humility/sovereignty scale items. The study showed that when these constructs are integrated with TCSMs to assess access to banking services, cash flow, and creating a solvency score, the AUC increased considerably, from 0.554 to 0.850 indicating excellent discrimination effect of the model. Likewise, a PSM trained on a dataset from a pilot study with a Mexican bank included psychometric variables and produced an AUC of 0.6 (acceptable discrimination) indicating that the inclusion of defined psychometric attributes has the potential to improve the accuracy of TCSMs prediction capabilities (Djeundje et al. Citation2021).
Reflecting on the somewhat conflicting findings and design omissions regarding undefined psychometric variables in the literature, the next section presents and justifies the variable selection for our psychometric scoring model (PSM), tested in CZ.
Within the next decade, the current levels of self-employed workers, is predicted to surpass that of traditional employees. Managing finances (financial literacy) is therefore an important skill set for self-employed workers to attain (Struckell et al. Citation2022). To understand the role that financial literacy plays in MSME entrepreneurs obtaining credit, we create a novel psychometric credit scoring model (PSM), providing predictive financial behavioural insights for the current generation of self-employed entrepreneurs, during unstable market conditions.
Our psychometric credit scoring model (PSM), centres on the importance of financial literacy reflecting global recognition of a skills gap in this area (Lusardi and Mitchell Citation2007, Citation2008, Citation2011; Lusardi, Hasler, and Yakoboski Citation2021). Financial literacy is defined as follows:
‘[Financial literacy is] the knowledge and understanding of financial concepts and risks, and the skills, motivation, and confidence to apply such knowledge and understanding in order to make effective decisions across a range of financial contexts, to improve the financial well-being of individuals and society, and to enable participation in economic life’ (OECD Citation2012).
Between 2009 and 2019, more than 500 peer-reviewed articles on financial literacy were published (Goyal and Kumar Citation2021). To inform the PSM in predicting loan repayment behaviours, we analyzed this body of research to understand financial literacy attributes that influence financial behavioural traits. We concluded that consumers’ ability to make informed financial decisions translates into enhanced personal financial behaviours (Klapper and Lusardi Citation2020; Lusardi Citation2019; Lusardi, Hasler, and Yakoboski Citation2021).
Currently, demand for access to affordable credit is increasing, especially in relation to superannuation (pensions), increasing consumer longevity, and the lasting impacts of financial crises. MSMEs are seeking credit to expand and drive economic recovery post-pandemic (Bocanet, Alpenidze, and Badran Citation2021; Dasewicz, Simon, and Ramanujam Citation2020). This heightened demand underscores the importance of promoting and supporting proficient financial literacy (FL) skills as a fundamental prerequisite for individuals and society. Such skills are crucial for optimizing financial decisions and safeguarding against financial scams, fraud, and exploitation in today's digitalized financial landscape (Goyal and Kumar Citation2021).
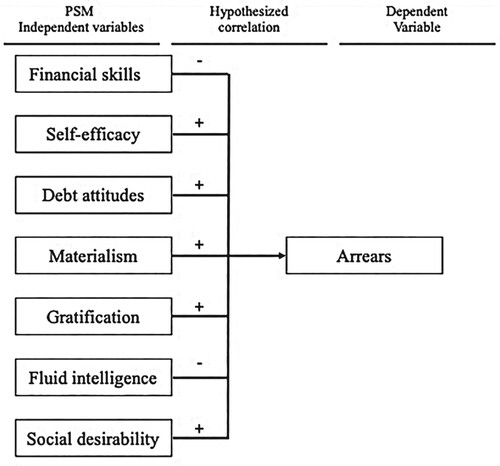
Building upon the OECD's definition, the PSM has a strong emphasis on assessing the creditworthiness of vulnerable consumer sectors including MSME entrepreneurs (Van Thiel, Goedee, and Leenders Citation2023). Building on our previous work by refining and enhancing the PSM framework for MSMEs, illustrated in Figure below, the updated framework incorporates relevant attributes for measuring personality traits associated with financial literacy among entrepreneurs. Consequently, the PSM model, informed by an exploration of existing psychological literature, has revealed relationships between constructs of financial personality, financial behaviour, literacy, and debt. This enables us to hypothetically classify MSME credit applicants into categories of ‘good’ and ‘bad’ payment behaviours. The PSM model has confirmed hypotheses of positive correlations between gratification, materialism, debt attitude, confidence, social desirability, and debt, as well as a negative correlation between financial skills, age, and debt accumulation (Van Thiel, Goedee, and Leenders Citation2023). In the following sections, we provide a detailed exploration of the model’s attributes.
Figure 1. Conceptual PSM attributes with their hypothesized relationships with arrears (overdue payments).
2.2.1. Financial skills
In their extensive financial literacy research (Lusardi and Mitchell Citation2007, Citation2008, Citation2011), it is suggested that financial skills (FSs) drive financial literacy by encompassing capabilities associated with money management, including budgeting and expense tracking. Other research argues that better FSs are associated with possessing higher savings and lower debt (Dew and Xiao Citation2011; Moore Citation2003). Hence, those with a paucity of FL or FSs (or a combination) are financially vulnerable customers, defined in the recent Financial Conduct Authorities (FCA Citation2019, Citation2021, Citation2022) work in this topic and consequently suffer severe financial problems. We therefore hypothesize the following:
H0a: Lower levels of financial skills (FL/FSs) increases arrears.
2.2.2. Financial self-efficacy
The FL literature revealed the construct of self-efficacy as an aspect of FL, FSs, and behaviour. Financial self-efficacy, based on Bandura’s (Citation1986) social cognitive theory, refers to a person's confidence in managing their own finances, in acting with certainty premised on knowledge accumulation. Support is found for financial self-efficacy as vital in translating financial literacy into financial behaviour (Dans and Haberman Citation2007). Financial confidence (aka self-efficacy) and skills required to apply financial knowledge are the key psychological tenets that underpin the transition from knowledge into behaviour. A caveat is that financial self-efficacy can also lead to risky financial behaviour. Debt-related research reveals that students get into deeper debt because they overestimate how much they will earn post-graduation (Seaward and Kemp Citation2000). Similarly, consumer cohorts are shown more likely to obtain a new credit card if they perceive repayment as easy (Yang, Markoczy, and Qi Citation2007). Simply put, consumers take higher risks because they are overconfident in their perceived abilities to manage financial matters (Nosić and Weber Citation2010). We examine the differing types of attitudes such as positive, neutral, and negative in relation to whether this impacts accrual of arrears. Therefore, we hypothesize the following:
H0b: Higher levels of self-efficacy (confidence) increases arrears.
2.2.3. Debt attitudes
Associated with FL is the construct of financial attitude. Research has explored student and household debt, highlighting that more positive attitudes toward debt are associated with accruing more debt (Almenberg et al. Citation2021; Haultain, Kemp, and Chernyshenko Citation2010). Studies state that there were two different types of attitudes associated with debt. On the one hand, fear of debt was associated with less debt, whereas seeing the utility of debt was associated with higher debt. We argue that vulnerable customers with positive attitudes toward debt face a high risk of indebtedness, consequently exacerbating payment difficulties. We therefore hypothesize the following:
H0c: Positive debt attitudes increase arrears.
2.2.4. Materialism
Part of the psychological constructs model includes the impact of personal factors on financial literacy and financial behaviour. Evidence showed that debt attitude (as discussed) has a consistent relationship with materialistic value, where materialism is conceptualized as the extent to which people value the acquisition and consumption of material objects (Norvilitis et al. Citation2006; Garðarsdóttir & Dittmar Citation2012). Materialism reflects the prime importance an individual affords to possessions, whereby the acquisition of goods is a central objective and symbolic of perceived positivity, success, and (psychological) happiness for the individual (Belk Citation1984; Richins Citation2017, Citation2011; Richins and Dawson Citation1992). Materialism can create negative consequences, such as a propensity to regularly overspend (Donnelly, Iyer, and Howell Citation2012; Khare Citation2014) in the pursuit of luxurious purchases and non-essential items (Watson Citation2003), thus, accruing higher debt. Furthermore, materialistic traits have been shown to be associated with poor financial management skills, higher financial worries, and debt but unsurprisingly, more positive attitudes towards borrowing (Donnelly, Iyer, and Howell Citation2012; Garðarsdóttir and Dittmar Citation2012; Pham, Yap, and Dowling Citation2012; Pirog and Roberts Citation2007; Ponchio and Aranha Citation2008: Richins Citation2011; Watson Citation2003). Similar findings were reflected within the USA and UK populations (Brown, Garino, and Taylor Citation2013), Finland (Garðarsdóttir and Dittmar Citation2012) and Brazil (Ponchio and Aranha Citation2008). We therefore hypothesize the following:
H0d: Higher levels of materialism increase arrears.
2.2.5. Gratification
Linked to above constructs, impulsive and compulsive buying traits also leave numerous borrowers in high levels of debt (Joji and Raveendran Citation2008; Khare Citation2016; O'Guinn and Faber Citation1989; Phau and Woo Citation2008). Recent research revealed a link between financially vulnerable customers and increased levels of impulse buying (O'Connor et al. Citation2019). Thus, people with underlying psychological constructs of low self-control and self-esteem lead to compulsive buying behaviours, resulting in higher debt (Achtziger et al. Citation2015), whereas those consumers possessing high self-control were found to save a portion of their salaries from each paycheque (Strömbäck et al. Citation2017). Likewise, people who have difficulty in delaying gratification have higher amounts of debt and are prone to problematic gambling behaviours (Norvilitis et al. Citation2006; Parke, Griffiths, and Irwing Citation2004). Gratification refers to the process in which a person foregoes engaging in immediate reward behaviour to receive a larger reward later (aka., deferred gratification). We therefore hypothesize the following:
H0e: Higher levels of immediate gratification increases arrears.
2.2.6. Fluid intelligence
Cognitive ability is one of the fundamental factors in explaining financial literacy (Muñoz-Murillo, Álvarez-Franco, and Restrepo-Tobón Citation2020). Likewise, that fluid intelligence is a personality characteristic that drives financial literacy (Djeundje et al. Citation2021; Dlogosch, Klinger, and Frese Citation2017; Liberati and Camillo Citation2018). Fluid intelligence is the innate ability of an individual to respond to complex and unexpected situations (Chen et al. Citation2020; Muñoz-Murillo, Álvarez-Franco, and Restrepo-Tobón Citation2020). Thus, fluid intelligence (FI) we interpret as the ability, regardless of prior skills or experience, to grasp relationships between abstract concepts and employ problem-solving abilities, pattern recognition, and working memory or the innate ability of an individual to respond to unexpected situations (Chen et al. Citation2020; Snow and Yalow Citation1982). FI is positively correlated with innovation and indicates a relationship with high-IQ and high levels of innovative traits, premised on measures of utility (US) patents registered (Squalli and Wilson Citation2014). Hence, FI has a positive relationship with business profits, and statistically significant returns to higher FI remained robust when including factors pertaining to entrepreneurship. A 1% standard deviation increases in performance of Raven’s FI test led to higher profits of around 5.7% and a higher business value of about 7% for entrepreneurs. Raven’s progressive matrices consist of images with simple 2D shapes governed by underlying abstract rules to measure someone’s FI. To solve them, the test-taker must identify and often understand never-encountered abstract patterns and generalize them to new settings, an unexpected condition. Although there exists a wide range of abstract visual reasoning (AVR) tasks, in the cognitive literature, evidence places attention to the Raven’s Progressive Matrices (RPMs), finding a highly diagnostic of abstract and relational reasoning abilities and representative for human intelligence in general (Małkiński and Mańdziuk Citation2022). Considering these observations, recent works have investigated whether automatic pattern discovery algorithms can achieve performance comparable to humans in solving RPMs (LeCun, Bengio, and Hinton Citation2015). The present research adapts aspects of the Raven test within the PSM to measure FI. We hypothesize that the following:
H0f: Higher levels of fluid intelligence decreases arrears.
2.2.7. Social desirability
Aligned with materialism, social desirability bias is the tendency to present oneself and one's circumstances in a socially acceptable but not entirely accurate way (Bergen and Labonté Citation2020). This creates a gap between how participants truly perceive reality and how they portray it. It's important to differentiate between social desirability as a personality trait (like a superiority complex) and social desirability as a response mode, where individuals try to create a favourable impression to alter how others perceive their reality (Pauls and Stemmler Citation2003). When discussing social desirability bias in research, the focus is primarily on the latter aspect – the impression (Paulhus Citation1984, Citation2001).
For assessing attitudes toward debt, two types of socially desirable responses are evident: a person genuinely believes the reported information (self-deception) or provides ‘fake’ responses to conform to expected behavioural norms. Consequently, social desirability can introduce false correlations with debt and influence the strength or suppression of an individual's relationship with debt (Ganster, Hennessey, and Luthans Citation1983). Norvilitis et al. (Citation2006) did not directly measure social desirability, however, suggest that this factor can affect whether individuals accurately report their debt attitudes and debt levels. We argue for the importance of measuring social desirability and mitigating its bias for responsible lending practices. As a result, we propose the following hypothesis (Table ):
H0g: Higher levels of social desirability increases arrears.
Table 1. Hypotheses model with core literature per PSM attribute.
3. Data and methods
3.1. Data
To compare the performance of the PSM model with that of the TCSM, we gathered real-time data from 2,884 applicants (N = 2,884) who applied to a CZ FS/FinTech lender between 19 August 2019 and 12 February 2022. Among these applicants (N = 2,884), we computed a psychometric credit score. Out of these, 826 applicants were approved for a loan, representing an acceptance rate of 28.6%. Our research focuses on these 826 accepted applicants since we have default data from them, unlike the rejected applicants.Footnote1 Among the approved loans, 68 applicants defaulted, which accounts for 8.2% of the sample. We define ‘default’ as any occurrence of late loan repayment or partial repayment observed up to 12 February 2022, spanning the entire period. We also counterfactually analyse the performance of both models during a period of extreme stress in the market. The period of the state-of-emergency at the COVID-outbreak between March 2020 and November 2020. In this period 1395 small businesses applied for a loan. Out of these applicants 356 were approved for a loan which is an acceptance rate of 25.5%. Among the approved loans 20 defaulted, which accounts for 5.6% of the sample. The lender provides invoice financing for small businesses that typically issue a limited number of invoices each year. To measure the state of financial literacy of the sole trader or micro-entrepreneur we developed a psychometric credit score based on the psychometric traits and attitudes described in this paper (Table ).
Table 2. Variable descriptions.
To subsequently compute a psychometric credit score, we developed a digital psychometric questionnaire (outlined in Table ). The questionnaire consists of 15 questions assessing personality traits and attitudes using a 5-point Likert scale, measuring the degree of agreement with each statement. Additionally, two questions use a six-alternative pattern recognition test, three questions in a binary format, and one question asks for the respondent's age (demographic metric). For the final two intelligence-related questions, respondents selected the pattern that best matched their perception. Similarly, for social desirability questions, respondents indicated whether they agreed or disagreed with the statement. To calculate the psychometric score on a scale ranging from 0 to 1000, we allocate a maximum of 50 points to each of the 20 questions and then add up the scores for each question to determine the total psychometric score.
Table 3. Psychometric attributes and their questions.
All applicants granted consent during the application process and were required to complete the questionnaire as a prerequisite for loan eligibility.
To ensure fairness, we employed a random sampling technique, as described by Bell, Brennan and Allen (Citation2001), to provide an equal chance of selection for all 2,884 CZ lender applicants in this study. To safeguard applicant privacy, AdviceRobo's dynamic personality data collection toolFootnote2 pseudonymized applicant data by assigning a customer ID. Personal data remained under the lender's control, while psychometric data was transmitted to AdviceRobo for the purpose of conducting psychometric credit score assessments using the PSM. The system automatically collected questionnaire responses via a data collection API, processed the data via the PSM to generate psychometric credit scores and sub-scores for each psychometric attribute of applicants, and the resultant scores transmitted back to the lender through another API. Subsequently, the lender made credit decisions based on their conventional credit decisioning method. This allowed the researchers to make a counterfactual assessment of the quality of both the TCSM and PSM for sole traders and micro-organizations.
The PSM scores were linked to applicant IDs to discern their acceptance status, with 826 being accepted and 2,058 being rejected. We then differentiated between sole traders (N = 507) and micro-organizations (small businesses, N = 319) based on their entity type. Our research primarily concentrated on newly accepted customers, where we aligned their psychometric credit scores with their payment history, which was supplied by the lender at the end of every quarter. To stress-test the results, we specifically examined the period from March 2020 to November 2020, which included the ‘states of emergency’ and nationwide lockdowns at the beginning of the pandemic. During this high-stress state-of-emergency period, the lender gathered data from loan applicants (N = 1,395), loan approvals (N = 356), and defaulting applicants (N = 20) from March 2020 to November 2020. The relevant statistical summaries for the analysis are presented in Table .
Table 4. Descriptive data.
3.2. Method
To test our hypotheses, we employed a four-step approach. First, we conducted a Pearson correlation analysis between the different psychometric attributes and arrears to examine their relationship. A correlational relationship ranges between the value of −1 (indicating a negative relationship) and +1 (indicating a positive relationship). A value of – or +1 indicates a perfect relationship between the two variables. A value of 0 indicates no relationship. Correlations are independent of scale(s) and can be used to compare the effects of different responses (e.g. Likert scales versus binary choices). Although technically, a correlation can range between −1 and +1, this is very rare in psychological research. For example, within the social sciences, a correlation of .1 is seen as a small effect, .3 as a moderate effect, and .5 as a large effect (Cohen Citation1988). The higher the correlation, the stronger the effect of the construct on having arrears.
While these correlations provide initial insights into the predictive value of each attribute, we did not delve into further investigation in this paper. In our previous study (Van Thiel, Goedee, and Leenders Citation2023), we extensively explained the creation and verification of the PSM for evaluating the creditworthiness of low-income consumers, utilizing data from two different credit scoring markets: the USA and The Netherlands. For the current study, which concentrates on PSM for MSME entrepreneurs, we use a linear model in which the credit score is the total of points obtained by an applicant based on the individual questions presented in Table . The logistic regression model is presented below.
(1)
(1) In which Y is the dependent variable ‘Probability of Repayment Score’, β the coefficients,
the independent variable score for question 1,
the independent variable score for question 2,
the independent variable for score question 20, and the sum of the 20 independent variable scores give the credit score for the probability of repayment.
Next, we aim to gain insights into the precise classification of sole traders and micro-organizations (from the MSME sector), determining a suitable decision threshold for our linear model, and assessing the overall effectiveness of the PSM. To evaluate our binary classification model, we employ the Receiver Operating Characteristic (ROC) curve. This curve visually illustrates the balance between correctly identifying positive cases (non-creditworthy) and minimizing false positives (creditworthy businesses misclassified as non-creditworthy) at different classification thresholds (Ho Citation2017).
In our context of classifying small business probability of repayment, the ROC curve demonstrates how well the system distinguishes between good paying and late paying businesses. Thus, allowing an evaluation of the PSM's ability to accurately identify well repaying cases while minimizing the risk of false positives (misclassifying defaulters as good payers; Ho Citation2017).
Subsequently, we determine the cut-off point, also known as the decision threshold. By plotting the TPR (Sensitivity (4)) against the FPR (1-Specificity (7)) at various classification thresholds, the ROC curve provides a visual representation of how the model's performance changes as the threshold for classifying a data point as positive or negative is adjusted. This threshold determines whether an individual or business is classified as good loan repayer or defaulter, striking a balance between accepting higher-risk applicants (higher sensitivity in (4)) and reducing the risk of defaults (higher specificity in (5)). The choice of the decision threshold involves a trade-off between these considerations, considering associated costs and optimizing the desired balance. In selecting our cut-off point, we prioritize both sensitivity and specificity equally. We choose the point closest to the top-left corner of the ROC curve, which is referred to as the Youden Index (Schisterman et al. Citation2005). This leads us to set our cut-off point at 0.33.
We calculate the Area Under the Curve (AUC) and the corresponding confusion matrix for the ROC curve and decision threshold. The equation for AUROC is not a simple mathematical formula like some other metrics, but it is based on the ROC curve, a graphical representation of the model's performance at different thresholds. The ROC curve plots the True Positive Rate (Sensitivity) against the False Positive Rate (1 – Specificity) for various threshold values. We define the AUC as:
(2)
(2) The AUC is a single metric that quantifies the overall performance of a credit scoring system, ranging from 0 to 1, with a higher value indicating better discriminatory power (Yang and Berdine Citation2017). A higher AUC suggests that the system is more effective at ranking and distinguishing creditworthy from non-creditworthy applicants. Generally, an AUC of 0.5-0.6 indicates poor discrimination, 0.6-0.7 is considered acceptable discrimination, 0.7–0.8 reflects excellent discrimination, and an AUC greater than 0.8 signifies outstanding discriminatory power of the categorical model (Yang and Berdine Citation2017).
To assess the performance of our classification model, we employed a confusion matrix. This matrix provides a structured overview of the binary classification model functions and offers a comprehensive breakdown of PSM’s predictions in comparison to actual outcomes. The main objective is to drive financial inclusion of sole-traders and micro-organizations, the matrix categorizes results into four groups:
True Positives (TP): prediction of creditworthy applicants.
False Positives (FP): prediction of creditworthy applicants, who are non-creditworthy.
True Negatives (TN): prediction of non-creditworthy applicants, who are non-creditworthy.
False Negatives (FN): prediction of non-creditworthy applicants, who are creditworthy.
From the confusion matrix, we can calculate various performance metrics to assess the model's effectiveness. The accuracy in (3) is an overall measure of the model's correctness in classifying applicants as creditworthy or non-creditworthy (conducted on accepted lenders data).
(3)
(3) While the notion of ‘good’ accuracy can be subjective, industry standards generally consider accuracy above 70% to be ‘good’ (Obviously.Ai Citation2023).
In addition to accuracy, sensitivity (e.g. recall or true positive rate) in (4) gauges the model’s capacity to correctly identify creditworthy applicants, while specificity in (5) evaluates its capability to accurately spot non-creditworthy applicants.
(4)
(4)
(5)
(5)
The combined metrics offer a comprehensive analysis of the PSM’s performance, especially regarding its ability to minimize the risk of defaults. By examining accuracy, sensitivity, and specificity, the PSM's capacity to make precise classifications and informed decisions regarding applicants’ creditworthiness is evaluated for reliability.
Third, we carried out a counterfactual analysis (CFA), to draw causal inferences regarding the impact of X on Y within a specific case. Thus, ‘within-case’ counterfactual analysis is a crucial tool for causal inference in small-N and case-study analyses (Mahoney and Barrenechea Citation2019). In our CFA, we evaluated whether the PSM outperforms the traditional credit scoring model for sole traders and micro-organizations in the Czech Republic during the market turbulence caused by COVID-19. Our analysis primarily focused on default rates in (6) (often referred to as ‘bad rates’) between the PSM and the TCSM, especially during times of heightened volatility such as lockdowns and the broader crisis period.
(6)
(6) Additionally, we evaluated the extent to which the PSM accurately identifies both well-paying and late-paying applicants within the accepted customer base.
Fourth, we assessed the effectiveness of the PSM for two distinct sectors within MSMEs: sole traders, and micro-organizations. Again, comparing the lender's default rates with the default rates generated by the PSM. Expanding on our prior analysis, we examined performance during both the stressed ‘state of emergency’ period from March 2020 to November 2020 and the overall crisis period from August 2019 to February 2022 to gain a comprehensive understanding. Python 3.10.0, along with the Pandas and NumPy libraries, was used for the analyses (Fuhrer, Solem, and Verdier Citation2021). These tools and libraries were employed for tasks like data loading, preprocessing, calculating performance metrics, plotting ROC curves, and conducting analyses.
4. Results
4.1. Psychometric model features
In support of the conceptual model presented in Figure , we reference baseline correlations from our previous paper (Van Thiel, Goedee, and Leenders Citation2023). The columns in the table represent psychometric attributes accompanied with correlations for arrears, significance levels, and conclusive statements regarding these relationships.Footnote3
We observe a robust correlation between financial skills and arrears, with a negative value of −0.57 (p < 0.001), indicating that higher financial skills are associated with lower levels of arrears. This aligns with Hypothesis 0a, suggesting that lower financial skills are linked to increased arrears.
Furthermore, we find that self-efficacy (−0.25, p = 0.001), debt attitude (0.22, p = 0.01), and social desirability (−0.31, p = 0.001) exhibit moderate relationships with arrears. However, only 22-31% of the variation in arrears is explained by the PSM in the sampled population. Consequently, we offer partial support for Hypotheses H0b and H0 g, indicating that higher levels of self-efficacy and social desirability are associated with lower arrears. On the contrary, debt attitude has a positive relationship with arrears (0.22, p = 0.01), suggesting that greater openness to debt correlates with increased arrears, in line with Hypothesis 0c.
In contrast, psychometric attributes such as materialism (0.11, p = 0.08), delayed gratification (0.08, p = 0.58), and fluid intelligence (−0.12, p = 0.17) exhibit weak correlations with arrears and lack statistical significance. As a result, we reject Hypotheses H0d, H0e, and H0f.
In summary, our findings provide evidence that financial skills, self-efficacy, debt attitude, and social desirability factors exhibit statistically significant correlations with arrears, both positively and negatively. Previous research has also indicated relationships between financial skills and financial fragility (Lusardi, Hasler, and Yakoboski Citation2021), financial skills and financial education (Lusardi and Mitchell Citation2007, Citation2008), self-efficacy (Seaward and Kemp Citation2000), debt attitude (Almenberg et al. Citation2021; Azma et al. Citation2019), and social desirability (Norvilitis et al. Citation2006) in the context of debt. Moreover, the positive correlation with debt attitude suggests areas for further investigation, implying that certain attitudes toward debt may predispose individuals to higher risk of arrears. The non-significant results for materialism, delay of gratification, and fluid intelligence suggest that these factors may not be as closely related to arrears, and that PSM can be further improved by revising attributes and exploring further relationships between attributes. For example, the non-significant relationships do not preclude their importance but indicate a need for more nuanced research designs, such as integrating longitudinal data and experimental methods to capture the dynamics of these variables over time and in different socioeconomic contexts. This research contributes to the existing body of knowledge by establishing a connection between financial literacy related attributes financial skills, self-efficacy, debt attitudes as well as social desirability and arrears and provides insight for future research. As a result, we reject the null hypothesis (H0) that there is no significant correlation between psychometric attributes and arrears (Table ).
Table 5. Overview of correlations between PSM attributes and arrears.
4.2. Psychometric model performance
To examine the core research question and H1, we assess the performance of the model through a ROC (Receiver Operating Characteristic) analysis. This evaluation encompasses the PSM’s overall performance and specifically for sectors sole-traders and micro-organizations access to credit assessments.
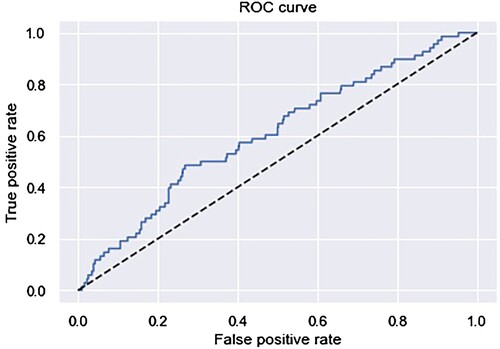
Our findings reveal that the PSM model demonstrates acceptable discriminatory power (AUC, 0.71) in predicting arrears for all small business sole-trader customers combined. Within the context of our ROC curve, we establish a decision threshold to determine whether to accept new customers, aiming to strike a balance between the true positive rate (TPR) and false positive rate (FPR) The specific threshold that balances TPR and FPR on our ROC curve is set at 0.33.
(7)
(7) Given the significant impact of credit scoring on lending decisions and potential financial losses, careful consideration of the threshold and its implications is crucial in the context of credit assessment and risk management. By setting a threshold of 0.33 on the ROC curve for both PSM and TCSM, it signifies that the PSM places a higher emphasis on sensitivity or recall because it shifts the balance in favour of correctly identifying positive cases, even if it results in a higher false positive rate. In other words, the model strives to detect a larger portion of true positive cases, which are individuals less likely to default on their credit commitments (based on the available accepted applicant dataset. Data for rejected applicants was not collected by the lender). The primary objective of the PSM is by introducing psychometric data into the credit scoring data, increase the prediction of creditworthy applicants and their likelihood to default on payments and accrue arrears, compared to TCSMs. By setting this threshold, the model is designed to be more cautious in identifying potential defaulters, capturing a greater number of individuals who may pose a credit risk. As a result, it outperforms the TCSM in both acceptance and default rates.
The ROC curve, presented in Figure , serves as a straightforward yet comprehensive empirical representation of the impact of this decision threshold. The illustration provides all possible combinations of the relative frequencies of various types of correct and incorrect decisions (Gerke and Zapf Citation2022; Martínez-Camblor and Pardo-Fernández Citation2019). With the Roc-curve the confusion matrix of the total period is presented in Figure .
Figure 2. ROC-curve total period (August 2019–February 2022).
Initially, the PSM was assessed for accuracy, in binary classification, accuracy is defined in (3). Here, TP stands for True Positives, TN for True Negatives, FP for False Positives, and FN for False Negatives (Table ).
Table 6. Confusion Matrices PSM versus TCSM total period.
Our findings show that the PSM has lower accuracy when considering all customer sectors during the entire period from 2019 to 2022 (0.55) compared to the TCSM (0.92). However, when we focus on the accuracy of customers predicted to accept small business credit (those predicted to have good payment behaviour), the accuracy is 0.93, slightly better than the TCSM.
Furthermore, a more detailed assessment of the model's performance reveals that it excels in avoiding false positives (Precision 0.94, as shown in (8)). This means the model supports financial inclusion while keeping default costs low. Given that false positives result in significant costs, this metric is essential for the effectiveness of a high-performing credit scoring model.
Precision in (8), defined as the proportion of correctly predicted positive instances out of all positive predictions made by the model (Fawcett Citation2005), reflects the model's precision in positive predictions.
(8)
(8) Subsequently, in examining the model's recall, defined as ‘the fraction of all real anomalies that are successfully detected’ (Tatbul et al. Citation2018, 1; Zhang and Zhang Citation2009), in terms of precision in the PSM, recall aligns appropriately (0.55). The F1 metric in (9), defined as the harmonic mean of precision and recall, further confirms the model's high precision.
(9)
(9)
It is noteworthy that ‘precision is the fraction of all detected good customers that are real good customers, whereas recall is the fraction of all real good customers that are successfully detected’ (Tatbul et al. Citation2018, 1; Zhang and Zhang Citation2009).
The analysis was repeated for each customer segment and Table provides an overview of the overall metrics and metrics specific to each period and segment. Despite the model's lower overall accuracy, we conclude that it exhibits remarkable accuracy and acceptable discriminatory power in predicting good customers with strong precision. Therefore, we believe that the PSM presents an intriguing opportunity to enhance traditional credit scoring model (TCSM) practices for the financial inclusion of sole traders and micro-organizations. While we recommend further modelling and parameter tuning to improve the accuracy of the generic model, we argue that PSM can significantly benefit MSME lenders. First, incorporating PSM as a secondary layer to the credit scoring engine can effectively assess rejected applicants with low or no traditional credit scores, such as sole traders, micro-organizations, or small businesses. Second, integrating PSM with TCSM (Traditional Credit Scoring Models) can enhance MSME lenders’ risk segmentation and refine MSME scorecards. Third, applying PSM can advance scenario analysis approaches by incorporating additional data, particularly financial literacy-related information like financial skills, self-efficacy, and delay of gratification. This, along with insights into debt attitudes, can support more detailed MSME stress testing.
Table 7. PSM metrics. Overall, per period and per customer segment.
4.3. Psychometric model robustness
To evaluate the PSMs resilience in the face of extreme crisis conditions, we conducted a stress test during the ‘state of emergency’ period at the onset of the COVID-19 pandemic, spanning from March to November 2020. During this challenging time in the Czech Republic (CZ), historical data lost its reliability for credit scoring, as past performance could no longer accurately predict future outcomes.
To stress test the PSMs performance in this stressed state-of-emergency period, we conducted the same evaluation procedures, including the creation of a ROC curve and confusion matrices for this specific period (Figure and Table ). The PSM maintained acceptable discriminatory capabilities, achieving an AUC of 0.69 despite the high volatility witnessed during the COVID-19 period (March-November 2020). A decision threshold of 0.33 for both PSM and TCSM was set by maintaining a balance between the true positive rate (TPR) and false positive rate (FPR) throughout this high-stress period.
Figure 3. ROC-curve period of ‘state of emergency’ (March 2020–November 2020).
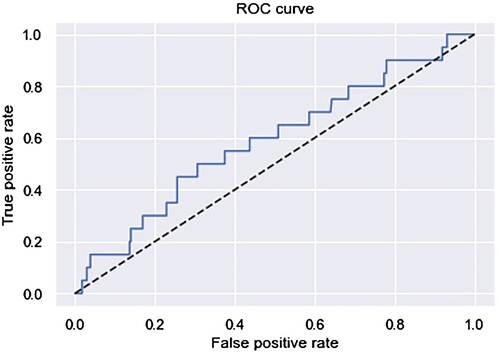
Table 8. Confusion matrices PSM versus TCSM state-of-emergency period.
Turning to test the PSM during this ‘state of emergency’ period (March – November 2020) characterized by high volatility, we found that the PSM's accuracy during this period was similar to its accuracy over the entire duration, with an overall accuracy of 0.51, which is relatively low. However, upon closer examination of the model's performance, it effectively minimized false positives during the ‘state of emergency’ period (Precision 0.91). The PSM's accuracy in correctly predicting good customers stands at 0.96, surpassing the TCSM's accuracy in predicting good customers (0.94). Given the lender's focus on curtailing false positives due to associated costs, the recall rate was deemed appropriate at 0.51. Additionally, the F1 metric confirmed the model's elevated precision, as detailed in Table .
These findings underscore the PSM's robustness during periods of heightened volatility, exemplified by the ‘state of emergency’ during March to November 2020. Consequently, this suggests that replacing TCSMs with PSMs during times of volatility is a viable strategy. TCSMs frequently fail to adapt to evolving customer circumstances, prompting banks to resort to temporary measures such as expert adjustments of default rates at portfolio-segment levels during similar periods (McKinsey Citation2022).
4.4. Psychometric profit contribution
In assessing the profit contribution of the PSM, a counterfactual analysis (CFA) was conducted to compare the PSM's performance against the TCSM. The analysis utilized the entire scored base (N = 2884) for comparing acceptance rates and the accepted customer base (N = 826) for comparing default rates. This facilitated the cross-validation of the ‘bad’ or default rates, as described in (6), for both models using the same dataset. The CFA reveals that the PSM raised the acceptance rates to 37.3%, as opposed to 28.6% with the traditional model, resulting in N = 1077 (PSM) compared to 826 (TCSM) predicted good customers out of N = 2884 applicants (Table ).
Table 9. Acceptance rates PSM & TCSM total period and state of emergency period.
To validate the effectiveness of the scoring models we now validate their default rates. Out of the N = 826 accepted small businesses, the TCSM recorded N = 68 false positives over the entire period (2019–2022), resulting in an 8.2% bad rate for the TCSM. Conversely, among the 826 accepted customers, PSM predicted 381 MSMEs as defaulters and rejected them, representing 46% of the total. This suggests that PSM may be considered a conservative model, potentially impacting profitability. However, Table shows that TCSM rejected 71.7% of the 2,884 applicants, indicating it is more conservative than PSM. Additionally, of the 68 actual defaults, PSM accurately predicted 40 customers and made incorrect predictions for 28 customers. Among the 445 predicted good customers, this resulted in a 6.3% bad rate. Therefore, we argue that PSM not only proves less conservative than TCSM but also achieves a 23.2% lower default rate. Similarly, during the state of emergency period, we observe a similar trend. Out of 356 accepted customers, PSM predicted 178 small businesses as defaulters, comprising 50% of the total. Once again, Table illustrates that TCSM rejected 74.5% of the 1395 applicants, indicating that even during periods of severe stress, TCSM is more conservative than PSM. Furthermore, of the 20 actual defaults, PSM accurately predicted 8 customers and made incorrect predictions for 12 customers. Among the 178 predicted good customers, this resulted in a bad rate of 4.5%. Therefore, we argue that even during the high-stress state of emergency period, PSM proves to be not only less conservative than TCSM but also achieves a 20% lower default rate. This analysis further demonstrates the PSM's capacity to enhance access to finance for the small business (MSME) sector (see Table ).
Table 10. Default rates PSM & TCSM total period and state-of emergency.
Turning to assess the robustness of the PSM versus TCSM during high volatility periods, specifically the state of emergency from March to November 2020, and to evaluate whether profits increased, we replicated the analysis conducted for the total period.
First, the TCSM accepted N = 356 applicants out of the total of during this state-of-emergency period. Among them, N = 20 were incorrectly predicted as good customers, resulting in a bad rate of 5.6%. On the other hand, the PSM accepted N = 178 customers during this state-of-emergency period and incorrectly predicted 8 applicants as non-defaulters, resulting in a bad rate of 4.5% (Table ). Notably, the PSM demonstrated resilience during this high-stress state of emergency and outperformed the TCSM with a 20% lower bad rate, effectively reducing default costs and contributing to lender profit margins during market volatility.
Tables and provide a detailed breakdown of the analysis of the state-of-emergency model performances. In conclusion, stress tests reveal the effectiveness of the PSM during market volatility, confirming our core hypothesis H1.
4.5. Profit contribution per small business segment
Having established the effectiveness of the PSM in promoting financial inclusion for small businesses, we proceed to evaluate its performance across different small business segments, specifically self-employed individuals, and small businesses. We conduct a repeat of the previous counterfactual tests (CFA) for both segments, recognizing that both face distinct challenges in accessing capital to support their growth. These challenges encompass limited collateral, sparse credit history, limited financial management capabilities, and restricted access to financial networks. Additionally, regulatory barriers and the perception of being high-risk applicants by lenders employing traditional Credit Scoring Models (CSMs) contribute to these constraints.
When we compare the default rates of these two segments in a counterfactual manner, the results reveal that the PSM leads to a substantial 20.3% lower default rate for sole-traders. This noteworthy improvement can be attributed to the PSM's consideration of non-financial factors, such as the more stable personality attributes and attitudes of entrepreneurs, as opposed to relying solely on less informative traditional financial drivers for this segment.
Furthermore, concerning micro-organizations, we observed a similar trend where the PSM outperformed the traditional model, resulting in a remarkable 24.4% lower default rate for the Total period. For a comprehensive breakdown, please refer to Tables and . These findings underscore the PSM's capacity to enhance credit risk assessment and reduce default rates for both segments.
Table 11. Acceptance rates per sector PSM TCSM total period and state-of-emergency.
Table 12. Default rates PSM & TCSM per sector for both periods.
We repeated the Counterfactual Analysis (CFA) to subject the results to a stress test and validate the default rates for both sectors during the period of extreme uncertainty, characterized by the ‘state of emergency’ due to COVID-19. Table illustrates that again higher acceptance rates are observed in this period of state of emergency between March 2020 and November 2020 (48.5% for micro-organizations versus 51.4% for sole traders). However, Table reveals contrasting outcomes: the PSM exhibited a 46.2% higher default rate for micro-organizations while demonstrating a 47.1% lower default rate for self-employed individuals (3.96% versus 7.49%).
As we delve into the stress-tested situation for the ‘state of emergency’ during the COVID-19 period, we find that our findings hold firm for self-employed individuals. In this context, the PSM consistently outperforms the TCSM, resulting in a notably lower default rate.
However, the scenario differs for micro-organizations, where the stress-test results reveal a PSM default rate of 5.19%, which is 46% higher than the TCSM default rate. Several factors may contribute to this discrepancy, including potential model bias due to the limited number of defaults observed (N = 6), as indicated in Table . Another plausible explanation could be the implementation of more rigorous management oversight on the traditional model during the high uncertainty period.
We argue that these observations indicate the importance of context and specific circumstances in credit risk assessment, underscoring the need for adaptable models that can respond effectively to varying conditions.
The study examined the relationship between psychometric attributes and credit arrears, finding strong negative correlations between higher financial skills and lower arrears. The Psychometric Scoring Model (PSM) demonstrated acceptable discriminatory power in predicting arrears for small business sole-trader customers, with an emphasis on sensitivity. During a stress test in the state of emergency (March–November 2020), the PSM maintained its capabilities and displayed remarkable accuracy in predicting good customers. A counterfactual analysis (CFA) showed that the PSM increased acceptance rates and reduced default rates, making it a promising tool for enhancing access to finance for small businesses. However, results during the stress test period varied between micro-organizations and self-employed individuals, emphasizing the importance of context and adaptable models in credit risk assessment. This study underscores the potential of psychometric attributes in credit risk assessment and the flexibility offered by the PSM in adapting to changing circumstances.
5. Discussion and conclusion
In an environment of growing macroeconomic volatility, increasingly complex financial products, and a widening access to finance gap for small businesses (MSMEs), this research explores whether a novel financial literacy-based psychometric credit scoring model (PSM) can effectively address the access to finance challenges faced by small businesses, including sole traders and micro-organizations, in unstable market environments. Therefore, incorporating dynamic psychometric data into the application process of a Czech fintech lender indicates the potential to improve financial inclusion in this sector and support the growth of micro, small and medium-sized enterprises (MSMEs). In our data collection, we obtained both PSM and TCSM data from all accepted applicants. However, since PSM is applied in addition to TCSM, we only have default data from customers accepted by TCSM (see limitations for discussion). Nevertheless, we provide support for our first hypothesis (H1), indicating that the psychometric credit scoring model (PSM) offers an opportunity to responsibly expedite access to finance for self-employed individuals and micro-organizations in the Czech Republic by assessing applicants’ likelihood of credit default and reducing credit risk for lenders. While we recommend further modelling and parameter tuning to improve the accuracy of the generic model, we argue that PSM can significantly benefit MSME lenders. First, incorporating PSM as a secondary layer to the credit scoring engine can effectively assess applicants with low or no traditional credit scores, such as sole traders, micro-organizations, or small businesses. Second, integrating PSM with TCSM (traditional credit scoring models) can enhance MSME lenders’ risk segmentation and refine MSME scorecards. Third, applying PSM can advance scenario analysis approaches by incorporating additional data, particularly financial literacy-related information like financial skills, self-efficacy, and delay of gratification. This, along with insights into debt attitudes, can support more detailed MSME stress testing.
Notably, the PSM outperformed Traditional Credit Scoring Models (TCSM) in identifying risky customers throughout the entire pandemic period from 19 August 2019 to 12 February 2022. To assess the robustness of our model, we conducted specific stress tests during the ‘state of emergency’ period at the COVID-outbreak between March 2020 and November 2020. Our findings suggest that the PSM effectively distinguishes the creditworthiness of small businesses, including sole traders and micro-organizations in this period of high stress. These findings align with previous evidence advocating for the inclusion of psychometric factors to enhance credit scoring decision-making processes (Djeundje et al. Citation2021; Dlogosch, Klinger, and Frese Citation2017; Goel and Rastogi Citation2023; Liberati and Camillo Citation2018).
To the best of our knowledge, this study provides the first evidence that PSMs improve credit accessibility for underserved MSMEs and sub-sectors during high market volatility within the Czech Republic, Europe. Such evidence carries particular significance for global MSMEs, given the continually shifting macroeconomic landscape and the growing gap in access to finance for sole-traders and micro-organizations.
Furthermore, this study provides the first demonstration of PSM effectiveness in high-income markets (CZ EU). The core research question and Hypothesis 1 receive support, indicating that the implementation of PSMs expedites responsible access to finance for sole-traders and micro-organizations. By harnessing dynamic psychometric data and FinTech innovation, this evidence contributes to advancing financial inclusion for MSMEs and sub-sectors in increased accuracy for predicting credit risk factors, beyond the capabilities of TCSMs.
Specifically, our findings suggest that adopting PSMs results in higher acceptance rates, especially under extreme market and global volatility, while simultaneously leading to significantly lower defaults and, consequently, increased profits for further lending. A closer examination by sector over the total period (August 2019 – February 2020) reveals that the PSM enhances access to finance versus TCSM for micro-organizations when compared to sole-traders (a 115% increase vs. a 23% decrease). Moreover, PSM defaults rates are notably lower during this total research period (6.3% PSM default rate versus 8.3% TCSM default rate).
Furthermore, in the effort to narrow the financial access gap in uncertain markets marked by cautious credit risk management, the PSM outperforms TCSMs for underserved small business segments, achieving a significantly higher acceptance rate (48.5% for micro-organizations compared to 51.4% for sole traders) during the challenging state of emergency period (March 2020 – November 2020). In developing a new PSM model for MMSME lending based on constructs drawn from financial literacy and skills literature, PSM explored how psychometric attributes are related to instances of arrears (Klapper and Lusardi Citation2020 Lusardi Citation2019; Lusardi, Hasler, and Yakoboski Citation2021; Struckell et al. Citation2022; Van Thiel, Goedee, and Leenders Citation2023;). Consistent with earlier research, the findings support H0a and H0c, as the constructs incorporated in the PSM, indicating that higher levels of financial skills are associated with reduced instances of arrears, while higher levels of debt attitudes are linked to increased arrears (Klapper and Lusardi Citation2020; Lusardi Citation2019; Lusardi, Hasler, and Yakoboski Citation2021; Struckell et al. Citation2022).
The PSM contributions to research examining the relationship between psychometric attributes of applicants, and the likelihood of late payment of debt and arrears accrual, whereas previous research primarily examined the connection between these attributes and overall debt levels or financial education needs. We found partial support for H0b and H0 g, suggesting that higher levels of self-efficacy and social desirability are associated with a decrease in arrears. Moreover, prior research had identified a relationship between these psychometric attributes and debt but failed to specifically explore their predictive power regarding the likelihood of debt repayment based on individual characteristics and traits (Dans and Haberman Citation2007; Ganster, Hennessey, and Luthans Citation1983; Norvilitis et al. Citation2006; Nosić and Weber Citation2010; Seaward and Kemp Citation2000; Yang, Markoczy, and Qi Citation2007).
We reject H0d, H0e, and H0f as evidence did not support a significant relationship between materialism, gratification, fluid intelligence, and instances of arrears. The summarized results are presented in Table .
Table 13. Research findings.
A series of counterfactual analyses (CFA) conducted between the TCSMs employed by a Czech-based FinTech lender and the PSM reveals a significant business opportunity. Evidence suggests the potential to increase loan applicants by >30% and reduce the applicant default rate by >20%. The PSM results remain consistent across the period of extreme volatility of ‘states of emergency’ (March-November 2020). The accrued evidence illustrates the PSM's capacity to bridge the finance gap and responsibly promote inclusion within the underserved MSME sector, especially during periods of higher market volatility.
Aligned with prior literature, we support the inclusion of psychometrics in credit scoring models, leading to enhancements in predictive accuracy, albeit metrics should be clearly defined to thoroughly test all configurations to enhance the PSMs predictive power (Djeundje et al. Citation2021; Dlogosch, Klinger, and Frese Citation2017; Goel and Rastogi Citation2023; Liberati and Camillo Citation2018). Likewise, for accuracy metrics (Accuracy, Precision, Recall, F1; Altman and Bland Citation1994; Schisterman et al. Citation2005; Yang and Berdine Citation2017), we conducted live and automated application design, and provide insights into the potential business growth for the Financial Services/FinTech lender.
At a granular level, this study demonstrates the first investigation that PSMs facilitate access to finance for MSMEs and sub-sectors sectors of sole traders and micro-organizations, especially during market volatility where traditional credit data may be unreliable and/or unavailable. Prior research has explored the application of psychometric scoring in low-income markets (Goel and Rastogi Citation2023), we are, to the best of our knowledge, the first to illustrate its business impact in a high-income European market (Czech Republic). In the current macroeconomic environment, as Europe teeters on the edge of a recession, lenders are more risk averse in scrutinizing the quality of their investment portfolios while aiming to reach valuable yet underserved customer sectors.
We argue that the PSM represents the first steps towards developing informed and responsible small business lending practices, enabling profitable and sustainable growth strategies, particularly during current and future periods of instability. Albeit, that there are limitations of this study, we call for further research to extend and contribute evidence to the evolution of PSMs in promote fairer and transparent lending. We now turn to address these issues.
6. Limitations and future research
The present correlation analysis reveals significant relationships between financial skills, self-efficacy, social desirability, debt attitude, and age with the frequency of falling into arrears. These findings underscore the multifaceted nature of financial behaviour and suggest several avenues for further research. Future studies could explore the causal pathways that link financial skills and self-efficacy to financial outcomes, potentially illuminating the psychological and educational processes that contribute to better financial management. The unexpected positive correlation between a positive debt attitude and arrears warrants an in-depth qualitative inquiry to unpack individuals’ perceptions and cognitive biases towards debt. Furthermore, the role of social desirability points towards the influence of cultural and social norms on financial behaviour, a relatively underexplored area in financial research. The non-significant relationships with materialism, delay of gratification, and fluid intelligence do not preclude their importance but indicate a need for more nuanced research designs, integrating longitudinal data and experimental methods to capture the dynamics of these variables over time and in different socioeconomic contexts. Last, the significant negative correlation with age suggests that financial behaviour and risk of arrears change across the lifespan, calling for a life-cycle perspective in future financial behavioural research.
The first limitation of this study is that the data sample is confined to default data from accepted customers only. Furthermore, the applicability of the findings beyond the Czech sample and population should also be further researched. That said, the PSM warrants application and testing across different upper middle to high income countries with increasing percentages of sole traders and micro-organizations to examine the predictive power within and between cohorts to increase financial inclusion and promote growth in these MSME sectors (i.e. UK, France, Germany, etc.).
Second, the study investigated the PSM performance during periods of unprecedented volatility and financial instability caused by the COVID-19 pandemic. Entrepreneurs, and risk managers across the world experienced financial shock, necessitating new risk assessment strategies to develop to account for the ‘new normal’ (McKinsey Citation2022). We recommend performing additional research in the post-covid era to validate the robustness of the PSM across differing time frames and financial market conditions.
Third, the series of CFAs to stress test the PSM against the performance of TCSMs produced evidence in support of prior studies integrating psychometric data with traditional and alternative credit data to facilitate responsible and fair credit decision making processes from lenders (Djeundje et al. Citation2021; Dlogosch, Klinger, and Frese Citation2017; Goel and Rastogi Citation2023; Liberati and Camillo Citation2018). Nonetheless, it is essential to acknowledge the relatively limited sample size, consisting of 2,884 psychometric credit scores and 826 credit scores accompanied by behavioural payment data from accepted customers. Consequently, we recommend expanding the research sample size and enhancing the integration of psychometrics with various dynamic open data sources for more comprehensive insights. For instance, open banking transactions, social media, mobile phones, biometrics, and search engines to develop consumer behavioural insights. In so doing, use and re-use of data must adhere to ethical data standards, abiding by GDPR and similar data privacy regulations and compliance to uphold consumer protection (Elliott et al. Citation2021).
Finally, as artificial intelligence (AI) models evolve, psychometric data should be considered to address the untapped underserved and underbanked MSME sector and low-income customer segments (Van Thiel, Goedee, and Leenders Citation2023). This aligns to FinTech’s claims of innovation and driving greater financial inclusion, adopting the PSM can increase access to basic bank accounts and financial services creating an inclusive digital society (Arner et al. Citation2020, Citation2021; Banna, Hassan, and Rashid Citation2021). A final caveat and suggested research avenue(s), is on the one hand, engaging in the responsible use of dynamic data automation via AI-enabled credit scoring (Van Thiel and van Raaij Citation2019), whilst on the other hand, ensuring that ‘we’ uphold consumer privacy to reduce not widen the current financial and digital divide affecting citizens and MSMEs (Elliott et al. Citation2021).
Ethical statement
Due to ethical or privacy concerns, data cannot be made publicly available. However, summarized data are available from the corresponding author upon reasonable request.
Disclosure statement
No potential conflict of interest was reported by the author(s).
Additional information
Notes on contributors
Diederick van Thiel
Diederick van Thiel is an experienced board member, data-tech investor, and researcher who is recognized as one of Europe's fintech pioneers since 2010. All of his fintech companies were listed in the European Fintech Fifty, and he was awarded London Fintech CEO of the Year in 2018. Diederick is the founder and CEO of fintech scale-up AdviceRobo and AI-boutique E-cology Innovations, and serves as a non-executive director at the neo-bank Ikano (IKEA) in Sweden and retail & sustainability analytics scale-up Ikano Insight. He previously served on the boards of ING Bank and KPN Mobile. Diederick's international PhD research focuses on Human-Centered AI for the Transformation to Banking 5.0. This involves understanding the impact of advanced technologies such as Gen AI and Blockchain, as well as next-generation behavioral finance, on the evolution of banking leadership, business models, strategies and applications. He is appointed visiting professor human-centrered AI in marketing management at the Jheronimus Academy for Data Science, a joint venture between The Eindhoven University of Technology and Tilburg University.
Karen Elliott
Karen Elliott is Chair of Practice in Finance and FinTech at Birmingham University Business School and Co-Director of the FinTech MSc Degree Programme. She has been named as ‘Standout #35 Women in FinTech Powerlist by Innovate Finance' for Policy and Governance 2019, 2020 and listed for the new Hubs (governance) category in 2021. Furthermore, part of the Kalifa Review commissioned by HMT to drive the future of Financial Services and FinTech. Karen co-leads FinTrust, Agency, and the UKFin Network+ projects (£1.2m/£3.5m/£2.5m EPSRC/UKRI) with Prof van Moorsel to optimise trustworthy, responsible, and ethical AI, engineered to deliver citizen transparency, fairness, and inclusion. Likewise, co-led Finclusion (Gates Foundation/Turing Institute £100k), which explored verifiable credentials for vulnerable groups, focusing on dementia in the digital economy following her mother’s diagnosis.
John Goedee
John Goedee received his doctorate from Tilburg University on the topic of implementing strategic change management. He has held various board and programme management positions within both the profit and nonprofit sectors, mostly at the interface of collaboration in the areas of safety, enforcement, healthcare, and national and local government. John has in-depth knowledge in the field of complex data-driven collaboration processes and has carried out programmes and supervised both national and international research projects to this end. John has several national and international publications to his name. John combines his scientific work with leading the Optimal Collaboration Foundation and technology organization INKIS.
Roger Leenders
Roger Leenders is Professor of Intra-Organizational Networks at the School of Social and Behavioral Sciences at Tilburg University and Data Science at Jheronimus Academy of Data Science, a joint venture between The Eindhoven University of Technology and Tilburg University. His research mainly focuses on the antecedents and consequences of networks in and of teams. A core research theme is the creativity of teams: what are the network drivers (and inhibitors) of the creative performance of teams? Before moving to Tilburg, Roger was Professor of Networks in Market and Product Innovation at the University of Groningen. He has a MSc degree in Econometrics and PhD in Sociology (ICS).
Notes
1 We acknowledge this brings limitations to the results of this research due to its default focus solely on accepted customers.
2 Advicerobo's applicant data collection tool is a software system designed to gather and compile information from individuals and entrepreneurs who are applying for financial products or services. This tool streamlines the process of collecting and organizing dynamic applicant data, making it easier for financial institutions to profile applicants, assess creditworthiness, make lending decisions, and manage the application process efficiently.
3 Based on the accepted loan applicant’s dataset throughout the results. Limitations are discussed in the final sections of this paper.
References
- Achtziger, A., M. Hubert, P. Kenning, G. Raab, and L. Reisch. 2015. “Debt out of Control: The Links Between Self-Control, Compulsive Buying, and Real Debts.” Journal of Economic Psychology 49:141–149.
- Agarwal, P., and M. Alam. 2020. “A Lightweight Deep Learning Model for Human Activity Recognition on Edge Devices.” Procedia Computer Science 167:2364–2373.
- Aitken, R. 2017. “‘All Data is Credit Data’: Constituting the Unbanked.” Competition & Change 21 (4): 274–300.
- Akkoç, S. 2012. “An Empirical Comparison of Conventional Techniques, Neural Networks and the Three Stage Hybrid Adaptive Neuro Fuzzy Inference System (ANFIS) Model for Credit Scoring Analysis: The Case of Turkish Credit Card Data.” European Journal of Operational Research 222 (1): 168–178.
- Almenberg, J., A. Lusardi, J. Säve-Söderbergh, and R. Vestman. 2021. “Attitudes Toward Debt and Debt Behaviour.” The Scandinavian Journal of Economics 123 (3): 780–809. https://doi.org/10.1111/sjoe.12419.
- Altman, E. I. 1968. “Financial Ratios, Discriminant Analysis and the Prediction of Corporate Bankruptcy.” The Journal of Finance 23 (4): 589–609.
- Altman, D. G., and J. M. Bland. 1994. “Diagnostic Tests 3: Receiver Operating Characteristic Plots.” BMJ: British Medical Journal 309 (6948): 188.
- Ang, J. S. 1991. “Small Business Uniqueness and the Theory of Financial Management.” Journal of Small Business Finance 1 (1): 1–13.
- Ang, J. S. 1992. “On the Theory of Finance for Privately Held Firms.” The Journal of Entrepreneurial Finance 1 (3): 185–203.
- Arner, D. W., R. P. Buckley, and D. A. Zetzsche. 2021. “Open Banking, Open Data, and Open Finance: Lessons from the European Union.” In Open Banking, edited by Linda Jeng, 21–69. Oxford: Oxford University Press.
- Arner, D. W., R. P. Buckley, D. A. Zetzsche, and R. Veidt. 2020. “Sustainability, FinTech and Financial Inclusion.” European Business Organization Law Review 21:7–35.
- Arráiz, I., M. Bruhn, and R. Stucchi. 2017. “Psychometrics as a Model to Improve Credit Information.” The World Bank Economic Review 30 (Supplement_1): S67–S76.
- Azma, N., M. Rahman, A. A. Adeyemi, and M. K. Rahman. 2019. “Propensity Toward Indebtedness: Evidence from Malaysia.” Review of Behavioural Finance 11 (2): 188–200.
- Baesens, B., D. Roesch, and H. Scheule. 2016. Credit Risk Analytics: Measurement Techniques, Applications, and Examples in SAS. John Wiley & Sons.
- Baesens, B., R. Setiono, C. Mues, and J. Vanthienen. 2003. “Using Neural Network Rule Extraction and Decision Tables for Credit-Risk Evaluation.” Management Science 49 (3): 312–329.
- Baker, T. H., and K. Judge. 2020. “How to Help Small Businesses Survive COVID-19.” Columbia Law and Economics Working Paper 620.
- Bakhtiari, S., R. Breunig, L. Magnani, and J. Zhang. 2020. “Financial Constraints and Small and Medium Enterprises: A Review.” Economic Record 96 (315): 506–523.
- Bandura, A. 1986. “The Explanatory and Predictive Scope of Self-Efficacy Theory.” Journal of Social and Clinical Psychology 4 (3): 359–373.
- Bandura, A. 2012. “On the Functional Properties of Perceived Self-efficacy Revisited.” Journal of Management 38 (1): 9–44.
- Banna, H., M. K. Hassan, and M. Rashid. 2021. “Fintech-based Financial Inclusion and Bank Risk-Taking: Evidence from OIC Countries.” Journal of International Financial Markets, Institutions and Money 75:101447.
- Bartolacci, F., A. Caputo, and M. Soverchia. 2020. “Sustainability and Financial Performance of Small and Medium Sized Enterprises: A Bibliometric and Systematic Literature Review.” Business Strategy and the Environment 29 (3): 1297–1309.
- Belk, R. W. 1984. “Three Scales to Measure Constructs Related to Materialism: Reliability, Validity, and Relationships to Measures of Happiness.” In Advances In Consumer Research, edited by T. Kinnear, 291–297. Provo, UT: Association for Consumer Research.
- Bell, E. J., P. Brennan, and R. Allen. 2001. Assessment of Higher Order Thinking Skills: A Discussion of the Data from the 2001 Random Sampling Exercise and a Workshop for Teachers. Queensland Board of Senior Secondary School Studies..
- Bergen, N., and R. Labonté. 2020. ““Everything is Perfect, and We Have no Problems”: Detecting and Limiting Social Desirability Bias in Qualitative Research.” Qualitative Health Research 30 (5): 783–792.
- Bernards, N. 2019. “The Poverty of Fintech? Psychometrics, Credit Infrastructures, and the Limits of Financialization.” Review of International Political Economy 26 (5): 815–838.
- Biallas, M., and F. O'Neill. 2020. Artificial Intelligence Innovation in Financial Services.
- Bocanet, A., O. Alpenidze, and O. Badran. 2021. “Business Analysis in Post-Pandemic era.” Academy of Strategic Management Journal 4:1–9.
- Brown, S., G. Garino, and K. Taylor. 2013. “Household Debt and Attitudes Toward Risk.” Review of Income and Wealth 59 (2): 283–304.
- Capon, N. 1982. “Credit Scoring Systems: A Critical Analysis.” Journal of Marketing 46 (2): 82–91.
- Carpenter, R. E., and B. C. Petersen. 2002. “Is the Growth of Small Firms Constrained by Internal Finance?” Review of Economics and statistics 84 (2): 298–309.
- Chen, P. Y., C. L. Chen, Y. C. Hsu, and W. Y. I. Tseng. 2020. “Fluid Intelligence is Associated with Cortical Volume and White Matter Tract Integrity Within Multiple-Demand System Across Adult Lifespan.” NeuroImage 212:116576.
- Chittenden, F., G. Hall, and P. Hutchinson. 1996. “Small Firm Growth, Access to Capital Markets and Financial Structure: Review of Issues and an Empirical Investigation.” Small Business Economics 8: 59–67.
- Cohen, J. 1988. “Set Correlation and Contingency Tables.” Applied Psychological Measurement 12 (4): 425–434.
- Dans, S. M., and H. R. Haberman. 2007. “Teen Financial Knowledge, Self-efficacy, and Behaviour: A Gendered View.” Journal of Financial Counseling and Planning 18 (2): 13. https://ssrn.com/abstract=222840.
- Dasewicz, A., J. Simon, and S. R. Ramanujam. 2020. “Financing Small Business is Critical for a Strong Post-Covid Recovery.” Center for Strategic and International Studies (CSIS).
- De Cnudde, S., J. Moeyersoms, M. Stankova, E. Tobback, V. Javaly, and D. Martens. 2019. “What Does Your Facebook Profile Reveal About Your Creditworthiness? Using Alternative Data for Microfinance.” Journal of the Operational Research Society 70 (3): 353–363.
- Demirel, P., and S. Parris. 2015. “Access to Finance for Innovators in the UK's Environmental Sector.” Technology Analysis & Strategic Management 27 (7): 782–808.
- Dew, J., and J. J. Xiao. 2011. “The Financial Management Behaviour Scale: Development and Validation.” Journal of Financial Counseling and Planning 22 (1): 43.
- Djeundje, V. B., J. Crook, R. Calabrese, and M. Hamid. 2021. “Enhancing Credit Scoring with Alternative Data.” Expert Systems with Applications 163:113766.
- Dlogosch, T. J., B. Klinger, and M. Frese. 2017. “Personality-based Selection of Entrepreneurial Borrowers to Reduce Credit Risk: Two Studies on Prediction Models in Low and High-Stakes Settings in Developing Countries.” Journal of Organisational Behaviour 39:612–628.
- Donnelly, G., R. Iyer, and R. T. Howell. 2012. “The Big Five Personality Traits, Material Values, and Financial Well-Being of Self-Described Money Managers.” Journal of Economic Psychology 33 (6): 1129–1142.
- Eggers, F. 2020. “Masters of Disasters? Challenges and Opportunities for MSMEs in Times of Crisis.” Journal of Business Research 116: 199–208.
- Elliott, K., K. Coopamootoo, E. Curran, P. Ezhilchelvan, S. Finnigan, D. Horsfall, M. Zhichao, et al. 2022. “Know Your Customer: Balancing Innovation and Regulation for Financial Inclusion.” Data and Policy 4: e34. https://doi.org/10.1017/dap.2022.23.
- Elliott, K., R. Price, P. Shaw, T. Spiliotopoulos, M. Ng, K. Coopamootoo, and A. van Moorsel. 2021. “Towards an Equitable Digital Society: Artificial Intelligence (AI) and Corporate Digital Responsibility (CDR).” Society 58 (3): 179–188. https://doi.org/10.1007/s12115-021-00594-8.
- Fawcett, J. 2005. “Criteria for Evaluation of Theory.” Nursing Science Quarterly 18 (2): 131–135.
- FCA (Financial Conduct Authority). 2019. “Guidance for Firms on the Fair Treatment of Vulnerable Customers.” Guidance Consultation GC19/3. https://www.fca.org.uk/.
- FCA (Financial Conduct Authority). 2021. Guidance for Firms on the Fair Treatment of Vulnerable Customers, FG21/1.
- FCA (Financial Conduct Authority). 2022. A New Consumer Duty Feedback to CP21/36 and Final Rules, Policy Statement PS22/9. https://www.fca.org.uk/.
- Fisher, R. A. 1936. “The use of Multiple Measurements in Taxonomic Problems.” Annals of Eugenics 7 (2): 179–188.
- Fuhrer, C., J. E. Solem, and O. Verdier. 2021. Scientific Computing with Python: High-Performance Scientific Computing with NumPy, SciPy, and Pandas. Packt Publishing.
- Ganster, D. C., H. W. Hennessey, and F. Luthans. 1983. “Social Desirability Response Effects: Three Alternative Models.” Academy of Management Journal 26 (2): 321–331.
- Garðarsdóttir, R. B., and H. Dittmar. 2012. “The Relationship of Materialism to Debt and Financial Well-Being: The Case of Iceland’s Perceived Prosperity.” Journal of Economic Psychology 33 (3): 471–481. https://doi.org/10.1016/j.joep.2011.12.008.
- Gerke, O., and A. Zapf. 2022. “Convergence Behaviour of Optimal Cut-Off Points Derived from Receiver Operating Characteristics Curve Analysis: A Simulation Study.” Mathematics 10 (22): 4206.
- Gibson, B. 1992. “Financial Information for Decision Making: An Alternative Small Firm Perspective.” The Journal of Entrepreneurial Finance 1 (3): 221–232.
- Goel, A., and S. Rastogi. 2023. “Credit Scoring of Small and Medium Enterprises: A Behavioural Approach.” Journal of Entrepreneurship in Emerging Economies 15 (1): 46–69.
- Goyal, K., and S. Kumar. 2021. “Financial Literacy: A Systematic Review and Bibliometric Analysis.” International Journal of Consumer Studies 45 (1): 80–105.
- Guariglia, A., X. Liu, and L. Song. 2011. “Internal Finance and Growth: Microeconometric Evidence on Chinese Firms.” Journal of Development Economics 96 (1): 79–94.
- Gupta, H., and M. K. Barua. 2018. “A Framework to Overcome Barriers to Green Innovation in MSMEs Using BWM and Fuzzy TOPSIS.” Science of the Total Environment 633:122–139.
- Hall, G. C., and P. J. Hutchinson. 1993. “A Probit Analysis of the Changes in the Financial Characteristics of Newly Quoted Small Firms, 1970–73 and 1980–83.” Small Business Economics 5:207–214.
- Hamilton, R. T., and M. A. Fox. 1998. “The Financing Preferences of Small Firm Owners.” International Journal of Entrepreneurial Behaviour & Research 4 (3): 239–248.
- Haultain, S., S. Kemp, and O. S. Chernyshenko. 2010. “The Structure of Attitudes to Student Debt.” Journal of Economic Psychology 31 (3): 322–330. https://doi.org/10.1016/j.joep.2010.01.003.
- Hendricks, M. K., and A. Budree. 2019. “Can a Mobile Credit-Scoring Model Provide Better Accessibility to South African Citizens Requiring Micro-Lending?” International Journal of Electronic Finance 9 (3): 157–169.
- Henley, W., and D. J. Hand. 1996. “AK-Nearest-Neighbour Classifier for Assessing Consumer Credit Risk.” Journal of the Royal Statistical Society: Series D (The Statistician) 45 (1): 77–95.
- Hlomane,. 2022. https://www.mzv.cz/pretoria/en/economic_and_commercial_information/czech_success_story_in_the_fintech_and_e.html.
- Ho, K. M. 2017. “Effect of Non-Linearity of a Predictor on the Shape and Magnitude of its Receiver-Operating-Characteristic Curve in Predicting a Binary Outcome.” Scientific Reports 7 (1): 10155.
- Huang, C. L., M. C. Chen, and C. J. Wang. 2007. “Credit Scoring with a Data Mining Approach Based on Support Vector Machines.” Expert Systems with Applications 33 (4): 847–856.
- Hughes, A. 1997. “Finance for MSMEs: A UK Perspective.” Small Business Economics 9:151–168.
- Hutchinson, J., and A. Xavier. 2006. “Comparing the Impact of Credit Constraints on the Growth of MSMEs in a Transition Country with an Established Market Economy.” Small business economics 27:169–179.
- Istrate, E., and J. Harris. 2017. “The Future of Work: The Rise of the Gig Economy.” National Association of Counties.
- Jiang, Z. Q., W. J. Xie, W. X. Zhou, and D. Sornette. 2019. “Multifractal Analysis of Financial Markets: A Review.” Reports on Progress in Physics 82 (12): 125901.
- Joji, N. A., and P. T. Raveendran. 2008. “Does Compulsive Buying Affect Credit Card Defaults?” Vision 12 (4): 23–32.
- Jordan, J., J. Lowe, and P. Taylor. 1998. “Strategy and Financial Policy in UK Small Firms.” Journal of Business Finance & Accounting 25 (1-2): 1–27.
- Kässi, O., and V. Lehdonvirta. 2018. “Online Labour Index: Measuring the Online gig Economy for Policy and Research.” Technological Forecasting and Social Change 137:241–248.
- Khare, A. 2014. “Money Attitudes, Materialism, and Compulsiveness: Scale Development and Validation.” Journal of Global Marketing 27 (1): 30–45.
- Khare, A. 2016. “Money Attitudes, Credit Card and Compulsive Buying Behaviour: A Study on Indian Consumers.” International Journal of Business Competition and Growth 5 (1-3): 49–71.
- Klapper, L., and A. Lusardi. 2020. “Financial Literacy and Financial Resilience: Evidence from Around the World.” Financial Management 49 (3): 589–614.
- LeCun, Y., Y. Bengio, and G. Hinton. 2015. “Deep Learning.” Nature 521 (7553): 436–444.
- Lee, T. S., and I. F. Chen. 2005. “A two-Stage Hybrid Credit Scoring Model Using Artificial Neural Networks and Multivariate Adaptive Regression Splines.” Expert Systems with Applications 28 (4): 743–752.
- Lessmann, S., B. Baesens, H. V. Seow, and L. C. Thomas. 2015. “Benchmarking State-of-the-Art Classification Algorithms for Credit Scoring: An Update of Research.” European Journal of Operational Research 247 (1): 124–136.
- Liberati, C., and F. Camillo. 2018. “Personal Values and Credit Scoring: New Insights in the Financial Prediction.” Journal of the Operational Research Society 69 (12): 1994–2005.
- Liu, X., T. Wang, W. Ding, Y. Liu, and Q. A. Xu. 2017. “A Credit Scoring Model Based on Alternative Mobile Data for Financial Inclusion.” In Proceedings of the 2017 Credit Scoring and Credit Control Conference (Vol. 30). Edinburgh, UK.
- Long, G., Y. Tan, J. Jiang, and C. Zhang. 2020. “Federated Learning for Open Banking.” In Federated Learning: Privacy and Incentive, 240–254. Cham: Springer International Publishing.
- Lopez-Gracia, J., and C. Aybar-Arias. 2000. “An Empirical Approach to the Financial Behaviour of Small and Medium Sized Companies.” Small business economics 14:55–63.
- Luo, C., D. Wu, and D. Wu. 2017. “A Deep Learning Approach for Credit Scoring Using Credit Default Swaps.” Engineering Applications of Artificial Intelligence 65:465–470.
- Lusardi, A. 2019. “Financial Literacy and the Need for Financial Education: Evidence and Implications.” Swiss Journal of Economics and Statistics 155 (1): 1–8.
- Lusardi, A., A. Hasler, and P. J. Yakoboski. 2021. “Building up Financial Literacy and Financial Resilience.” Mind & Society 20:181–187.
- Lusardi, A., and O. S. Mitchell. 2007. “Financial Literacy and Retirement Planning: New Evidence from the Rand American Life Panel.” Michigan Retirement Research Center Research Paper No. WP, 157. https://doi.org/10.2139/ssrn.1095869.
- Lusardi, A., and O. S. Mitchell. 2008. “Planning and Financial Literacy: How do Women Fare?” American Economic Review 98 (2): 413–417. https://doi.org/10.1257/aer.98.2.413.
- Lusardi, A., and O. S. Mitchell. 2011. “Financial Literacy and Planning: Implications for Retirement Wellbeing (No. w17078).” National Bureau of Economic Research.
- Mahoney, J., and R. Barrenechea. 2019. “The Logic of Counterfactual Analysis in Case-Study Explanation.” The British Journal of Sociology 70 (1): 306–338.
- Malekipirbazari, M., and V. Aksakalli. 2015. “Risk Assessment in Social Lending via Random Forests.” Expert Systems with Applications 42 (10): 4621–4631.
- Małkiński, M., and J. Mańdziuk. 2022. “A Review of Emerging Research Directions in Abstract Visual Reasoning.” Information Fusion.
- Martínez-Camblor, P., and J. C. Pardo-Fernández. 2019. “The Youden Index in the Generalized Receiver Operating Characteristic Curve Context.” The International Journal of Biostatistics 15 (1): 20180060.
- McKinsey. 2017. Accessed May 2023 https://www.mckinsey.com/˜/media/McKinsey/Industries/Financial%20Services/Our%20Insights/Data%20sharing%20and%20open%20banking/Data-sharing-and-open-banking.pdf.
- McKinsey. 2022. Accessed May 2023. https://www.mckinsey.com/business-functions/risk-and-resilience/our-insights/managing-and-monitoring-credit-risk-after-the-covid-19-pandemic.
- Meier, S., and C. Sprenger. 2007. Impatience and Credit Behaviour: Evidence from a Field Experiment.
- Mhlanga, D. 2021. “Financial Inclusion in Emerging Economies: The Application of Machine Learning and Artificial Intelligence in Credit Risk Assessment.” International Journal of Financial Studies 9 (3): 39.
- Moore, D. L. 2003. Survey of Financial Literacy in Washington State: Knowledge, Behaviour, Attitudes, and Experiences. Washington State Department of Financial Institutions.
- Moscalu, M., C. Girardone, and R. Calabrese. 2020. “MSMEs’ Growth Under Financing Constraints and Banking Markets Integration in the Euro Area.” Journal of Small Business Management 58 (4): 707–746.
- Muñoz-Murillo, M., P. B. Álvarez-Franco, and D. A. Restrepo-Tobón. 2020. “The Role of Cognitive Abilities on Financial Literacy: New Experimental Evidence.” Journal of Behavioural and Experimental Economics 84:101482.
- Norvilitis, J. M., M. M. Merwin, T. M. Osberg, P. V. Roehling, P. Young, and M. M. Kamas. 2006. “Personality Factors, Money Attitudes, Financial Knowledge, and Credit-Card Debt in College Students.” Journal of Applied Social Psychology 36 (6): 1395–1413. https://doi.org/10.1111/j.0021-9029.2006.00065.x.
- Nosić, A., and M. Weber. 2010. “How Riskily do I Invest? The Role of Risk Attitudes, Risk Perceptions, and Overconfidence.” Decision Analysis 7 (3): 282–301.
- Obviously.Ai. 2023. https://www.obviously.ai/post/machine-learning-model-performance
- O'Connor, G. E., C. E. Newmeyer, N. Y. C. Wong, J. B. Bayuk, L. A. Cook, Y. Komarova, C. Loibl, L. L. Ong, and D. Warmath. 2019. “Conceptualizing the Multiple Dimensions of Consumer Financial Vulnerability.” Journal of Business Research 100:421–430.
- OECD. 2012. Accessed May 2023. https://www.oecd.org/pisa/pisaproducts/46962580.pdf.
- OECD. 2023. Accessed May 2023. https://data.oecd.org/entrepreneur/enterprises-by-business-size.htm.
- O'Guinn, T. C., and R. J. Faber. 1989. “Compulsive Buying: A Phenomenological Exploration.” Journal of Consumer Research 16 (2): 147–157.
- Onay, C., and E. Öztürk. 2018. “A Review of Credit Scoring Research in the Age of Big Data.” Journal of Financial Regulation and Compliance 26 (3): 382–405.
- Ong, C. S., J. J. Huang, and G. H. Tzeng. 2005. “Building Credit Scoring Models Using Genetic Programming.” Expert Systems with Applications 29 (1): 41–47.
- Óskarsdóttir, M., C. Bravo, C. Sarraute, J. Vanthienen, and B. Baesens. 2019. “The Value of big Data for Credit Scoring: Enhancing Financial Inclusion Using Mobile Phone Data and Social Network Analytics.” Applied Soft Computing 74:26–39. https://doi.org/10.1016/j.asoc.2018.10.004.
- Parke, A., M. Griffiths, and P. Irwing. 2004. “Personality Traits in Pathological Gambling: Sensation Seeking, Deferment of Gratification and Competitiveness as Risk Factors.” Addiction Research & Theory 12 (3): 201–212. https://doi.org/10.1080/1606635310001634500.
- Paulhus, D. L. 1984. “Two-component Models of Social Desirable Responding.” Journal of Personality and Social Psychology 46 (3): 598–609.
- Paulhus, D. L. 2001. “Socially Desirable Responding: The Evolution of a Construct.” In The Role of Constructs in Psychological and Educational Measurement, edited by H. I. Braun, D. N. Jackson, and D. E. Wiley, 49–69. Lawrence Erlbaum.
- Pauls, C. A., and G. Stemmler. 2003. “Substance and Bias in Social Desirability Responding.” Personality and Individual Differences 35 (2): 263–275.
- Pew Research Center. 2019. https://www.pewresearch.org/search/gig+workers.
- Pham, T. H., K. Yap, and N. A. Dowling. 2012. “The Impact of Financial Management Practices and Financial Attitudes on the Relationship Between Materialism and Compulsive Buying.” Journal of Economic Psychology 33 (3): 461–470.
- Phau, I., and C. Woo. 2008. “Understanding Compulsive Buying Tendencies among Young Australians: The Roles of Money Attitude and Credit Card Usage.” Marketing Intelligence & Planning 26 (5): 441–458.
- Pirog, S. F., and J. A. Roberts. 2007. “Personality and Credit Card Misuse among College Students: The Mediating Role of Impulsiveness.” Journal of Marketing Theory and Practice 15 (1): 65–77.
- Ponchio, M. C., and F. Aranha. 2008. “Materialism as a Predictor Variable of Low Income Consumer Behaviour When Entering into Installment Plan Agreements.” Journal of Consumer Behaviour: An International Research Review 7 (1): 21–34.
- Rao, P., S. Kumar, M. Chavan, and W. M. Lim. 2023. “A Systematic Literature Review on SME Financing: Trends and Future Directions.” Journal of Small Business Management 61 (3): 1247–1277.
- Richins, M. L. 1992. “Media Images, Materialism, and What Ought to be: The Role of Social Comparison.” Advances in Consumer Research 19: 202–206.
- Richins, M. L. 2011. “Materialism, Transformation Expectations, and Spending: Implications for Credit use.” Journal of Public Policy & Marketing 30 (2): 141–156.
- Richins, M. L. 2017. “Materialism Pathways: The Processes That Create and Perpetuate Materialism.” Journal of Consumer Psychology 27 (4): 480–499.
- Richins, M. L., and S. Dawson. 1992. “A Consumer Values Orientation for Materialism and Its Measurement: Scale Development and Validation.” Journal of Consumer Research 19 (3): 303–316.
- Rishabh, K. 2022. “Can open Banking Substitute Credit Bureaus.” Working Paper.
- Robison, J. 2013. “How to Create a Culture of Organizational Wellbeing.” Gallup Business Journal.
- Robson, P. J., and R. J. Bennett. 2000. “MSME Growth: The Relationship with Business Advice and External Collaboration.” Small Business Economics 15:193–208.
- Saberi, M., M. S. Mirtalaie, F. K. Hussain, A. Azadeh, O. K. Hussain, and B. Ashjari. 2013. “A Granular Computing-Based Approach to Credit Scoring Modeling.” Neurocomputing 122:100–115.
- Sahay, M. R., M. U. E. von Allmen, M. A. Lahreche, P. Khera, M. S. Ogawa, M. Bazarbash, and M. K. Beaton. 2020. The Promise of FinTech: Financial Inclusion in the Post COVID-19 Era. International Monetary Fund.
- San Pedro, J., D. Proserpio, and N. Oliver. 2015, June. “MobiScore: Towards Universal Credit Scoring from Mobile Phone Data.” In International Conference on User Modeling, Adaptation, and Personalization, 195–207. Cham: Springer.
- Schisterman, E. F., N. J. Perkins, A. Liu, and H. Bondell. 2005. “Optimal cut-Point and its Corresponding Youden Index to Discriminate Individuals Using Pooled Blood Samples.” Epidemiology 16 (1): 73–81.
- Seaward, H. G., and S. Kemp. 2000. “Optimism Bias and Student Debt.” New Zealand Journal of Psychology 29 (1): 17–19.
- Šebestová, J., and W. Sroka. 2020. “Sustainable Development Goals and MSMEs Decisions: Czech Republic vs. Poland.” Journal of Eastern European and Central Asian Research (JEECAR) 7 (1): 39–50.
- Shema, A. 2019, January. “Effective Credit Scoring Using Limited Mobile Phone Data.” In Proceedings of the Tenth International Conference on Information and Communication Technologies and Development, 1–11.
- Snow, R., and E. Yalow. 1982. Handbook of Human Intelligence. London: Cambridge University Press.
- Squalli, J., and K. Wilson. 2014. “Intelligence, Creativity, and Innovation.” Intelligence 46: 250–257.
- Strömbäck, C., T. Lind, K. Skagerlund, D. Västfjäll, and G. Tinghög. 2017. “Does Self-Control Predict Financial Behaviour and Financial Well-Being?” Journal of Behavioural and Experimental Finance 14: 30–38.
- Struckell, E. M., P. C. Patel, D. Ojha, and P. Oghazi. 2022. “Financial Literacy and Self Employment – The Moderating Effect of Gender and Race.” Journal of Business Research 139: 639–653.
- Tan, T., and T. Q. Phan. 2018. “Social Media-Driven Credit Scoring: The Predictive Value of Social Structures.” SSRN 3217885.
- Tatbul, N., T. J. Lee, S. Zdonik, M. Alam, and J. Gottschlich. 2018. “Precision and Recall for Time Series.” Advances in Neural Information Processing Systems 31.
- Thomas, L. C., D. E. Allen, and N. Morkel-Kingsbury. 2002. “A Hidden Markov Chain Model for the Term Structure of Bond Credit Risk Spreads.” International Review of Financial Analysis 11 (3): 311–329.
- Tupes, E. C., and R. E. Christal. 1992. “Recurrent Personality Factors Based on Trait Ratings.” Journal of Personality 60 (2): 225–251.
- Upwork. 2023. https://www.upwork.com/blog/gen-z-workforce.
- Van Thiel, D., J. Goedee, and R. T. A. J. Leenders. 2023. “Leveraging Financial Personality for Inclusive Credit Scoring Amidst Global Volatility.” Journal of Risk Management in Financial Institutions 17 (1): 22–42.
- Van Thiel, D., and W. F. van Raaij. 2019. “Artificial Intelligence Credit Risk Prediction: An Empirical Study of Analytical Artificial Intelligence Models for Credit Risk Prediction in a Digital era.” Journal of Risk Management in Financial Institutions 12 (3): 268–286.
- Verbraken, T., C. Bravo, R. Weber, and B. Baesens. 2014. “Development and Application of Consumer Credit Scoring Models Using Profit-Based Classification Measures.” European Journal of Operational Research 238 (2): 505–513.
- Wang, G., J. Ma, L. Huang, and K. Xu. 2012. “Two Credit Scoring Models Based on Dual Strategy Ensemble Trees.” Knowledge-Based Systems 26:61–68.
- Watson, J. J. 2003. “The Relationship of Materialism to Spending Tendencies, Saving, and Debt.” Journal of Economic Psychology 24 (6): 723–739.
- Wei, Y., P. Yildirim, C. Van den Bulte, and C. Dellarocas. 2016. “Credit Scoring with Social Network Data.” Marketing Science 35 (2): 234–258. https://doi.org/10.1287/mksc.2015.0949.
- Wiginton, J. C. 1980. “A Note on the Comparison of Logit and Discriminant Models of Consumer Credit Behaviour.” Journal of Financial and Quantitative Analysis 15 (3): 757–770.
- World Bank Enterprise Surveys. 2023. https://www.enterprisesurveys.org/en/enterprisesurveys
- World Trade Organisation. The World Trade Report. 2016. “Levelling the Trading Field for SMEs.” https://www.wto.org/english/res_e/booksp_e/world_trade_report16_e.pdf.
- World Trade Organisation. The World Trade Report. 2023. “Re-Globalisation for a Secure, Inclusive and Sustainable Future.” https://www.wto.org/english/res_e/booksp_e/wtr23_e/wtr23_e.pdf.
- Xiao, H., Z. Xiao, and Y. Wang. 2016. “Ensemble Classification Based on Supervised Clustering for Credit Scoring.” Applied Soft Computing 43:73–86.
- Yang, S., and G. Berdine. 2017. “The Receiver Operating Characteristic (ROC) Curve.” The Southwest Respiratory and Critical Care Chronicles 5 (19): 34–36.
- Yang, S., L. Markoczy, and M. Qi. 2007. “Unrealistic Optimism in Consumer Credit Card Adoption.” Journal of Economic Psychology 28 (2): 170–185.
- Yuan, H., R. Y. Lau, W. Xu, Z. Pan, and M. C. Wong. 2018. Mining Individuals’ Behaviour Patterns from Social Media for Enhancing Online Credit Scoring. PACIS, 163.
- Zhang, Y., H. Jia, Y. Diao, M. Hai, and H. Li. 2016. “Research on Credit Scoring by Fusing Social Media Information in Online Peer-to-Peer Lending.” Procedia Computer Science 91 (1): 168–174.
- Zhang, E., and Y. Zhang. 2009. “F-Measure.” In Encyclopedia of Database Systems, edited by L. Liu, and M. T. Özsu. Boston, MA: Springer. https://doi.org/10.1007/978-0-387-39940-9_483.
