
 ?Mathematical formulae have been encoded as MathML and are displayed in this HTML version using MathJax in order to improve their display. Uncheck the box to turn MathJax off. This feature requires Javascript. Click on a formula to zoom.
Abstract
This paper studies the effect of Negative Interest Rates Policies (NIRP) on the performance of Eurozone Banks. To this end, we apply a stochastic frontier analysis (SFA) to a sample of 1446 banks from Eurozone countries for the time period 2010–2018 to explore how bank profit and cost efficiency are affected by NIRP. We find that NIRP has a positive effect on profit efficiency which is mainly attributed to banks’ efforts to counterbalance the squeezed interest margins by increasing their non interest income and we also demonstrate that smaller banks and banks facing higher competition are more incentivised to enhance their cost efficiency when they operate under NIRP.
1. Introduction
In the wake of the 2008 global financial crisis, a number of central banks attempted to stimulate their economies and boost inflation by lowering policy rates below zero. In 2014 the European Central Bank (ECB) reduced for the first time the deposit facility rate (DFR) below zero by 10 basis points and by September 2019 the DFR stood at minus 0.5%. The negative DFR implies that banks pay 0.5% per annum on the excess reserves they hold in the Eurosystem's deposit facility, potentially exerting pressure on their net interest margins. Banks are a crucial component of the monetary transmission process and consequently the impact of the Negative Interest Rates Policies (NIRP) on their performance is an extremely important research question from both an academic and policy perspective.Footnote1
The impact of NIRP on bank performance is a controversial topic, with conflicting results in the extant literature. As discussed later in the literature review, NIRP can have both negative and positive effects on bank performance, making the overall direction of the effect theoretically ambiguous. In the extant literature the impact of NIRP on bank performance has been examined using traditional profitability ratios such as return on equity (ROE), return on assets (ROA) or other financial statement data related to loan volume and profits.
In this paper, we take a different approach by employing frontier analysis to investigate the effect of negative interest rate on bank performance. Specifically, we use both profit and cost efficiency as measures of bank performance. By complementing the analysis of NIRP’s impact on profit efficiency with an examination of cost efficiency, we gain additional insights into how banks respond to NIRP.
There is an extended literature in banking that endorses the merits of frontier efficiency measures over simple accounting ratios for measuring banking performance (Arbelo, Arbelo-Perez, and Perez-Gomez Citation2020; Berger, Hasan, and Zhou Citation2009), and views banks as financial intermediaries that transform funds (inputs) to credit (output) to make a profit. Frontier efficiency measures are considered superior to the traditional accounting measures because they benchmark each bank’s relative performance against the ‘best practice frontier', providing a numerical score that allows for objective performance comparisons (Berger and Humphrey Citation1997; Berger and Mester Citation1997). Unlike a narrow focus on accounting outcomes such as profitability, these measures take into account both the inputs and outputs of the entire production process. In other words, unlike traditional accounting measures, frontier efficiency accounts for differences in managerial ability across banks in maximizing revenues and/or controlling costs (Berger, Hunter, and Timme Citation1993). Therefore, a plausible explanation for the conflicting results, documented in the literature, regarding the impact of NIRP on bank performance could be due to the use of traditional accounting measures as proxies of bank performance.
Bank profit efficiency is not a single dimensional concept and is driven by inefficiencies in both cost and revenue side. Note that a cost efficient bank is not necessarily also profit efficient. For instance, a bank could attain high cost efficiency attributed to various factors, such as large economies of scale, lower input prices and the business model employed with regards to the use of inputs that significantly contribute to cost minimization. Nevertheless, the same bank could adopt a poor pricing policy or a wrong product composition, resulting in a lower level of profit efficiency compared to its corresponding cost efficiency level. Therefore, both profit and cost efficiency are useful measures for understanding bank performance and providing additional insights into how banks respond to NIRP.
To achieve our aim, we use a sample of 1446 banks from all Eurozone countries spanning the years 2010–2018 and employ the Stochastic Frontier Analysis (SFA) to measure the profit and cost efficiency of the Eurozone banks. In particular, we use the Battese and Coelli (Citation1995) model which allows for the joint estimation of parameter values for the stochastic production function and the determinants of bank (in)efficiency in a single-step. The single-step SFA approach, as indicated by prior studies (Battese and Coelli Citation1995; Kumbhakar, Parmeter, and Zelenyuk Citation2022; Wang and Schmidt Citation2002), yields consistent estimates in contrast to the two-step approach. The model includes various bank and macroeconomic covariates as plausible determinants. An indicator variable that captures the enactment of NIRP is also included. This allows for comparisons of bank efficiency to be made between the period before the policy rate was lowered below zero and the subsequent period.
The principal findings are as follows. Unconventional monetary policy affects bank efficiency. Specifically, the reduction of the main policy rate below zero results in improved profit and cost efficiency for the Eurozone banks under consideration. Furthermore, an examination of the drivers of the positive correlation between NIRP and profit efficiency uncovers that the correlation hinges on the strategies adopted by banks to counteract their squeezed interest margins. We provide evidence that the favourable impact of NIRP on profit efficiency can be primarily attributed to the increase in banks’ non-interest income (e.g. fees), followed by a rise in securities investments. We also find that smaller banks and those facing higher competition are more motivated to enhance cost efficiency when operating under NIRP.
Our study contributes to the extant literature that investigates the impact of NIRP on bank performance. The results emanating from this literature are rather mixed. As we explain in more detail in Section 2, the first strand of the literature highlights the adverse effects of NIRP on bank performance. This is primarily attributed to the lower bound constraint on deposits that leads to a squeeze in the net interest margin (e.g. Borio, Gambacorta, and Hofmann Citation2017; Claessens, Coleman, and Donnelly Citation2017). In contrast, the second strand presents evidence suggesting that banks counterbalance or mitigate the negative effects on net interest margin by adopting alternative strategies. These strategies include increasing fees (Altavilla et al. Citation2019; Arce et al. Citation2018; Lopez, Rose, and Spiegel Citation2018), enhancing their risk profile (Arce et al. Citation2018; Boungou Citation2019) or experiencing positive effects on loan loss provisions (Altavilla, Boucinha, and Peydró Citation2018). We extend this literature by examining the effect of NIRP on bank efficiency, differentiating our approach from existing studies that primarily rely on accounting measures of bank performance. Our approach offers significant advantages over simple accounting ratios in gauging bank performance. In line with certain prior empirical studies, we find strong support for a positive association between NIRP and bank performance as measured by profit and cost efficiency.
The remainder of the paper proceeds as follows. Section 2 provides a literature background of the effects of NIRP on bank performance and of efficiency for measuring bank performance. Section 3 examines the methodology applied and the data used for the empirical analysis. Section 4 discusses results, Section 5 provides a robustness check of our model and the last section concludes and presents the implications of the study.
2. Background discussion
In this section, we first provide a review of the literature on the effects of NIRP on bank performance. Subsequently, we offer a brief discussion of the literature that utilizes efficiency as a measure for assessing bank performance.
2.1 NIRP effects
In the extant literature, the impact of NIRP on bank performance has been examined using traditional financial ratios and according to the empirical results so far there is no consensus as to whether the impact is positive or negative. Below we provide a literature review of the relevant studies.
Negative effects of NIRP may arise if banks are reluctant to pass through the negative policy rates to their deposit rates, particularly when constrained by a lower bound. Several studies emphasize the detrimental effects of NIRP on bank performance under such circumstances, underscoring the significance of the lower bound constraint on deposit rates. Borio, Gambacorta, and Hofmann (Citation2017) and Claessens, Coleman, and Donnelly (Citation2017) document that stickiness on deposit rates results in squeezed net interest rate margins, leading to a reduction in interest income and, consequently, a negative impact on profitability. Heider, Saidi, and Schepens (Citation2019) also claim that banks heavily reliant on deposit funding experience a more pronounced negative impact from NIRP. This is attributed to their inability or reluctance to pass on negative rates to depositors, resulting in a deterioration of their net worth.
Under this strand of literature, Eggertsson et al. (Citation2019) show theoretically and confirm empirically that negative policy rates do not pass through to retail household deposits and consequently negative rates tend to reduce bank profitability. In the same spirit, Abadi, Brunnermeier, and Koby (Citation2023) demonstrate that the decrease of interest rates below a certain threshold could lower bank net worth, increase funding costs and have negative effects on bank profitability. They show theoretically that if the policy rate falls below a certain threshold a further decrease of the policy rate can cause a deterioration of bank's net worth because the decline in bank’s net interest income outweighs the positive effect from an increase in capital gains. Finally, Acharya et al. (Citation2019) and Heider, Saidi, and Schepens (Citation2019) find that excessive risk taking can result in increased loan loss provisions and subsequently impaired profitability. They provide evidence that under NIRP, banks in search for higher yields tend to give credit to impaired firms, thus ending up taking more risk.
Nevertheless, there are several studies showing that banks, in an attempt to alleviate the adverse effects of NIRP on their performance, implement a range of strategies. These strategies are designed to either offset the negative impacts or, in some cases, enhance overall performance. Consequently, NIRP can lead to neutral or even positive effects on bank performance. For instance, Altavilla, Boucinha, and Peydró (Citation2018) use data from Eurozone banks and find that while NIRP negatively impacts interest income, this is counterbalanced by positive effects on loan loss provisions and non-interest income. Several studies (Arce et al. Citation2018; Grandi and Guille Citation2023; Lopez, Rose, and Spiegel Citation2018) suggest that banks offset losses in interest income and reduced interest margins by capital gains or through increases in fees.
The extant literature also identifies additional channels through which banks mitigate the adverse effects of NIRP on their performance. Banks may opt for safer assets by granting loans with shorter maturities and lower loan size to improve their capital ratios (Arce et al. Citation2018). Alternatively, they may improve their risk profile by focusing on better asset quality (Boungou Citation2019), deleverage their balance sheets, and invest in safer, more liquid assets (Bongiovanni et al. Citation2019). Another approach involves increasing lending through portfolio rebalancing from liquid assets to credit, aiming for higher yields and more risk (Bottero et al. Citation2019; Demiralp, Eisenschmidt, and Vlassopoulos Citation2019; Grandi and Guille Citation2023). Altavilla et al. (Citation2019) suggest that, in a NIRP environment, banks may strategically reallocate their assets by decreasing liquid assets to mitigate the relative increase in the cost of deposits.
To sum up, the literature findings regarding the impact of NIRP on bank performance are conflicting and in each study there are several factors that can contribute to the bank’s ability to counterbalance or not the adverse effects of NIRP on profitability. Note that none of the existing studies examines the effect of NIRP on either the cost or profit efficiency of banks.
In our empirical analysis, we assess the impact of NIRP on bank efficiency considering both profit and cost dimensions. More specifically, we investigate whether NIRP exert an adverse effect on profit efficiency and if this detrimental influence can be moderated by the adoption of alternative strategies by banks aimed at mitigating or ameliorating the challenges posed by NIRP to their performance. We also test whether NIRP have an adverse impact on cost efficiency and examine if this impact can be attributed to bank-specific characteristics.
2.2 Banking efficiency
Banking efficiency is based on the frontier analysis approach which identifies the best practice frontier and benchmarks institutions against it on the basis of their respective efficiency, and objectively provides a numerical efficiency value and ranking (Berger and Humphrey Citation1997). There are several methods for estimating the frontier efficiency, with data envelopment analysis (DEA) (Charnes, Cooper, and Rhodes Citation1978) being the most popular non-parametric approach and stochastic frontier analysis (SFA) (Aigner, Lovell, and Schmidt Citation1977) the most widely used parametric one (Abreu, Kimura, and Sobreiro (Citation2019), Sharma, Sharma, and Barua (Citation2013), Albert et al. (Citation2019) and Ahmad et al. (Citation2020)).
While SFA requires the correct specification of the frontier’s functional form and the distribution of the inefficiency term, it does accommodate statistical noise in the observed deviations from the estimated frontier, a flexibility not afforded by DEA. This distinction in the characteristics of the two estimators is further reflected in their asymptotic properties. Specifically, DEA exhibits a slower convergence rate compared to SFA, indicative of the curse of dimensionality that impacts non-parametric estimators (Simar and Wilson Citation2000). Another significant distinction lies in the fact that SFA allows modelling the determinants of inefficiency concurrently with the efficient frontier in single stage. In contrast, DEA employs the widely-used ‘two-stage' approach, where efficiency estimates are regressed on explanatory variables in a second-stage analysis. Despite the popularity of this two-stage approach in the empirical literature, an ongoing debate persists regarding the appropriate estimator for the second stage and the correct means for inference (Banker and Natarajan Citation2008; Chronopoulos, Girardone, and Nankervis Citation2015; Simar and Wilson Citation2007; Citation2011).
Banking efficiency is related to profit or/and cost efficiency and thus is not a single-dimensional concept. Profit efficiency refers to a bank’s ability to manage its resources in order to produce outputs and ultimately make profits. It is considered to be more appropriate to measure firm performance than traditional financial or accounting measures since it is resource based and encompasses a benchmarking approach by comparing firm performance to the most efficient firm (Arbelo, Arbelo-Perez, and Perez-Gomez Citation2020). Cost efficiency estimates how a bank improves its performance by adjusting its cost to produce the maximum output with the minimum input.
The main determinants of banking efficiency found in the extant literature can be categorized into 3 groups: (1) bank-specific variables such as size, market share, bank profitability, capital adequacy, liquidity, asset quality and risk, (2) macro and financial variables such as GDP growth rate, inflation, fiscal deficit and stock market capitalization and (3) regulatory variables such as supervisory regimes, banking regulations, regulatory and financial reforms.
Regarding the use of banking efficiency as a variable of interest, most studies in this area employ cost or/and profit efficiency scores as dependent variables in their model specifications and examine their determinants.
For example, studies in the extant literature examine how banking efficiency is affected by bank-specific characteristics (Molyneux, Reghezza, and Xie Citation2019; Servin, Lensink, and Ber Citation2012), regulatory reforms (Casu and Molyneux Citation2003; Holló and Nagy Citation2006), supervisory regimes (Chortareas, Girardone, and Ventouri Citation2012b; Barth et al. Citation2013), market structure (Chortareas, Kapetanios, and Ventouri Citation2016; Leroy and Lucotte Citation2016) and ownership structure (Altunbas, Evans, and Molyneux Citation2001; Bonin, Hasan, and Wachtel Citation2005). Also, other studies examine the relationship between bank efficiency and bank risk (Chortareas, Girardone, and Ventouri Citation2011; Fiordelisi, Marques-Ibanez, and Molyneux Citation2011) and how banking efficiency is affected by specific events such as the global financial crisis of 2008 (Fujii et al. Citation2018; Kolia and Papadopoulos Citation2020).
3. Methodology and data
3.1 Methodology
We employ the Stochastic Frontier Analysis (SFA), initially proposed by Aigner, Lovell, and Schmidt (Citation1977), to measure the banking efficiency of Eurozone banks in our sample. Specifically, we adopt the Battese and Coelli (Citation1995) approach that allows to simultaneously estimate both the parameters of the frontier function and the determinants of (in)efficiency in a single step. In contrast to the two-step approach, our single-step analysis yields consistent estimates (see Battese and Coelli Citation1995; Wang and Schmidt Citation2002). Our model specifies a bank’s profitability (or cost, as we will explore later) in terms of a deterministic kernel and two error terms. Formally, the profit frontier model can be written as:
(1)
(1)
(2)
(2)
(3)
(3)
where
is the natural logarithm of pre-tax profits of bank i at time t,
is a vector of input prices,
is a vector of outputs and
is a vector of parameters to be estimated. The first error component
is a one-sided error term, which captures inefficiency, and follows a truncated normal distribution. The second error component
is a two-sided error term intended to capture the effects of statistical noise. Moreover, we assume that each
is distributed independently from each
. The term
is a vector of variables which may influence the efficiency of banks,
is a vector of unknown parameters to be estimated and k
is defined by the truncation of the normal distribution with zero mean and variance
such that the point of truncation is
(Battese and Coelli Citation1995). The SFA approach maintains that inefficiencies,
, reduce bank profits below the stochastic frontier or best practice levels. That is, in case
the bank maximizes its profits, whereas when
the bank operates below the frontier (i.e. it suffers from inefficiency). Profit efficiency, denoted as EFFit, is obtained from expression (3) and ranges from 0 to 1, with 1 indicating full efficiency.
The profit frontier is estimated in terms of outputs and input prices under the alternative profit efficiency concept (Berger and Mester Citation1997).Footnote2 Under this concept, efficiency is measured by how close a bank comes to earning maximum profits taking output levels and input prices as given while letting output prices free to vary and affect profits.
Inputs and outputs are selected under the intermediation approach (Sealey Jr and Limdley Citation1977) as in most studies that investigate the effects of regulatory policies on banking efficiency. According to this approach, banks are perceived as financial intermediaries that transfer financial resources from agents with fund surplus to those with fund deficit, by using deposits, labour and capital to produce loans and other earning assets (Chortareas, Girardone, and Ventouri Citation2013). We assume that banks have 3 outputs (Q): Total Loans (Q1), Other Earning Assets (Q2) and Non-Interest Income (Q3). Following Clarks and Siems (Citation2002) and Lozano-Vivas and Pasiouras (Citation2010), among others, we use Q3 (non-interest income) as a proxy for banks’ off-balance sheet (OBS) activity.Footnote3 Given that a substantial portion of banking activities occurs off-balance sheet, omitting these transactions from our analysis could result in a mischaracterization of the frontier function, potentially introducing bias into efficiency estimates. Such bias may unfairly penalize banks that are heavily involved in OBS activities.
Regarding inputs, we adopt the common practice under the intermediation approach and assume that banks use deposits, labour and capital. Given the input selection, we use the following 3 input prices: Cost of funds calculated as the ratio of interest expense to total deposits (W1), labour cost calculated as the ratio of personnel expenses to total assets (W2) and operating cost calculated by dividing operating expenses (excluding personnel expenses) by fixed assets (W3). We also include Total Equity (EQ) in the frontier function as a proxy for risk preferences (Andries and Ursu Citation2016; Gaganis and Pasiouras Citation2013; Lozano-Vivas and Pasiouras Citation2010).
To estimate the inefficiency model, as presented in Equation (2), specific variables were selected as determinants of inefficiency. NIRP is a dummy variable indicating the existence of negative policy rates and has a value of 0 for the pre NIRP period (2010–2013) and a value of 1 for the period (2014–2018). Following recent studies, GDP per capita is selected to control for macroeconomic conditions.Footnote4 The variable CONC is a measure of banking concentration to control for cross-country differences in the national structure and competitive conditions of the banking sector (Andries and Ursu Citation2016).Footnote5 Four bank-specific variables are selected as relevant to the transmission mechanism of NIRP. These variables are Total Capital Ratio to reflect bank capital adequacy (CAP), Net Interest Margin (NIM),Footnote6 a risk variable calculated as Loan Loss Provisions/Total Loans (RISK) and the size of the bank in terms of Total assets (SIZE).Footnote7 Also, a time trend T is included to account for technological changes (T = 1 for 2010, T = 2 for 2011 … .T = 9 for 2018).
We use the multiproduct-translog specification, as in several recent studies (e.g. Andries and Ursu Citation2016; Gaganis and Pasiouras Citation2013; Safiullaha and Shamsuddinb Citation2019) which results in the following frontier model:
(4)
(4)
Profit, cost of funds (W1) and labour cost (W2) are normalized by operating cost (W3) to ensure the linear homogeneity in input prices. To examine the determinants of inefficiency, uit is specified as follows:
(5)
(5)
3.2. Data
The empirical analysis utilizes data sourced from the S&P Market Intelligence (MI) and macroeconomic variables retrieved from Eurostat. We select institutions subject to Minimum Reserves Requirements, classified as ‘Credit Institutions' with the country of origin listed as ‘EURO AREA' on the ECB website.
We exclude those banks with missing, negative or zero values for inputs or outputs or missing values for any other variable used in the model. Finally, we trim the two variables (Loan Loss Provisions and Total Capital Ratio) between the 5th and 95th percentile to remove outliers. The final sample consists of an unbalanced dataset of 10,851 observations and comprises 1,446 banks from the Eurozone countries for which data for at least 4 years are available during the 2010–2018 period. The time span 2010–2018 was selected to achieve equal number of years before and after 2014 when DFR turned negative for the first time. In Table , we present some descriptive information and summary statistics of the variables used in the model.
Table 1. Descriptive information and summary statistics.
Figure depicts the mean values of deposits, loans and other earning assets per year. We notice that the values of these values increased after 2014 when the first cut of the deposit facility rate took place. Based on these values, it appears that banks continued their main operation of accumulating deposits and granting loans or investing in securities, without any significant disturbance due to the NIRP. Figure plots Loan Loss Provisions for the period 2010-2018. Loan Loss Provisions do not display an upward trend after 2014 suggesting that banks did not grant loans to more risky clients because of the NIRP.
Figure 1. Average deposits, loans and other earning assets per year.
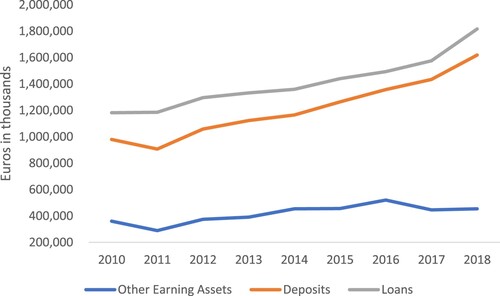
Figure 2. Average loan loss provisions per year.
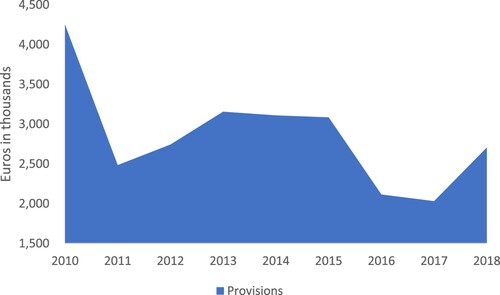
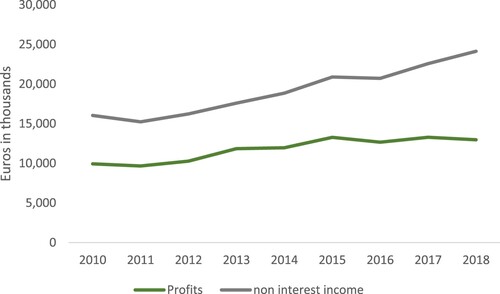
Figure plots the NIM for the time period 2010–2018. In line with previous studies, the graph shows that the NIM has indeed been squeezed by negative interest rate policies. Figure plots non-interest income and profits per year. Profits display an upward trend after the implementation of NIRP and the graph provides some preliminary evidence that the increase in profits can be attributed to non-interest income such as fees. Overall, the trends depicted in the graphs offer tentative evidence that the margin squeeze following NIRP does not appear to be detrimental to performance of banks operating in the Eurozone.
Figure 3. Average NIM per year.
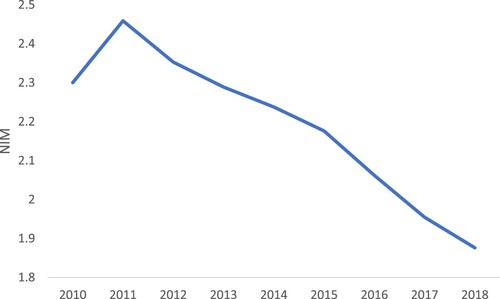
Figure 4. Average non-interest income and profits per year.
4. Results
Table presents the results of estimating Equations (4) and (5) simultaneously in a single step using the Battese and Coelli (Citation1995) approach. All parameter estimates are statistically significant at a confidence level of at least 5%. The Gamma estimate, calculated as /
, shows the proportion of total variance (
) that is attributed to the inefficiency model variance (
). Here, the gamma estimate is close to 1, indicating that the inefficiency effects are likely to be highly significant for our analysis (Battese and Coelli Citation1995).
Table 2. Estimated parameters of the Profit efficiency model.
Mean efficiency for the whole sample is 0.68 which is comparable to other studies (e.g. Gaganis and Pasiouras Citation2013; Lozano-Vivas and Pasiouras Citation2010; Pasiouras, Tanna, and Zopounidis Citation2009). By examining the mean efficiencies per year shown in Table , we can see that profit efficiency was relatively stable in the first years following the implementation of NIRP (2014-2018). This is a first indication that NIRP did not negatively affect banks’ profit efficiency. This indication is also supported by the negative sign of NIRP. The negative sign implies that NIRP has a positive effect on profit efficiency, as we will explain more thoroughly below.
Table 3. Mean profit and cost efficiency per year.
The estimated coefficients of the frontier estimation, as and bs, are hard to interpret under the translog specification and because of this, they are not presented in most papers. However, if we want to make a rough interpretation, we can look at the mean elasticities of inputs and outputs (logged and normalized as in (4)) presented in Table . It seems that Labour Cost and Loans have the largest impact on Profits, which is sensible since higher labour cost implies higher labour productivity and efficiency and high loan volumes result in higher interest income.
Table 4. Mean elasticities per input price or output.
Turning to the coefficient estimates of the inefficiency model, we see that the coefficient on NIRP, the variable of interest, enters the model negatively and is statistically significant at the 1% level. The negative sign on the coefficient and the corresponding confidence interval implies that the presence of NIRP decreases profit inefficiency or, conversely, increases profit efficiency.
We also control for macroeconomic conditions and the market structure of the banking sector in each country included in our analysis. In line with prior studies (Andries and Ursu Citation2016; Gaganis and Pasiouras Citation2013), both GDP per capita and CONC enter the inefficiency model with negative and statistically significant coefficients. Regarding our bank-specific control variables, SIZE, NIM and CAP enter the model with a negative and statistically significant coefficient, while RISK enters the regression with a positive and statistically significant coefficient.
Focusing on the bank-specific variables, our results could be intuitively explained as follows. NIM is expected to positively affect bank efficiency because it is an indication of how efficiently the bank transforms deposits into loans and accumulates profits by this procedure. With regards to CAP and SIZE, larger banks and banks with high capital adequacy tend to be more profit efficient due to larger economies of scale and lower cost of funding respectively. Finally in relation to RISK, profit efficiency is expected to decrease in case of high loan loss provisions which have a direct negative impact on profit accumulation.
Our results so far suggest that negative interest rates do not have detrimental effects on bank performance. Next, we investigate whether banks counterbalance the squeezed net interest margins by adopting alternative strategies. To this end, we examine three such strategies. First, we consider the case in which banks boost their income through fee-generating activities to offset the impact of negative interest rates on their net interest margins. In order to do so, we interact fee income (FEES) with NIRP and incorporate this term in Equation (5). The results are presented in column 1 of Table . As in Table , the coefficient on NIRP enters negatively and significantly. The coefficient on the interaction term also enters the regression negatively and significantly. This suggests that banks that successfully boost fee income through fee-generating activities amid the introduction of NIRP tend to enhance their profit efficiency.
Table 5. Estimated parameters of the Profit efficiency models.
Second, we investigate whether banks that increase their securities portfolio can moderate the effect of NIRP on their profit efficiency. More specifically, we use the size of a bank’s securities portfolio (SEC), and we interact it with NIRP and include it in Equation (5). The results are tabulated in column 2 of Table . The negative and statistically significant coefficient associated with the interaction term in the model suggests that banks adopting this strategy during the introduction of NIRP are likely to see improvements in their profit efficiency.
Third, we investigate whether changes in bank liquidity creation could moderate the effect of NIRP on their profit efficiency. Banks’ pivotal role in the economy involves creating liquidity, primarily by funding less liquid assets using more liquid liabilities (Berger and Bouwman Citation2009). Recent evidence suggests that the response of bank lending to a negative policy rate depends on their funding structure (Eggertsson et al. Citation2019). To account for these dynamics we define liquidity creation (LIC) as a ratio of loans (relatively illiquid assets) to deposits (relatively liquid liabilities). Subsequently, we interact LIC with NIRP and include it in Equation (5), with the results reported in column 3 of Table . The coefficient on the interaction term is positive and statistically significant. This result suggests that following the implementation of NIRP, which compressed banks’ net interest margins, those banks that adjusted their liquidity creation by reducing lending funded by deposits experienced a positive shift in their profit efficiency. To further shed light on this relationship and the fact that banks, for accumulating profits, turn to other strategies than generating income through interests during NIRP, we replace LIC with NIM, which proxies for the profits generated from banks’ financial intermediation activities, and re-estimate Equation (5). The results of this analysis are presented in column 4 of Table . Although the coefficient on NIRP is similar to that tabulated in Table in terms of significance and magnitude, the coefficient on the interaction term is not statistically significant.
Concluding, the empirical evidence suggests that the positive effect of NIRP on profit efficiency can be attributed mainly to banks’ efforts to moderate the negative NIRP effects on their profitability by adopting alternative strategies, other than the core profit-generating activity of loan funding by deposits. We document that banks improve their performance by increasing their fees income and their investments in securities. In this regard, they intend to counterbalance the squeezed net interest income via increasing their non interest income instead and to mitigate the increased cost of holding deposits due to negative rates. This obviously leads to improved profit efficiency and increased profits.
5. Cost efficiency
Our results thus far suggest that NIRP has a positive effect on the profit efficiency of banks. To gain a deeper understanding of the effects of NIRP we also employ the concept of cost efficiency. Cost efficiency provides an estimate of how efficiently a bank improves its performance by adjusting its cost to produce a given level of output with the minimum input. Thus, investigating NIRP effects on cost efficiency could provide additional insight on how banks react in response to squeezed interest margins and complement our analysis so far.
The cost function uses essentially the specification of the profit function as presented in Equations (4) and (5) with the following alterations. PROFIT is replaced by COST, which is calculated as the sum of the interest and operating expenses and the inefficiency term becomes positive. The explanatory variables of the model remain unaltered. Estimation of the cost efficiency model produces an estimate of cost efficiency (CEFF) for all banks in the sample, which encompasses a combination of two types of inefficiencies. Allocative inefficiencies, due to suboptimal reactions to changes in input prices, and technical inefficiencies arising from excessive use of inputs to produce the observed output bundle. Thus, for example a CEFF of 0.9 would mean that a bank uses 90 percent of its resources efficiently relative to a best-practice bank. The estimated coefficients of the cost inefficiency model are presented in Table , while the mean of the efficiency scores per year are tabulated in Table together with profit efficiency scores.
Table 6. Estimated parameters of the cost inefficiency model.
The mean cost efficiency of the entire sample is 0.9, a number comparable to other studies (Lozano-Vivas and Pasiouras Citation2010; Maudos and Pastor Citation2003; Safiullaha and Shamsuddinb Citation2019) and it seems to be stable without significant variation after 2014. Focusing on NIRP, the variable of interest, the relevant coefficient is both negative and statistically significant at the 1% significance level. Consequently, the presence of NIRP seems to positively affect both bank cost and profit efficiency. The remaining variables enter the inefficiency model with statistical significance, at least at the 10% significant level. The variables T, GDP, NIM and CAP seem to exert the same effects on cost inefficiency as on profit inefficiency, since they exhibit the same coefficient signs in both specifications. The variables CONC, SIZE and RISK have opposite signs compared to the profit inefficiency model as presented in Table . Bank concentration (CONC) and SIZE seem to increase cost inefficiency, whereas RISK decreases it. These results suggest that banks operating in less competitive markets, as proxied by a concentration measure, are more immune to the adverse NIRP effects on interest margins and therefore are less incentivised to improve their cost efficiency. Following Huljak, Martin, and Moccero (Citation2019), the negative effect of size on cost efficiency could be explained by the fact the large banks tend to have more complex business models that are less cost efficient and put more emphasis on market power rather than on cost minimization. Also large banks typically face higher monitoring and screening costs for retaining their large loan portfolios. Regarding RISK, banks with large provisions face serious impediments with regards to their profitability due to higher funding costs. Thus, the enhancement of their cost efficiency may be a way to counterbalance the adverse effects of worse asset quality.
To shed more light on the relationship between NIRP and cost efficiency we extend our basic model presented in Table by using additional specifications that, capture interactions of the NIRP dummy with the following explanatory variables: RISK, SIZE, and CONC. The results are presented in Table .
Table 7. Estimated parameters of the cost efficiency models.
The coefficients of the interaction terms presented in columns 2 and 3 of Table are statistically significant, indicating that the effect of NIRP on cost inefficiency depends on bank size and bank concentration. More specifically, the interaction terms of SIZE and CONC with NIRP exhibit a positive sign, as presented in columns 2 and 3 respectively. This results imply that under NIRP banks operating in markets of higher concentration are not urged to moderate the negative NIRP effects by increasing their cost efficiency due to lack of competition. Moreover, the sign of the interaction term between SIZE and NIRP suggests that also larger banks are less motivated to increase their cost efficiency during the NIRP period. Regarding the RISK variable, the coefficient of its interaction term with NIRP is not statistically significant as shown in column 1 of Table . Therefore, no conclusions could be drawn with respect to any potential effects on cost efficiency.
Concluding, the empirical analysis suggests that under NIRP smaller banks and banks facing higher competition are more inclined to increase their cost efficient. The fact that the adopted specification produces efficiency scores both in terms of profit and cost efficiency that are comparable to the related literature ensures the validity of our model. Also, the variable of NIRP has a negative sign under both alternatives, strengthening the conclusion that the existence of NIRP positively affects bank efficiency as a measure of bank performance.
6. Conclusion
NIRP have been applied by Central Banks as a monetary policy tool in order to mitigate the effects of the 2008 global financial crisis. Banks have a prominent role in the transmission of monetary policy to the real economy and consequently a crucial question occurs regarding how bank performance is affected under NIRP.
There is extensive literature on the implications of the NIRP on bank performance. However, the relevant studies investigate these effects by using purely financial or accounting indicators ignoring how efficiently a bank uses its resources and its relative performance against its peers. This paper aims at filling this literature gap by using bank efficiency as a more holistic approach to study the effects of NIRP on bank performance.
Using a sample of 1,446 banks from the Eurozone countries during the 2010–2018 period, we apply stochastic frontier analysis to get profit and cost efficiencies scores in a single step by allowing banking efficiency to be directly influenced by specific firm and country attributes. We find that NIRP increase profit efficiency and we suggest that this positive effect is attributed to banks’ efforts to mitigate the squeezed net interest margins by increasing their non interest income and their investments in securities. Furthermore, we document that smaller banks and banks facing higher competition are more incentivised to enhance their cost efficiency when they operate under NIRP.
One limitation of the present study is that it concentrates solely on Eurozone banks, excluding those from countries such as Sweden, Japan, Switzerland, and Denmark where monetary authorities have also implemented NIRP. A compelling avenue for future research would involve investigating how Eurozone banks, particularly those most impacted by NIRP, have adapted to the substantial rise in ECB interest rates that commenced in 2022. This broader exploration could offer valuable insights into the nuanced responses of Eurozone banks to changing monetary conditions.
From a policy standpoint, the enhancement of a bank's (cost) efficiency under NIRP is a favourable outcome and warrants consideration by policymakers in their assessments of monetary policy effectiveness. However, the empirical discovery that banks alleviate squeezed net interest margins by augmenting investments in securities implies potential unintended consequences. This approach may pose a risk to banks’ solvency and financial stability if the increased purchase of securities elevates interest rate risk, and exposes banks to potential mark-to-market losses, especially in a high-interest-rate environment. Policymakers should therefore weigh the positive impact on profit efficiency against these potential risks when evaluating the overall implications of NIRP.
Disclosure statement
No potential conflict of interest was reported by the author(s).
Additional information
Notes on contributors
Panagiota Siameti
Panagiota Siameti is a Risk Manager Officer at the Central Bank of Greece and a PhD student in Finance at the Department of Economics, National and Kapodistrian University of Athens. Her research interests are Empirical Banking and Monetary Policy.
Dimitris K. Chronopoulos
Dimitris K. Chronopoulos is a professor of Banking & Finance at the University of St Andrews Business School. His primary research interests lie in the areas of financial intermediation, empirical corporate finance, and stock return predictability. His work has been published in the Journal of Corporate Finance, Journal of Economic Geography and Journal of Empirical Finance among others.
George Dotsis
George Dotsis is an Associate Professor of Finance at the Department of Economics, University of Athens. His research interests are in asset pricing and banking. His work has been published in the Journal of Banking and Finance, Journal of Empirical Finance and Journal of Futures Markets among others.
Notes
1 In July 2009 Riksbank, Sweden's central bank, became the first to move its policy rates below zero. Subsequently, policy rates were also lowered below zero in Denmark (July 2012), Switzerland (January 2015) and Japan (February 2016).
2 There is also the standard profit function where profit frontier is specified in terms of input and output prices. In this latter concept output quantities are free to vary. We choose to apply the alternative concept because, according to Berger and Mester (Citation1997), it is preferable where there are substantial differences in the banking services quality and when output markets are not perfectly competitive
3 The variable Other Earning Assets (Q2) is proxied by the variable Total Securities which is available in our database.
4 GDP refers to GDP per capita of each bank’s country of origin per year
5 CONC is the Percentage share of the three largest banks, ranked according to assets, to the sum of the assets of all the banks in that banking system of each country at year t.
6 NIM is calculated as Net Interest Income/Average Assets.
7 SIZE is an ordinal variable taking the following values: 1 if 0<total assets ≤1bn, 2 if 1<total assets ≤10bn and 3 if 10<total assets.
References
- Abadi, J., M. Brunnermeier, and Y. Koby. 2023. “The Reversal Interest Rate.” American Economic Review 113 (8): 2084–2120. https://doi.org/10.1257/aer.20190150
- Abreu, E., H. Kimura, and V. Sobreiro. 2019. “What is Going on with Studies on Banking Efficiency?” Research in International Business and Finance 47: 195–219. https://doi.org/10.1016/j.ribaf.2018.07.010
- Acharya, V., T. Eisert, C. Eufinger, and C. Hirsch. 2019. “Whatever it Takes: The Real Effects of Unconventional Monetary Policy.” The Review of Financial Studies 32 (9): 3366–3411. https://doi.org/10.1093/rfs/hhz005
- Ahmad, N., A. Naveed, S. Ahmad, and I. Butt. 2020. “Banking Sector Performance, Profitability and Efficiency: A Citation-Based Systematic Literature Review.” Journal of Economics 34: 185–218.
- Aigner, D. J., C. A. K. Lovell, and P. Schmidt. 1977. “Formulation and Estimation of Stochastic Frontier Production Function Models.” Journals of Econometrics 6 (1): 21–37. https://doi.org/10.1016/0304-4076(77)90052-5
- Albert, N., M. Elmofty, I. Walied, and R. Sami. 2019. “Banking Efficiency: Concepts, Drivers, Measures, Literature and Conceptual Model.” Working Paper.
- Altavilla, C., M. Boucinha, and J.-L. Peydró. 2018. “Monetary Policy and Bank Profitability in a low Interest Rate Environment.” Economic Policy 33: 531–586.
- Altavilla, C., L. Burlon, M. Giannetti, and S. Holton. 2019. “Is There a Zero Lower Bound? The Effects of Negative Policy Rates on Banks and Firms.” ECB, Working Paper Series, No 2289.
- Altunbas, Y., L. Evans, and P. Molyneux. 2001. “Bank Ownership and Efficiency.” Journal of Money Credit and Banking 33 (4): 926–954. https://doi.org/10.2307/2673929
- Andries, M., and G. Ursu. 2016. “Financial Crisis and Bank Efficiency: An Empirical Study of European Banks.” Economic Research Journal 29: 485–497.
- Arbelo, A., M. Arbelo-Perez, and P. Perez-Gomez. 2020. “Profit Efficiency as a Measure of Performance and Frontier Models: A Resource-Based View.” Businesss Research Quartely 24: 143–159.
- Arce, O., M. Garcia-Posada, S. Mayordomo, and S. Ongena. 2018. “Adapting Lending Policies When Negative Interest Rates hit Banks’ Profits.” Working Papers 1832. Banco de España.
- Banker, R. D., and R. Natarajan. 2008. “Evaluating Contextual Variables Affecting Productivity Using Data Envelopment Analysis.” Operational Research 56 (1): 48–58. https://doi.org/10.1287/opre.1070.0460
- Barth, J.-R., C. Lin, Y. Ma, and J. Seade. 2013. “Do Bank Regulation, Supervision and Monitoring Enhance or Impede Bank Efficiency?” SSRN Electronic Journal 37: 2879–2892.
- Battese, G. E., and T. J. Coelli. 1995. “A Model for Technical Inefficiency Effects in a Stochastic Frontier Production Function for Panel Data.” Empirical Economics 20 (2): 325–332. https://doi.org/10.1007/BF01205442
- Berger, A. N., and C. H. S. Bouwman. 2009. “Bank Liquidity Creation.” The Review of Financial Studies 22 (9): 3779–3837. https://doi.org/10.1093/rfs/hhn104
- Berger, A. N., I. Hasan, and M. Zhou. 2009. “Bank Ownership and Efficiency in China: What Will Happen in the World's Largest Nation?” Journal of Banking and Finance 33 (1): 113–130. https://doi.org/10.1016/j.jbankfin.2007.05.016
- Berger, A. N., and D. B. Humphrey. 1997. “Efficiency of Financial Institutions: International Survey and Directions for Future Research.” European Journal of Operational Research 98 (2): 175–212. https://doi.org/10.1016/S0377-2217(96)00342-6
- Berger, A. N., W. C. Hunter, and S. G. Timme. 1993. “The Efficiency of Financial Institutions: A Review and Preview of Research Past, Present and Future.” Journal of Banking & Finance 17 (2-3): 221–249. https://doi.org/10.1016/0378-4266(93)90030-H
- Berger, A., and L. Mester. 1997. “Inside the Black box: What Explains Differences in the Efficiency of Financial Institutions?” Journal of Banking and Finance 21 (7): 895–947. https://doi.org/10.1016/S0378-4266(97)00010-1
- Bongiovanni, A., A. Reghezza, R. Santamaria, and J. Williams. 2019. “Do Negative Interest Rates Affect Bank Risk-Taking?” Bangor Business School, Working Papers 19012.
- Bonin, J. P., I. Hasan, and P. Wachtel. 2005. “Bank Performance, Efficiency and Ownership in Transition Countries.” Journal of Banking and Finance 29 (1): 31–53. https://doi.org/10.1016/j.jbankfin.2004.06.015
- Borio, C., L. Gambacorta, and B. Hofmann. 2017. “The Influence of Monetary Policy on Bank Profitability.” International Finance 20 (1): 48–63. https://doi.org/10.1111/infi.12104
- Bottero, M., C. Minoiu, J. Peydro, A. Polo, A. Presbitero, and E. Sette. 2019. “Negative Monetary Policy Rates and Portfolio Rebalancing: Evidence from Credit Register Data.” IMF, Working Papers. 19/44.
- Boungou, W. 2019. “Negative Interest Rates, Bank Profitability and Risk-Taking.” Science Po, OFCE, Working Paper No 10.
- Casu, B., and P. Molyneux. 2003. “A Comparative Study of Efficiency in European Banking.” Applied Economics 35 (17): 865–1876. https://doi.org/10.1080/0003684032000158109
- Charnes, A., W. W. Cooper, and E. Rhodes. 1978. “Measuring Efficiency of Decision Making Units.” European Journal of Operations Research 2 (6): 429–444. https://doi.org/10.1016/0377-2217(78)90138-8
- Chortareas, G. E., C. Girardone, and A. Ventouri. 2011. “Financial Frictions, Bank Efficiency and Risk: Evidence from the Eurozone.” Journal of Business Finance & Accounting 8: 292–302.
- Chortareas, G. E., C. Girardone, and A. Ventouri. 2012. “Bank Supervision, Regulation, and Efficiency: Evidence from the European Union.” Journal of Financial Stability 8 (4): 292–302. https://doi.org/10.1016/j.jfs.2011.12.001
- Chortareas, G. E., C. Girardone, and A. Ventouri. 2013. “Financial Freedom and Bank Efficiency: Evidence from the European Union.” Journal of Banking & Finance 37 (4): 1223–1231. https://doi.org/10.1016/j.jbankfin.2012.11.015
- Chortareas, G., G. Kapetanios, and A. Ventouri. 2016. “Credit Market Freedom and Cost Efficiency in US State Banking.” Journal of Empirical Finance 37: 173–185. https://doi.org/10.1016/j.jempfin.2016.03.002
- Chronopoulos, D. K., C. Girardone, and J. C. Nankervis. 2015. “Double Bootstrap Confidence Intervals in the two-Stage DEA Approach.” Journal of Time Series Analysis 36 (5): 653–662. https://doi.org/10.1111/jtsa.12122
- Claessens, S., N. Coleman, and M. Donnelly. 2017. Low-for-Long’ Interest Rates and Net Interest Margins of Banks in Advanced Foreign Economies. International Finance Discussion Papers 1197, Board of Governors of the Federal Reserve System (U.S.).
- Clarks, S., and T. Siems. 2002. “X-Efficiency in Banking: Looking Beyond the Balance Sheet.” Journal of Money, Credit and Banking 34 (4): 987–1013. https://doi.org/10.1353/mcb.2002.0053
- Demiralp, S., J. Eisenschmidt, and T. Vlassopoulos. 2019. “Negative Interest Rates, Excess Liquidity and Bank Business Models: Banks’ Reaction to Unconventional Monetary Policy in the Euro Area.” ECB. Working Paper 2283.
- Eggertsson, G. B., R. E. Juelsrud, L. H. Summers, and E. G. Wold. 2019. “Negative Nominal Interest Rates and the Bank Lending Channel.” NBER Working Paper 25416. Boston.: National Bureau of Economic Research.
- Fiordelisi, F., D. Marques-Ibanez, and P. Molyneux. 2011. “Efficiency and Risk in European Banking.” Journal of Banking and Finance 35: 1315–1326. https://doi.org/10.1016/j.jbankfin.2010.10.005
- Fujii, H., S. Managi, R. Matousek, and A. Rughoo. 2018. “Bank Efficiency, Productivity, and Convergence in EU Countries: A Weighted Russell Directional Distance Model.” The European Journal of Finance 24 (2): 135–156. https://doi.org/10.1080/1351847X.2017.1303527
- Gaganis, C., and F. Pasiouras. 2013. “Financial Supervision Regimes and Bank Efficiency: International Evidence.” Journal of Banking and Finance 37 (12): 5463–5475. https://doi.org/10.1016/j.jbankfin.2013.04.026
- Grandi, P., and M. Guille. 2023. “Banks, Deposit Rigidity and Negative Rates.” Journal of International Money and Finance 133: 102810.
- Heider, F., F. Saidi, and G. Schepens. 2019. “Life Below Zero: Bank Lending Under Negative Policy Rates.” Review of Financial Studies 32 (10): 3728–3761. https://doi.org/10.1093/rfs/hhz016
- Holló, D., and M. Nagy. 2006. “Bank Efficiency in the Enlarged European Union.” BIS Papers Chapters, in: Bank for International Settlements (ed.), The Banking System in Emerging Economies: How Much Progress has Been Made? 28: 217–235.
- Huljak, I., R. Martin, and D. Moccero. 2019. “The Cost-Efficiency and Productivity Growth of Euro Area Banks.” In August ECB Working Paper.
- Kolia, D., and S. Papadopoulos. 2020. “The Levels of Bank Capital, Risk and Efficiency in the Eurozone and the U.S. in the Aftermath of the Financial Crisis.” Journal of Quantitative Finance and Economics 4 (1): 66–90. https://doi.org/10.3934/QFE.2020004
- Kumbhakar, S. C., C. F. Parmeter, and V. Zelenyuk. 2022. “Stochastic Frontier Analysis: Foundations and Advances.” In The Handbook of Production Economics, edited by Subhash C. Ray, Robert G. Chambers, and Subal C. Kumbhakar, 331–370. Singapore: Springer Singapore.
- Leroy, A., and Y. Lucotte. 2016. “Is There a Competition-Stability Trade-off in European Banking?” Journal of International Financial Markets, Institutions and Money 46: 199–215. https://doi.org/10.1016/j.intfin.2016.08.009
- Lopez, J. A., A. K. Rose, and M. M. Spiegel. 2018. “Why Have Negative Nominal Interest Rates had Such a Small Effect on Bank Performance? Cross Country Evidence.” CEPR Discussion Papers 13010.
- Lozano-Vivas, A., and F. Pasiouras. 2010. “The Impact of non-Traditional Activities on the Estimation of Bank Efficiency: International Evidence.” Journal of Banking & Finance 34 (7): 1436–1449. https://doi.org/10.1016/j.jbankfin.2010.01.006
- Maudos, J., and J.-M. Pastor. 2003. “Cost and Profit Efficiency in the Spanish Banking Sector (1985-1996): A non-Parametric Approach.” Applied Financial Economics 13 (1): 1–12. https://doi.org/10.1080/09603100110086087
- Molyneux, P., A. Reghezza, and R. Xie. 2019. “Bank Margins and Profits in a World of Negative Rates.” Journal of Banking and Finance 107: 105613.
- Pasiouras, F., S. Tanna, and C. Zopounidis. 2009. “The Impact of Banking Regulations on Banks’ Cost and Profit Efficiency: Cross-Country Evidence.” International Review of Financial Analysis 18 (5): 294–302. https://doi.org/10.1016/j.irfa.2009.07.003
- Safiullaha, M., and A. Shamsuddinb. 2019. “Risk-adjusted Efficiency and Corporate Governance: Evidence from Islamic and Conventional Banks.” Journal of Corporate Finance 55: 105–140. https://doi.org/10.1016/j.jcorpfin.2018.08.009
- Sealey Jr, C. W., and James T. Limdley. 1977. “Inputs, Outputs, and a Theory of Production and Cost at Depository Financial Institutions.” Journal of Finance 32 (4): 1251–1266. https://doi.org/10.1111/j.1540-6261.1977.tb03324.x
- Servin, R., R. Lensink, and M. Ber. 2012. “Ownership and Technical Efficiency of Microfinance Institutions: Empirical Evidence from Latin America.” Journal of Banking & Finance 36 (7): 2136–2144. https://doi.org/10.1016/j.jbankfin.2012.03.018
- Sharma, D., A. K. Sharma, and M. K. Barua. 2013. “Efficiency and Productivity of Banking Sector: A Critical Analysis of Literature and Design of Conceptual Model.” Qualitative Research in Financial Markets 5 (2): 195–224. https://doi.org/10.1108/QRFM-10-2011-0025
- Simar, L., and P. W. Wilson. 2000. “Statistical Inference in non-Parametric Frontier Models: State of the art.” Journal of Productivity Analysis 13 (1): 49–78. https://doi.org/10.1023/A:1007864806704
- Simar, L., and P. W. Wilson. 2007. “Estimation and Inference in Two-Stage, Semi-Parametric Models of Productive Efficiency.” Journal of Econometrics 136 (1): 31–64. https://doi.org/10.1016/j.jeconom.2005.07.009
- Simar, L., and P. W. Wilson. 2011. “Two-stage DEA: Caveat Emptor.” Journal of Productivity Analysis 36 (2): 205–218. https://doi.org/10.1007/s11123-011-0230-6
- Wang, H. J., and P. Schmidt. 2002. “One-step and Two-Step Estimation of the Effects of Exogenous Variables on Technical Efficiency Levels.” Journal of Productivity Analysis 18 (2): 129–144. https://doi.org/10.1023/A:1016565719882
