
 ?Mathematical formulae have been encoded as MathML and are displayed in this HTML version using MathJax in order to improve their display. Uncheck the box to turn MathJax off. This feature requires Javascript. Click on a formula to zoom.
ABSTRACT
This study proposes a multidimensional framework for the assessment of cultural heritage vulnerability to flood hazards. In this framework, cultural heritage is framed within a landscape approach drawing on the concept of the historic urban landscape as a physical entity, a lived space and a layered socio-economic environment. In such manner, this study emphasises that climate change disturbs both tangible and intangible aspects of cultural heritage – such as social systems and daily life practices – by modifying the material conditions that sustain them. Thus, the proposed framework integrates built and natural heritage with area-based vulnerability and socio-economic deprivation, considering households’ exposure to flood risk. The analysis follows a spatial and quantitative approach using open geospatial data available at the statistical unit level. The data are processed and analysed employing QGIS software and statistical analysis. Results confirm that cultural heritage vulnerability is highly associated with socio-economic deprivation and area-based vulnerability. The understanding of this interrelation is key to the identification of historic urban landscape qualities and priority areas for reconstruction and social support.
Introduction
Over the course of the twentieth century, the broadening notion of heritage led to the inclusion of the concept of landscape as a living space in the heritage field, resulting in a contextual conceptualisation of the historic environment. This evolution goes beyond the vision of cultural heritage (CH) as outstanding architectural monuments and historic centres towards a broader recognition of the urban context and its specific geographic and socio-economic characteristics (Ginzarly, Houbart, and Teller Citation2019; Rodwell Citation2018). The historic urban landscape approach (HUL) calls for the integration of cultural and natural heritage attributes and their vulnerability to socio-economic stresses and climate change into a wider framework of sustainable urban development (UNESCO Citation2011). Several studies have analysed and compared the different existing frameworks for resilience and vulnerability assessment, showing that most of the frameworks do not consider CH a critical element (Aktürk and Shirvani Dastgerdi Citation2021). This is a disadvantage given that CH – as a result of traditional knowledge accumulated over centuries – can offer solutions to the challenges brought by climate change (UNESCO Citation2010). Developing integrated methods that can capture the vulnerability of CH is considered an urgent policy need (ICOMOS Citation2019). The recent collaboration between the International Council on Monuments and Sites (ICOMOS), the United Nations Educational, Scientific and Cultural Organization (UNESCO) and the Intergovernmental Panel on Climate Change (IPCC) called for the integration of heritage dimensions in climate actions and resulted in the global research and action agenda on culture, heritage and climate change (Morel et al. Citation2022).
Climate change represents the foremost risk to CH and it is expected to influence the intensity, frequency and seasonality of extreme events such as extreme winds, hurricanes, extreme precipitation, flash floods, landslides, heat waves and wildfires (ICOMOS Citation2019). Among all the natural hazards, floods are the most frequent, significantly and recurrently affecting CH assets and population in flood-prone areas (Nguyen et al. Citation2024). Due to the effects of climate change and socio-economic transformations, flood risk is expected to increase globally over time (Li et al. Citation2017). Flood risk can be defined as a function of a flood hazard’s probability and is generally expressed as the product of exposure and vulnerability (Kron Citation2005). In its fifth assessment report, the IPCC defines vulnerability as a function of sensitivity and adaptive capacity, which are evaluated through selected indicators depending on the context of the system being studied (IPCC Citation2014). It is the adaptive capacity of a human system that reflects its ability to minimise the damages posed by a particular hazard, as hazards cause no damage if they occur in unpopulated areas or regions where human systems are well-adapted (Brooks Citation2003). In this construct, the IPCC’s conceptualisation of exposure has shifted from a hazard-centred concept (indicators include heatwave duration index and occurrence of floods) to one that refers to exposed elements that could be adversely affected, such as people, livelihoods; or ecosystems (IPCC (Citation2022); Estoque et al. Citation2023). This requires an understanding of the vulnerability of people and their livelihoods, including the allocation and distribution of socio-economic resources, that can influence the achievement of resilience and security.
For CH, it is important for vulnerability assessments to acknowledge the wider context and its characteristics, rather than focusing solely on historic buildings and sites (Cook, Johnston, and Selby Citation2021). However, most related studies are relevant mainly for individual CH assets or sites (Figueiredo, Romão, and Paupério Citation2020). A comprehensive climate vulnerability assessment is notably absent for various CH types (cultural, natural, exceptional and everyday) underscoring the necessity for a framework that addresses landscapes rather than heritage sites in isolation (Cook, Johnston, and Selby Citation2021). Therefore, there is a need for a multidimensional framework focused on the particularities of CH vulnerability while effectively integrating physical and social vulnerability concepts.
As such, this study is to address the following research questions: how should we define CH exposure and vulnerability in the context of the HUL approach? What are the interactions between exposure and different dimensions of vulnerability? To this end, the main pursued objective is to propose a framework that operationalises the IPCC conceptualisation of vulnerability and exposure focusing on the singularities of CH (see ). We apply an indicator-based method to CH vulnerability assessment to flood hazards that addresses the limitations outlined above. Indicators are used to operationalise theoretical concepts through variables that serve as operational representations of a system’s characteristics, qualities or properties (Neset et al. Citation2019). In this framework, CH is framed within a landscape approach drawing on the concept of cultural landscapes as physical entities, lived spaces and layered socio-economic environments. In such manner, we emphasise that climate change disturbs both tangible and intangible aspects of CH – such as social systems, the practices of daily life and commerce and economic activities – by modifying the material conditions that sustain them (Thomas et al. Citation2019). Thus, our proposed framework integrates built and natural heritage with area-based and socio-economic vulnerability considering the population exposure to the flood hazard.
Figure 1. Conceptual framework. Operationalize the IPCC vulnerability and exposure concepts within a landscape approach to cultural heritage.
Vulnerability assessment and cultural heritage
The vulnerability concept is used in various disciplines such as geography, poverty and development, food security, climate change, natural hazards, economics, ecology, land management and disaster management (Paul Citation2013). Therefore, there is an abundance of definitions for ‘vulnerability’, as it is conceptualised and measured differently by various research communities and even within the same knowledge domain (Füssel and Klein Citation2006). Though vulnerability conceptualisations vary in emphasis, three forms standout: vulnerability as hazard exposure; vulnerability as social response; and vulnerability of places (Kumpulainen Citation2006). Thus, there are biophysical, social and spatially expressed vulnerabilities (Mavhura, Manyena, and Collins Citation2017).
Biophysical vulnerability is concerned with the ultimate impacts of hazards such rainfall, floods and droughts focusing on their scale, frequency and extent (Singh Jatav Citation2020). Social vulnerability deals with the state of human systems – which is influenced by political, economic and social factors – that determine societal ability to respond to hazards and adapt to risks (Birkmann Citation2013; Brooks Citation2003; Imran et al. Citation2019). Scholars have identified examples of factors affecting social vulnerability, i.e. access to various institutional services, poverty, food insecurity and social inequality regarding age, gender or income (Abid et al. Citation2016; Siagian et al. Citation2014). For instance, the quality of housing could serve as a significant factor in shaping a community’s (social) vulnerability to floods, but it is less likely to influence its vulnerability to drought (Brooks Citation2003). As governments and planning agencies increasingly focus on the planning for and responding to natural hazards associated with climate change, social vulnerability data become an indispensable component of decision-making (El-Zein, Ahmed, and Tonmoy Citation2021). Biophysical vulnerability is a function of the frequency and severity of a particular type of hazard, while social vulnerability is rather viewed as an inherent property of a system (Brooks Citation2003).
Spatially expressed vulnerability can integrate aspects of both biophysical and social vulnerability, but within specific geographical areas where social groups and the unique characteristics of a place intersect (Mavhura, Manyena, and Collins Citation2017). It has been recognised that the spatial dimension defines the magnitude of vulnerability and clarifies the geographical disparities in the manifestation of vulnerability (Cutter and Finch Citation2008; Nwankwo et al. Citation2022). Many scholars have developed an integrated set of indicators drawing from natural hazards, socio-economic and spatial strands of vulnerability literature (see Giri et al. Citation2021). For instance, Maxwell et al. (Citation2023) integrated physical and socioeconomic indicators from open geospatial data to map the vulnerability of deprived areas in multiple cities and at a large scale. Moreover, Kuffer et al. (Citation2023) developed a multidimensional framework that includes socio-economic and household characterisation (household-level) as well as the characterisation of physical and environmental conditions (area-level) to classify area-based vulnerability and socio-economic deprivation. Still, these studies do not cover CH as a critical element.
This paper introduces a multidimensional framework for assessing spatially expressed CH vulnerability to flood hazards, integrating aspects of social and biophysical vulnerability within a specific geographical area following the IPCC conceptualisation. Accordingly, the framework incorporates two types of indicators: (1) indicators of the state of the human system prior to the occurrence of the hazard event. These are socio-economic indicators reflecting sensitivity and adaptive capacity independent of the flood hazard, and (2) indicators of outcomes that are concerned with the impact of the hazard event. These are indicators reflecting the damage to CH assets and to the built environment resulting from the flood hazard. This process quantifies vulnerability and subsequently calculates the population’s exposure to the hazard.
Over the past two decades, extensive research into the observed and projected impacts of climate change on CH has resulted in notable progress in damage quantification and risk assessment (Bonazza and Sardella Citation2023). At the European level and with regard to floods, the Directive 2007/60/EC on the assessment and management of flood risks requires European Union member states to develop flood risk management plans where CH is considered (Official Journal of the European Union Citation2007). Most heritage studies follow an assessment framework that incorporates the three IPCC components of vulnerability: exposure, sensitivity and adaptive capacity. These components are adopted by Daly (Citation2014) who applied a six-step framework that primarily relies on data gathered from interviews and consultation with stakeholders to assess the vulnerability of archaeological sites to climate change. The IPCC framework is adopted as well by the Climate Vulnerability Index (CVI) for CH, a systematic methodology for assessing the vulnerability of the Outstanding Universal Value of World Heritage (WH) sites and the associated community to climate change. A detailed outline of the CVI methodology is provided by Day, Heron, and Markham (Citation2020). The CVI follows an 11-step process that is undertaken through a workshop with diverse stakeholders (Day, Heron, and Markham Citation2020).
The first step in both frameworks requires an in-depth understanding of the nature and range of outstanding universal values and national values considered important for the site. At this phase, the identification of heritage values and other measures rely on stakeholders’ input, making the vulnerability assessment challenging due to the many uncertainties involved (Day, Heron, and Markham Citation2020).
The IPCC components of vulnerability were as well adopted by Sesana et al. (Citation2020), who developed a framework and applied it to three industrial World Heritage Sites in Europe. The applied method relied on data gathered from semi-structured interviews with different stakeholders including the managers, coordinators, professionals and academics. The analysis followed a qualitative assessment of interviewees’ answers.
Our framework proposes (1) the application of a landscape approach that extends beyond World Heritage Sites, (3) the use of open big data and geographical information systems for quantitative and spatial CH vulnerability assessment at the landscape scale, (3) and the integration of indicators related to CH vulnerability, area-based vulnerability, socio-economic condition and households’ exposure considering both the concentration of individual heritage elements and areas. This framework draws on the concept of the historic urban landscape as a physical spatial entity, a lived space that is defined by a layered socio-economic environment and the association between a site and its community (see, for instance, Ginzarly, Houbart, and Teller Citation2019; Perry and Gordon Citation2021; Poulios Citation2010). compares the developed framework with previous examples by Daly (Citation2014), Sesana et al. (Citation2020) and Day, Heron, and Markham (Citation2020).
Table 1. Comparison of developed framework with previous examples.
Cultural heritage vulnerability indicators to flood hazards
The Hyogo Framework for Action 2005–2015 emphasises the importance of developing vulnerability indicators to enable decision-makers to assess the impact of disasters (UNISDR Citation2005). Vulnerability indicators define, quantify and weight aspects of vulnerability across regional units, but methods of constructing indices are subject to discussion (Field and Barros Citation2014). Several indicator-based methodological approaches exist for quantifying vulnerability to natural hazards. This project precisely addresses the vulnerability of CH to flood exposure.
The impact of floods depends on the socio-economic characteristics and dynamics of the population (Poussard et al. Citation2021). It has been argued by many scholars that exposure to floods is a potential source of environmental inequalities (La Rosa and Pappalardo Citation2019; Poussard et al. Citation2021). To assess socio-economic vulnerability to flood hazards, an index of socio-economic disparity (Grippa et al. Citation2015) will be adapted to provide a classification of the population according to its socio-economic status. The synthetic socio-economic disparity index is based on 23 socio-economic indicators, available at the statistical unit level and grouped along four dimensions (Grippa et al. Citation2015), including origin and nationality, taxable income level, unemployment and participation rate, and share of households with social security income. Linking socio-economic features with social vulnerability to floods suggests that processes involving characteristics such as age, education and income are principal drivers of a population’s ability to prepare for, respond to and recover from damaging flood events (Rufat et al. Citation2015).
When it comes to cultural heritage assets, Navia & Ferreira (Citation2019) proposed a simplified flood vulnerability assessment to historical centres on the basis of two fundamental components: exposure and sensitivity. These two components are composed of a set of indicators, including building condition, number of storeys, age and heritage status. A study by Paupério, Romão, and Costa (Citation2012) proposed an approach for mapping the vulnerability of historic buildings involving the weighted contribution of three vulnerability components: the building, the contents and the surroundings. Here, the weight of the building value was identified based on differentiation between buildings listed as national monuments, buildings with value for the municipality, buildings with value for the general public and so forth. However, the weight-based analysis is not definite and lacks a real ground for weights. In a review of main indicators in existing flood vulnerability assessment methods in historic urban areas, Julià and Miguel Ferreira (Citation2021) identified 26 sensitivity, exposure and resilience indicators among the physical, socio-economic and cultural dimensions of flood vulnerability assessment. They identified the age and heritage status of the building as the most frequently employed cultural indicators (Julià and Miguel Ferreira Citation2021).
In this study, we borrow from the above mentioned studies to evaluate CH vulnerability following an index-based assessment integrating listed and designated buildings and heritage sites, along with buildings dating from before 1950 – considering them of important historical value – and protected natural heritage sites.
In a recent study, Cook, Johnston, and Selby (Citation2021) identified several limitations with the most common approaches to vulnerability indicators in archaeological heritage management arguing that previous studies focus on ‘sites’ as a unit of investigation without consideration of the landscape of which sites are constituents and without acknowledging the wider implications on the landscape as a whole. In this study, we aim to address this limitation by addressing the whole landscape and integrating the area-based vulnerability in the overall assessment.
In fact, although the above-mentioned studies addressed the vulnerability of CH to flood hazards, these works were limited to tangible cultural heritage and the suggestion of structural measures to reduce the impact of floods on vulnerable structures and elements. What is still lacking is an understanding of socio-economic dynamics and their relation with spatial vulnerability. This research addresses this limitation and integrates indicators addressing the historic urban environment as well as the socio-economic characteristics. Moreover, this research goes beyond designated heritage to include heritage assets with diverse historical and cultural values and natural heritage.
Following the above addressed studies, the proposed framework includes selected indicators for the assessment of CH vulnerability to flood hazards. Accordingly, three major thematic indicators will be used in this study, including CH and area-based vulnerability and socio-economic deprivation ().
Table 2. Indicators selected for CH vulnerability assessment to flood hazards with respective references.
Materials and method
Study area
This paper takes the Vesdre Valley in Belgium as a case study. From its spring in the High Fens, the valley covers around 700 km2 and the River Vesdre flows for 70 km, in a relatively narrow and deep valley into the River Ourthe, which is the main tributary of the River Meuse in Belgium (Martin et al. Citation2015). It addresses the recent 2021 low-pressure system ‘Bernd’ that brought heavy rainfall between 12 and 15 July leading to severe flooding in several European countries. The two most affected regions were West German states and the Walloon region of Belgium. In Germany, effects were focused on the catchments of the rivers Ahr, Erft, Inde and Rur, with the most severe damage in the Ahr valley. In Belgium, effects were focused on a number of tributaries of river Meuse, with major impact in the Vesdre Valley (Dewals et al. Citation2021). Thousands more residential buildings were substantially damaged, leading to extensive intangible damages. In addition, the impact of the flood led to critical infrastructure failures. Impacts range from completely destroyed bridges, to severely damaged schools and hospitals (Koks et al. Citation2022). Climate change has increased the likelihood of a precipitation event with meteorological characteristics similar to the July 2021 event by 1.2 to 9 times, whereas the intensity of the maximum 24 h rain fall has increased by about 3 to 19% (Mohr et al. Citation2022).
Data sources
The data are available at the statistical unit level (), which is the basic territorial unit that results from the subdivision of the territory of municipalities for the dissemination of their statistics at a finer level than the municipal level. The data can be consulted on the Wallonia geoportal WalOnMap and the local statistical information portal on Wallonia WalStat. The data were obtained from the Public Service of Wallonia SPW. The official flood hazard map, updated on 7 July 2022 is the one used in the analysis. The mapping is based on field surveys by public servants in the weeks after the events. This survey has been complemented with different data sources and methods, as for instance pictures taken by drones and helicopters and spatial interpolation. A detailed description of how the 2021 flood extension has been mapped is available on the official geoportal.Footnote1
Table 3. Data sources.
The territory of the Vesdre Valley is covered by 531 statistical units. The area of these statistical units varies between 4 and 5851 ha with a median value of 44 ha. The number of households by statistical unit varies between 1746 and null with a median value of 136.
Data processing and analysis
QGIS software was used for the processing and visualisation of data. The analytical framework consists of five different parts (see ). First, CH concentration map was generated to understand the distribution of built and natural heritage assets. Then, a classification method based on a principal component analysis was applied to map CH and area-based vulnerability, socio-economic disparity and household exposure to flood at the statistical unit level. After classifying the statistical units (SUs) based on their different vulnerability and exposure status, an association analysis between households’ exposure and CH vulnerability was conducted. Subsequently, we adopted a measure called the comparative environmental risk index to contrast the chances of different dimensions being situated in a flood hazard zone as a function of the affected population. Finally, an association analysis including the three vulnerability indicators and households’ exposure was conducted.
Figure 2. Methodological workflow.
Gross and net concentration of cultural heritage
First, the gross and net concentration of CH were calculated on the SU level. While gross concentration (GC) measures the total value of a given heritage asset, net concentration (NC) takes into account the surface density per SU. The share of the five CH assets was calculated for the entire Vesdre Valley. For the point data, namely designated and listed heritage, the share was calculated as follows, where GCiu represents the share of heritage asset i in the SU u, Ni,u is the number of heritage asset in the SU u, and Ni,t is the total number of the heritage asset in the Vesdre Valley:
For the area-based data, namely heritage sites and protected natural heritage, the share was calculated as follows, where Ai,u represents the area of heritage sites in the SU u, and Ai,t represents the total area of heritage sites in the valley:
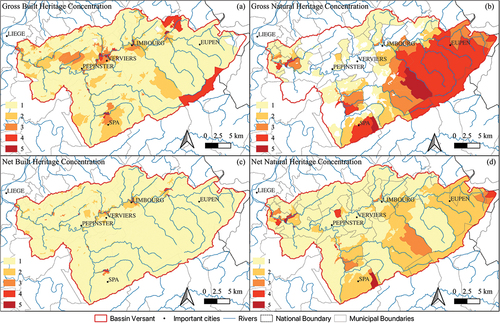
When it comes to buildings dating from before 1950, the area of these buildings in the SU was divided by the total area of buildings in the SU. After calculating the share, the resulting values were normalised in the range of 0 to 1 using the minimum-maximum normalisation method, then the concentration of cultural heritage was obtained as the result of the total sum (see ). Afterwards, the surface density of each SU was calculated by dividing the total area of the Vesdre Valley by the area of the SU. Subsequently, the NC was calculated by multiplying results from the GC by the ratio of the surface density (see ). This method effectively accounts for the size of each statistical unit relative to the entire study area as there is more probability to have higher number of buildings in larger areas.
Figure 3. Gross and net concentration of built and natural heritage.
Multidimensional vulnerability analysis
In QGIS, the dataset was combined with cadastral data to analyse the vulnerability and exposure to flood hazard. Geometric variables were calculated using geoprocessing tools in QGIS, while quantitative descriptive information on each SS is obtained by performing statistical operations in a spreadsheet that is spatially associated with the cartography. In addition, the number of households accounted for each statistical unit was quantified to address both affected areas and households.
Cultural heritage vulnerability
To assess the vulnerability of CH, first the share of flooded built and natural heritage assets was calculated. For point data, the share was calculated as below, where FHi is the share of flooded heritage, FHNi,u is the number of flooded heritage assets in the SU and ΣHNi is the total number of the heritage assets in the SU:
For area-based data, namely built and natural heritage sites, the share was calculated as follows, where FHAi,u is the area of the flooded heritage assets in SS and ΣHAi is the total area of the heritage assets in the valley:
Area-based vulnerability
The calculation of area-based vulnerability included the share of flooded buildings, commerce and critical services. The latter included hospitals, fire stations, police stations and schools. The share of the different flooded elements was calculated as below, where FAi is the share of flooded area-based element, FNi,u is the number of flooded elements in the SU and ΣFNi is the total number of the elements in the SU:
Socio-economic deprivation index
As mentioned previously, the analysis of the socio-economic disparity adopts the method developed by Grippa et al. (Citation2015) and applied in the Liege province in Belgium by Poussard et al. (Citation2021). The analysis precisely considers 23 indicators, available at the statistical unit level, grouped along four dimensions (i) origin and nationality, (ii) taxable income level, (iii) unemployment and participation rate and (iv) share of households with social security income. Accordingly, the SUs were classified based on a single index of social disparity divided in five classes, with class 1 gathering the affluent SU and class 5 the more deprived ones.
Mapping vulnerability
After calculating the share of the components of different dimensions, we applied a classification method that is conducted on the statistical unit level and is based on a principal component analysis (PCA) using RStudio software. Precisely, the analysis extracts the scores of the first principal component, then it calculates the mean of the scores. The lower threshold is calculated by subtracting the standard deviation from the mean, whereas the upper threshold is calculated by adding the standard deviation to the mean. Intermediate thresholds are half a standard deviation below or above the mean. The vector of calculated thresholds for the five classes (n = 1–5) was assigned as below, in which μ represents the mean value and σ represents the standard deviation:
This method allowed the classification of all statistical units based on three indices – CH vulnerability, area-based vulnerability and socio-economic disparity – each divided in five classes, with class 5 representing the statistical units with the most vulnerable CH and class 1 the less vulnerable ones (see ).
Population exposure to flood
In QGIS, the number of flooded households was computed at the SU level by overlaying the flood hazard map with household data. Then, household exposure to flood was calculated as follows:
Ei is the household exposure of the statistical unit to flood, θi is the number of flooded households in the SU i and ∑ θi is the total number of households located in the SU i. Thresholds are then calculated on the basis of the mean exposure of the SU and its standard deviation to obtain five classes representing different levels of exposure (). Afterwards, we calculated the percentage distribution of different classes of household exposure to flood in terms of sum of SU area, sum of households in the SU and sum of flooded households in the SU (see ).
Association analysis between households exposure and CH vulnerability
The correlation between households’ exposure to flood and CH vulnerability was calculated as a function of the total number of flooded households. Precisely, a three-variable cross-tabulation was used as analysis method (see ).
Comparative environmental risk index – socio-economic deprivation and CH vulnerability
In order to identify the distribution of CH vulnerability classes across the five socio-economic deprivation classes and based on the total number of flooded households, we adopted a measure called the comparative environmental risk index (CERI). This index measures whether minorities and low-income people are more likely to be exposed to environmental hazards than are the rest of the population. This measure first involves the calculation of association between the two addressed dimensions, followed by a calculation of a ratio of the deprived household as a proportion of the total CH class for any particular characteristic (socio-economic deprivation class in this case). The resulting ratio is divided by the total ratio of the corresponding CH vulnerability class to obtain the CERI. A ratio above 1 means that the chance of a particular CH vulnerability class to be situated in a zone with a specific socio-economic deprivation class is higher than the chance of being situated in a given exposure class than the entire population. The same calculations were applied to identify the CERI of (i) household exposure as a function of area-based vulnerability and (ii) socio-economic deprivation as a function of area-based vulnerability.
Multidimensional vulnerability and exposure indices
After identifying the CH and area-based vulnerability index, the socio-economic deprivation index and the exposure index, the mean value of each index was calculated in RStudio. Afterwards, for each statistical unit, we identified whether each of the indices is above or below the mean. Values above the mean are assigned the category H, meaning areas with high risk. Values below the mean are assigned the category L, meaning areas with low risk. The results were then mapped using QGIS (see ).
Results and discussion
Concentration of CH
Results from the analysis of CH concentration highlight the differences in the spatial distribution of built and natural heritage assets. It shows that the majority of the built heritage assets are located along the river (). This result is not surprising, and it is related to the history of urbanisation and industrialisation along the River Vesdre as in a number of pre-industrial and industrial settlements. On the other hand, the concentration of natural heritage sites seems somehow orthogonal to that of the built heritage () since the location of natural heritage is determined by factors such as geological formations, biodiversity, unique ecosystem services, and habitats and species conservation efforts rather than historical settlement patterns.
The gross concentration of CH visualises the overall distribution of heritage assets without considering the underlying spatial scale. The comparison of gross and net concentration of built and natural heritage shows that the latter alleviates the Modifiable Areal Unit Problem (MAUP) effect. Built heritage tends to concentrate in specific areas, such as historical city centres or designated heritage districts. As can be seen in , this strong clustering leads to a high level of net concentration in Verviers, Spa and Eupen, the main cities of the watershed. On the other hand, natural heritage sites exhibit larger areas of higher concentration and an overall spatial pattern that is less clustered. As a result, the net concentration of natural heritage has a more pronounced effect on the observed spatial patterns compared to built heritage.
The mapping of the gross and net concentration of CH shows that built and natural heritage assets are well covered (). Some cities like Spa, Verviers and Eupen show a high concentration of CH. The former is internationally renowned, having given its name to the famous spa in addition to its natural mineral springs, and a health resort listed as World Heritage Site. The second hosts a number of national heritage sites, and the latter has more than 80 protected national heritage sites varying from old houses to towers, churches and a castle among others.
Figure 4. Left. Gross concentration of CH. Right. Net concentration of CH.
Households exposure class by statistical units characteristics
displays the count and proportion of SU area, households and flooded households corresponding to each household exposure class. Results show that the distribution of households in the Vesdre Valley peaks in class 1 (71.53%). Still, there is a notable proportion of households, around 22%, situated in high-risk zones, classes 4 or 5. Moreover, on the spatial level, around 18% of the total area of the Vesdre Valley are within high exposure class to flood hazard.
Table 4. Households’ exposure class in relation to sector area and number of households.
Distribution of vulnerability and households’ exposure indices
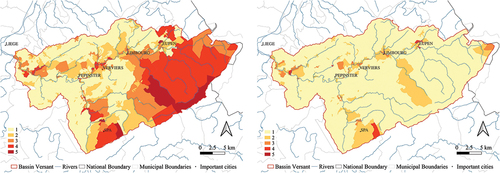
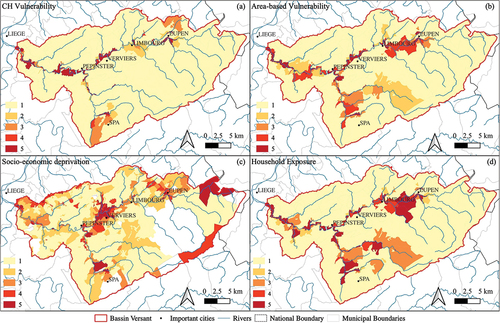
Results show a clear relation among the three vulnerability indices and exposure. Household exposure along with CH and area-based vulnerability are extremely high along the river (). Socio-economic deprivation exhibits a similar spatial pattern even though it extends outside the Vesdre Valley. Results () confirm that the most vulnerable CH assets (classes 4 and 5) are located in areas inhabited by the most deprived population (classes 4 and 5) and where a large share of commerce and critical services are affected by the flood ().
Figure 5. (a) Index of CH vulnerability; (b) index of area-based vulnerability; (c) index of socio-economic deprivation; (d) households’ exposure.
Concentration of households exposure in SUs with high CH vulnerability index
presents the results obtained from the cross-tabulation analysis, showcasing the distribution of the five classes of household exposure and CH vulnerability according to the number of flooded households. Out of a total of 17,997 households exposed to flooding, 9,921 households, meaning 55% of affected households, are located in SUs characterised by high CH vulnerability index (class 5). Moreover, a significant proportion, ranging from 60% to 73%, of affected households in the territory are located in SUs within a high CH vulnerability index (classes 4 and 5). These findings highlight the need to consider the vulnerability of CH in disaster management and disaster resilience planning. Protection and preservation efforts should not only focus on mitigating the direct impacts of floods on CH but also address the underlying vulnerabilities that make these sites more susceptible to damage from flooding events.
Table 5. Distribution of different classes of households’ exposure to flood across the five CH vulnerability classes as a function of the total number of flooded households.
Comparative environmental risk index for socio-economic deprivation and CH vulnerability
displays the results of the comparative environmental risk index evaluated for the distribution of different socio-economic deprivation status and CH vulnerability to flood according to the number of flooded households. Results show that the chance of being situated in a zone with high CH vulnerability class (classes 4 and 5) is higher for households in vulnerable socio-economic class 5 with CERI, respectively, equal to 1.19 and 1.36, meaning that there is a strong relation between cultural heritage and socio-economic vulnerability. Still, this chance is slightly lower for households in socio-economic class 4. The CERI values of 5.44 and 4.29 suggest that households with higher revenues tend to locate in areas where there is less CH in the Vesdre watershed. These typically correspond to recent peri urban areas. These households appear to be overprotected, meaning they are less exposed to both environmental and socio-economic risks affecting CH assets. Overall, these findings underscore the complex interplay between socio-economic factors, CH vulnerability and environmental risk, highlighting disparities in exposure to flooding affecting CH assets based on, socio-economic status. They highlight the need for targeted interventions to protect CH in socio-economically deprived areas, where vulnerability to damage is higher.
Table 6. CERI socio-economic deprivation and CH vulnerability according to the number of flooded households.
Concentration of households exposure in SUs with high area-based vulnerability index
Results show that 73 to 90% of flooded households are in areas that suffered a high disruption, having an area-based vulnerability class equal to 4 or 5 (). In fact, 12,354 over 17,997 of affected households, meaning 68%, are both in high households’ exposure area and high vulnerability areas (class 5). These results exhibit a double effect of flooding as it impacts individuals and access to services, thus causing disruption to the economic life and daily activities. In fact, the heritage of cities contains the daily activities of inhabitants, and the direct impact of flooding on households and services can damage both tangible and intangible aspects of CH.
Table 7. Distribution of different classes of households’ exposure to flood across the five area-based vulnerability classes according to the total number of flooded households.
Comparative environmental risk index for socio-economic deprivation and area-based vulnerability
Results from Comparative Environmental Risk Index for socio-economic deprivation and area-based vulnerability show that not only exposure but deprivation as well are reinforced by disruption of services. For area-based vulnerability class 5 and socio-economic deprivation classes 4 and 5, the CERI is, respectively, 1.02 and 1.22, meaning deprived households have lost more access to commerce and services after the floods. On the other hand, the CERI is 0.06 and 0.43 for socio-economic classes 1 and 2 meaning that households with high social and economic status did maintain their access to local services. It is worth mentioning that results showed as well that in area-based vulnerability class 4, socio-economic class 4 has less access to services than class 5 and this is mostly related to the fact that only 0.04% of the flooded households is at the intersection of socio-economic class 5 and area-based class 4.
Multidimensional association between CH and area-based vulnerability, socio-economic deprivation and households exposure to flood
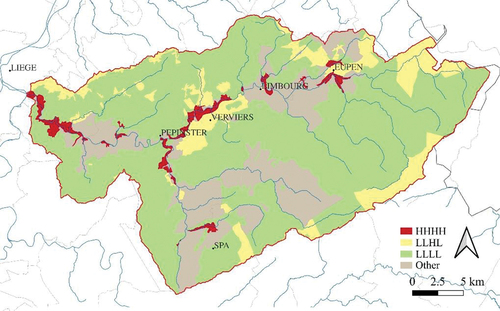
The association of results from the multidimensional vulnerability analysis combined with households’ flood exposure suggests several important findings. More than 80% of households fall within one of the vulnerability categories represented by HHHH, LLHL or LLLL (see , ). The findings identified that 21% of households are situated in high flood risk zones characterised by high CH and area-based vulnerability, along with high socio-economic deprivation. These zones are critical areas that exhibit multiple layers of vulnerability, including individual, collective and cultural. Despite comprising a relatively small proportion (2.5%) of the total area of the Vesdre Valley, these high-risk zones accommodate a significant segment of households. These are priority zones that exhibit significant vulnerability and should thus be prioritised for targeted interventions and mitigation measures to address the array of vulnerabilities they present. By contrast, LLLL areas are those gathering well-off households (36% of the total) that were not impacted by the floods and where there is a low concentration of CH.
Table 8. Multidimensional vulnerability and exposure categorical index.
Figure 6. Correlation by sequence between CH vulnerability, area-based vulnerability, socio-economic deprivation and households’ exposure.
Conclusion
The implementation of a landscape approach to the conservation and management of CH requires the contextualisation of heritage within the broader urban environment. The framework proposed and applied in this paper builds on this approach and contributes to the development of an indicator-based multi-dimensional vulnerability assessment for CH. In addition to considering built and natural heritage assets, the framework takes into account the socio-economic status of the living communities, that play a significant role in the assessment and management of hazards. Furthermore, it examines people’s daily practices, particularly those related to commercial activities and primary services, that shape both physical and social environments and contribute to people’s everyday heritage. The different addressed components are key for characterising the qualities of historic urban landscapes.
Our results revealed a high vulnerability of built CH assets situated along the river course. This finding is closely linked to inherited patterns of urbanisation. From a historical perspective, the industrial revolution in the 19th century spurred the development of urban centres nearby the rivers. This trend was further reinforced by the construction of railways along the bottom of the valleys, a feature still evident today, with a concentration of industrial brownfields and socio-economic disparities along former industrial axes following the main water courses (Poussard et al. Citation2021). The vulnerability of CH along the river corridor is accompanied with high socio-economic disparities. We find a larger increase in the exposure of the highly deprived population compared to the least deprived population in flooded areas. In fact, the dense settlements concentrated along the river are prone to environmental inequalities since more deprived socio-economic groups tend to reside in the inherited industrial axes along the water course (Poussard et al. Citation2021). In addition, the research findings highlight a strong correlation between CH vulnerability and socio-economic deprivation and area-based vulnerability. These multiple vulnerability indices identify areas that experience extreme perturbations in their living environment at the individual and community level. Simultaneously, these areas often lack resources necessary for adaptation and coping strategies. Hence, employing a multi-dimensional framework offers a practical approach to the contextualisation of CH vulnerability based on knowledge about the most and least disadvantaged areas and communities.
The relation between CH and flooded areas is structural and highly related to the specific configuration and history of the territory. As such results are not directly transferrable to other territories, but the method applied to identify the concentration and vulnerability of CH is. To map the concentration of CH, our methodological framework calculated the share based on the number or area of heritage attributes within the statistical units, then differentiates between the gross and net concentration of CH. The second phase of the analysis calculated the share of flooded elements – including built and natural heritage assets, services and commerce – and the share of flooded households. The integration of area-based vulnerability and the consideration of everyday practices along with socio-economic status in the assessment of CH vulnerability are seldom considered in heritage studies. Our framework provides researchers and managers of CH sites with a decision-making tool for identifying priority areas and developing suitable mitigation strategies aimed at minimising the adverse impacts of flood hazards. Furthermore, the use of an open-source geographical information system further enhances the applicability of the method.
It should be highlighted that measuring CH vulnerability requires the use of net indices in order to address the MAUP and it should be performed both retrospectively and prospectively. The latter should be performed through the use of flood exposure maps considering different return period scenarios. This knowledge can be used as basic information for early warning of the expected future flooding events and possibly affected areas and populations so that the local government and community can have prior knowledge to the frequency and probability of flood-related disaster occurrences. Our multidimensional vulnerability and exposure categorical index map is a useful tool for identifying priority areas for CH management, reconstruction and support.
The proposed method relies on open big data and recently there have been many advances in data acquisition. First, open data sources such as remote sensing, open street map and Google building could be harvested and employed for the application of the proposed method. Moreover, Crowdsourcing – i.e. engaging community members in transcriptions and production of cultural heritage metadata through institutions’ websites, heritage portals, wikis or social media platforms – allows broad participation resulting in user-generated big data on heritage places and associative values that is based on peoples’ experiences (see for instance Dahlgren and Hansson Citation2022; Xu et al. Citation2017). These data complement the official one and can be integrated from the very beginning in the first step of the proposed method related to the identification of CH concentration. It should be noticed that while crowdsourcing offers an opportunity, it raises challenges as well in regard with the digital divide and whether community members are more prone to be involved and engaged in crowdsourcing initiatives. As for the analysis of big data, our method applies principal component analysis, which reduces the dimensionality of large data sets that involve many variables and interpret them in few variables (i.e. the principal components). This method is very useful for data-driven decision-making.
Disclosure statement
No potential conflict of interest was reported by the author(s).
Data availability statement
The processed data will be available on Mendeley Data. Reserved DOI:10.17632/dm7h8d7jcx.1
Additional information
Funding
Notes on contributors
Manal Ginzarly
Manal Ginzarly is a Marie Curie postdoctoral fellow at the University of Liege. Her research combines sustainable urban development, urban governance, heritage management and climate change. In her research, she approaches the city as a living heritage. She works on methodological approaches using social media to encourage civic engagement in urban management and to provide additional knowledge about everyday landscapes and the diversity of heritage places and attributes.
Mitali Yeshwant Joshi
Mitali Yeshwant Joshi is a researcher at Local Environmental and Management Analysis (LEMA) research group, Department of Urban and Environmental Engineering, University of Liège. Her research involves analysing green roofs’ role in ecosystem service regulation at a city scale. Her interests include aspects of urban planning, urban environmental challenges, remote sensing, GIS and urban modelling.
Jacques Teller
Jacques Teller is a professor of urban planning at the University of Liège, where he directs the LEMA (Local Environment Management and Analysis) laboratory. His research work is located at the interface between urban governance and modelling of urbanisation dynamics. He develops work on emerging landscapes, whether new types of landscapes or new ways of approaching them. He is currently working on assessing the sustainability of urban densification/expansion processes.
Notes
References
- Abid, M., J. Schilling, J. Scheffran, and F. Zulfiqar. 2016. “Climate Change Vulnerability, Adaptation and Risk Perceptions at Farm Level in Punjab, Pakistan.” Science of the Total Environment 547 (March): 447–460. https://doi.org/10.1016/j.scitotenv.2015.11.125.
- Aktürk, G., and A. Shirvani Dastgerdi. 2021. “Cultural Landscapes Under the Threat of Climate Change: A Systematic Study of Barriers to Resilience.” Sustainability 13 (17): 9974. https://doi.org/10.3390/su13179974.
- Birkmann, J. 2013. “Measuring Vulnerability to Promote Disaster-Resilient Societies and to Enhance Adaptation: Conceptual Frameworks and Definitions.” In Measuring Vulnerability to Natural Hazards: Towards Disaster Resilient Societies, edited by J. Birkmann, 9–79. 2nd ed. Tokyo ; New York: United Nations University Press.
- Bonazza, A., and A. Sardella. 2023. “Climate Change and Cultural Heritage: Methods and Approaches for Damage and Risk Assessment Addressed to a Practical Application.” Heritage 6 (4): 3578–3589. https://doi.org/10.3390/heritage6040190.
- Brooks, N. 2003. “Vulnerability, Risk and Adaptation: A Conceptual Framework - Working Paper 38.” Tyndall Centre for Climate Change Research, Norwich: University of East Anglia. https://gsdrc.org/document-library/vulnerability-risk-and-adaptation-a-conceptual-framework/.
- Cook, I., R. Johnston, and K. Selby. 2021. “Climate Change and Cultural Heritage: A Landscape Vulnerability Framework.” The Journal of Island & Coastal Archaeology 16 (2–4): 553–571. https://doi.org/10.1080/15564894.2019.1605430.
- Cutter, S. L., and C. Finch. 2008. “Temporal and Spatial Changes in Social Vulnerability to Natural Hazards.” Proceedings of the National Academy of Sciences 105 (7): 2301–2306. https://doi.org/10.1073/pnas.0710375105.
- Dahlgren, A., and K. Hansson. 2022. “Crowdsourcing Cultural Heritage as Democratic Practice.” 39–48. https://doi.org/10.1007/978-3-031-05694-9_4.
- Daly, C. 2014. “A Framework for Assessing the Vulnerability of Archaeological Sites to Climate Change: Theory, Development, and Application.” Conservation and Management of Archaeological Sites 16 (3): 268–282. https://doi.org/10.1179/1350503315Z.00000000086.
- Day, J. C., S. F. Heron, and A. Markham. 2020. “Assessing the Climate Vulnerability of the World’s Natural and Cultural Heritage.” Parks Stewardship Forum 36:1. https://doi.org/10.5070/P536146384.
- Dewals, B., S. Erpicum, M. Pirotton, and P. Archambeau. 2021. “Extreme Floods in Belgium. The July 2021 Extreme Floods in the Belgian Part of the Meuse Basin.” https://hdl.handle.net/20.500.11970/109527.
- El-Zein, A., T. Ahmed, and F. Tonmoy. 2021. “Geophysical and Social Vulnerability to Floods at Municipal Scale Under Climate Change: The Case of an Inner-City Suburb of Sydney.” Ecological Indicators 121 (February): 106988. https://doi.org/10.1016/j.ecolind.2020.106988.
- Estoque, R. C., A. Ishtiaque, J. Parajuli, D. Athukorala, Y. Wahid Rabby, and M. Ooba. 2023. “Has the IPCC’s Revised Vulnerability Concept Been Well Adopted?” AMBIO: A Journal of the Human Environment 52 (2): 376–389. https://doi.org/10.1007/s13280-022-01806-z.
- Field, C. B., and V. R. Barros. 2014. Climate Change 2014 – Impacts, Adaptation and Vulnerability: Global and Sectoral Aspects. New York, NY, USA: Cambridge University Press.
- Figueiredo, R., X. Romão, and E. Paupério. 2020. “Flood Risk Assessment of Cultural Heritage at Large Spatial Scales: Framework and Application to Mainland Portugal.” Journal of Cultural Heritage 43 (May): 163–174. https://doi.org/10.1016/j.culher.2019.11.007.
- Füssel, H.-M., and R. J. T. Klein. 2006. “Climate Change Vulnerability Assessments: An Evolution of Conceptual Thinking.” Climatic Change 75 (3): 301–329. https://doi.org/10.1007/s10584-006-0329-3.
- Ginzarly, M., C. Houbart, and J. Teller. 2019. “The Historic Urban Landscape Approach to Urban Management: A Systematic Review.” International Journal of Heritage Studies 25 (10): 999–1019. https://doi.org/10.1080/13527258.2018.1552615.
- Giri, M., G. Bista, P. K. Singh, and R. Pandey. 2021. “Climate Change Vulnerability Assessment of Urban Informal Settlers in Nepal, a Least Developed Country.” Journal of Cleaner Production 307 (July): 127213. https://doi.org/10.1016/j.jclepro.2021.127213.
- Grippa, T., G. Van Hamme, P. Marissal, X. May, I. Wertz, and M. L. Loopmans. 2015. “Dynamiques des quartiers en difficulté dans les régions urbaines belges.” February. https://doi.org/10.5281/zenodo.1182963.
- ICOMOS. 2019. The Future of Our Pasts: Engaging Cultural Heritage in Climate Action. Paris: ICOMOS. https://openarchive.icomos.org/id/eprint/2459/1/CCHWG_final_print.pdf.
- Imran, M., K. Sumra, S. Amer Mahmood, and S. Faisal Sajjad. 2019. “Mapping Flood Vulnerability from Socioeconomic Classes and GI Data: Linking Socially Resilient Policies to Geographically Sustainable Neighborhoods Using PLS-SEM.” International Journal of Disaster Risk Reduction 41 (December): 101288. https://doi.org/10.1016/j.ijdrr.2019.101288.
- IPCC. 2014. Climate Change 2014: Impacts, Adaptation and Vulnerability: Contribution of Working Group II to the Fifth Assessment Report of the Intergovernmental Panel on Climate Change. Cambridge University Press.
- IPCC. 2022. “Climate Change 2022 – Impacts, Adaptation and Vulnerability: Working Group II Contribution to the Sixth Assessment Report of the Intergovernmental Panel on Climate Change.” In Katja Mintenbeck, and Andrés Alegría, edited by H.-O. Pörtner, D. C. Roberts, M. B. T. Melinda, E. Poloczanska, 1st ed. Cambridge University Press. https://doi.org/10.1017/9781009325844.
- Julià, P. B., and T. Miguel Ferreira. 2021. “From Single- to Multi-Hazard Vulnerability and Risk in Historic Urban Areas: A Literature Review.” Natural Hazards 108 (1): 93–128. https://doi.org/10.1007/s11069-021-04734-5.
- Koks, E. E., K. C. H. van Ginkel, M. J. E. van Marle, and A. Lemnitzer. 2022. “Brief Communication: Critical Infrastructure Impacts of the 2021 Mid-July Western European Flood Event.” Natural Hazards and Earth System Sciences 22 (12): 3831–3838. https://doi.org/10.5194/nhess-22-3831-2022.
- Kron, W. 2005. “Flood Risk = Hazard • Values • Vulnerability.” Water International 30 (1): 58–68. https://doi.org/10.1080/02508060508691837.
- Kuffer, M., A. Abascal, S. Vanhuysse, S. Georganos, J. Wang, D. R. Thomson, A. Boanada, and P. Roca. 2023. “Data and Urban Poverty: Detecting and Characterising Slums and Deprived Urban Areas in Low- and Middle-Income Countries.” In Advanced Remote Sensing for Urban and Landscape Ecology, Springer Nature. https://doi.org/10.1007/978-981-99-3006-7_1.
- Kumpulainen, S. 2006. “Vulnerability Concepts in Hazard and Risk Assessment.” Geological Survey of Finland, Special Paper 42:65–74.
- La Rosa, D., and V. Pappalardo. 2019. “Planning for Spatial Equity - a Performance Based Approach for Sustainable Urban Drainage Systems.” Sustainable Cities and Society 53:101885. October. https://doi.org/10.1016/j.scs.2019.101885.
- Li, H., J. Zhang, J. Sun, and J. Wang. 2017. “A Visual Analytics Approach for Flood Risk Analysis and Decision-Making in Cultural Heritage.” Journal of Visual Languages & Computing 41 (August): 89–99. https://doi.org/10.1016/j.jvlc.2017.05.001.
- Martin, B., S. Erpicum, M. Pirotton, P. Archambeau, and B. Dewals. 2015. “Assessing the Operation Rules of a Reservoir System Based on a Detailed Modelling Chain.” Natural Hazards and Earth System Sciences 15 (March). https://doi.org/10.5194/nhess-15-365-2015.
- Mavhura, E., B. Manyena, and A. E. Collins. 2017. “An Approach for Measuring Social Vulnerability in Context: The Case of Flood Hazards in Muzarabani District, Zimbabwe.” Geoforum; Journal of Physical, Human, and Regional Geosciences 86 (November): 103–117. https://doi.org/10.1016/j.geoforum.2017.09.008.
- Maxwell, O., R. Engstrom, D. Thomson, M. Kuffer, and M. L. Mann. 2023. “Mapping Deprived Urban Areas Using Open Geospatial Data and Machine Learning in Africa.” Urban Science 7 (4): 116. https://doi.org/10.3390/urbansci7040116.
- Miranda, F. N., and T. Miguel Ferreira. 2019. “A Simplified Approach for Flood Vulnerability Assessment of Historic Sites.” Natural Hazards 96 (2): 713–730. https://doi.org/10.1007/s11069-018-03565-1.
- Mohr, S., U. Ehret, M. Kunz, P. Ludwig, A. Caldas-Alvarez, J. E. Daniell, F. Ehmele, et al. 2022. “A Multi-Disciplinary Analysis of the Exceptional Flood Event of July 2021 in Central Europe. Part 1: Event Description and Analysis.” Preprint. Hydrological Hazards. https://doi.org/10.5194/nhess-2022-137.
- Morel, H., W. Megarry, A. Potts, J. Hosagrahar, D. Roberts, Y. Arikan, E. Brondizio, et al. 2022. Global Research and Action Agenda on Culture, Heritage and Climate Change. Charenton-le-Pont, France & Paris, France: ICOMOS & ISCM CHC. https://openarchive.icomos.org/id/eprint/2716/.
- Navia, F., and T. Ferreira 2019. “A Simplified Approach for Flood Vulnerability Assessment of Historic Sites.” Natural Hazards 96. https://doi.org/10.1007/s11069-018-03565-1.
- Neset, T.-S., L. Wiréhn, T. Opach, E. Glaas, and B.-O. Linnér. 2019. “Evaluation of Indicators for Agricultural Vulnerability to Climate Change: The Case of Swedish Agriculture.” Ecological Indicators 105 (October): 571–580. https://doi.org/10.1016/j.ecolind.2018.05.042.
- Nguyen, D.-M. T., T.-N. Do, S. Van Nghiem, J. Ghimire, K.-B. Dang, V.-T. Giang, K.-C. Vu, and V.-M. Pham. 2024. “Flood Inundation Assessment of UNESCO World Heritage Sites Using Remote Sensing and Spatial Metrics in Hoi an City, Vietnam.” Ecological Informatics 79 (March): 102427. https://doi.org/10.1016/j.ecoinf.2023.102427.
- Nwankwo, C. F., O. G. Ossai, R. U. Ayadiuno, and C. C. Ikeogu. 2022. “Spatial Dimension of Climate Change Vulnerability and Urbanization Relationship in Nigeria.” International Journal of Urban Sciences 26 (4): 582–603. https://doi.org/10.1080/12265934.2021.1956365.
- Official Journal of the European Union. 2007. “Directive 2007/60/EC of the European Parliament and of the Council of 23 October 2007 on the Assessment and Management of Flood Risks (Text with EEA Relevance).” http://data.europa.eu/eli/dir/2007/60/oj/eng.
- Paul, S. 2013. “Vulnerability Concepts and its Application in Various Fields: A Review on Geographical Perspective.” Journal of Life and Earth Science 8 (May): 63–81. https://doi.org/10.3329/jles.v8i0.20150.
- Paupério, E., X. Romão, and A. Costa. 2012. “A Methodology for the Vulnerability Assessment of Heritage Buildings and Contents Under Catastrophic Hazard.” https://repositorio-aberto.up.pt/handle/10216/84581.
- Perry, J., and I. J. Gordon. 2021. “Adaptive Heritage: Is This Creative Thinking or Abandoning Our Values?” Climate 9 (8): 128. https://doi.org/10.3390/cli9080128.
- Poulios, I. 2010. “Moving Beyond a Values-Based Approach to Heritage Conservation.” Conservation and Management of Archaeological Sites 12 (May): 170–185. https://doi.org/10.1179/175355210X12792909186539.
- Poussard, C., B. Dewals, P. Archambeau, and J. Teller. 2021. “Environmental Inequalities in Flood Exposure: A Matter of Scale.” Frontiers in Water 3. https://www.frontiersin.org/articles/10.3389/frwa.2021.633046.
- Rodwell, D. 2018. “The Historic Urban Landscape and the Geography of Urban Heritage.” The Historic Environment: Policy & Practice 9 (3–4): 180–206. https://doi.org/10.1080/17567505.2018.1517140.
- Rufat, S., E. Tate, C. G. Burton, and A. Sayeed Maroof. 2015. “Social Vulnerability to Floods: Review of Case Studies and Implications for Measurement.” International Journal of Disaster Risk Reduction 14 (December): 470–486. https://doi.org/10.1016/j.ijdrr.2015.09.013.
- Sesana, E., A. S. Gagnon, A. Bonazza, and J. J. Hughes. 2020. “An Integrated Approach for Assessing the Vulnerability of World Heritage Sites to Climate Change Impacts.” Journal of CULTURAL HERITAGE 41 (January): 211–224. https://doi.org/10.1016/j.culher.2019.06.013.
- Siagian, T., P. Purhadi, S. Suhartono, and H. Ritonga. 2014. “Social Vulnerability to Natural Hazards in Indonesia: Driving Factors and Policy Implications.” Natural Hazards 70 (2): 1603–1617. https://doi.org/10.1007/s11069-013-0888-3.
- Singh Jatav, S. 2020. “Bridging the Gap Between Biophysical and Social Vulnerability in Rural India: A Community Livelihood Vulnerability Approach.” Area Development and Policy 5 (4): 390–411. https://doi.org/10.1080/23792949.2020.1734473.
- Thomas, K., R. D. Hardy, H. Lazrus, M. Mendez, B. Orlove, J. T. R. Isabel Rivera-Collazo, M. Rockman, P. W. Benjamin, R. Winthrop, and R. Winthrop. 2019. “Explaining Differential Vulnerability to Climate Change: A Social Science Review.” WIREs Climate Change 10 (2): e565. https://doi.org/10.1002/wcc.565.
- UNESCO. 2010. Managing Disaster Risks for World Heritage. Paris. file:///C:/Users/user/Downloads/activity-630-1%20(2).pdf.
- UNESCO. 2011. “Recommendation on the Historic Urban Landscape.” https://whc.unesco.org/en/hul/.
- UNISDR. 2005. Hyogo Framework for Action 2005-2015: International Strategy for Disaster Reduction. United Nations Office for Disaster Risk Reduction.
- Xu, Z., Y. Liu, J. Xuan, H. Chen, and L. Mei. 2017. “Crowdsourcing Based Social Media Data Analysis of Urban Emergency Events.” Multimedia Tools & Applications 76 (9): 11567–11584. https://doi.org/10.1007/s11042-015-2731-1.