
 ?Mathematical formulae have been encoded as MathML and are displayed in this HTML version using MathJax in order to improve their display. Uncheck the box to turn MathJax off. This feature requires Javascript. Click on a formula to zoom.
ABSTRACT
This article re-examines Jewish population in what is now Israel using historical estimates from Ottoman, Mandatory British and United Nations sources and recent data from the Israeli census bureau. A logistic model generates backward extrapolations and forward projections. The model quantifies three waves of Jewish immigration totalling about 3.5 million. Subtracting immigrant data from total population numbers gives the main empirical trajectory for non-immigrant native-born population. A multi-logistic model combining migrant and native populations projects a Jewish population of about 10 million in 2050, a level low in the range of estimates made by others.
This article’s scope is the Jewish population defined by the Jordan River to the east and the Mediterranean Sea to the west largely between the latitudes 31°N and 33°N. Much work has aimed to predict the size of this population due to its importance for politics, economics, fresh water, space and other factors.Footnote1
While the analysis begins in the latter part of the 19th century, the region has a complex relevant human past going back to the time of early recorded history. By the 1500s, the area came under the rule of the Ottoman Empire. Military campaigns crossed it, and religious pilgrims frequented it, but the cultural and commercial centres of the Empire were elsewhere. Investment capital (primarily European) for building civil infrastructure started to flow into the region in the latter 19th century. The opening of the Haifa railway in 1905 linking the interior of the Middle East to the Mediterranean coast served as a catalyst for massive immigration from the entire region.Footnote2 The first significant waves of European Jewish immigrants arrived in the Land of Israel in the late 19th and early 20th century. The Jewish population began to grow and expand beyond selected cities in the 1880s and 1890s. The lack of effective Ottoman administration led to porous borders and thus allowed a steady flow of labourers as well as migrants with other leading motivations.Footnote3
Following World War I, natural population expansion rates were again augmented by immigration from outside the region. Rapid economic development in the area continued through the 1920s and 1930s. Emerging economic opportunities in Mandatory Palestine likely played an important role in migration to the region. Evidence for similar migrations supports push/pull theories that characterise the forces leveraged on contemporary populations.Footnote4
Early in the 20th century, British mandatory administrators projected a 1970 population of 3–4 million Jews and Arabs.Footnote5 Israeli demographer Bachi’s mid-century prediction of 1.9 million for the Jewish population in 1971 underestimated the actual numbers by over 40%.Footnote6 In 1968, the Israeli Statistics Bureau forecast a minority Jewish population of 2.3 million in the region by 1985;Footnote7 the actual Jewish population in 1985 was 50% larger.Footnote8 One confounding issue is birth and death rates, which rose and fell over the course of the last century.Footnote9 Importantly, sporadic changes in immigration and emigration complicate both accurate reconstruction of the historic Jewish population and forecasts for the region. The years 1947–49 witnessed momentous events in the political development of the region marked by lack of a single administrative body to provide continuous demographic data. Subsequently Israel experienced massive migration waves from Middle Eastern countries in the 1950s and from Russian-speaking areas during the 1990s. Notwithstanding the difficult history of population censuses and forecasts in the region, studies continue, and the usual reference point of Israeli demographers is rapid growth.Footnote10 Looking at the period 1890–2022, our goal is to decompose historical trends of the Jewish population in and around the State of Israel to provide the basis for mid- and long-range future projections.
Demographic projections employ a widening array of methods, most often based on assumptions or forecasts of the rates for birth, mortality, and migration. The cohort-component method attempts to model birth, death and migration rates of age- and gender-specific subgroups composing the population of interest.Footnote11 Several drawbacks become evident when using such models, including the stability of the assumptions that drive them. For example, the models often rely on fertility rates and migration patterns that remain static over decades, a condition rarely met in the real world.Footnote12 Projections based on these methods have tended to overestimate population sizes and lose relevance as fertility, mortality and migration patterns change.Footnote13 Much argument has occurred over models that assume ever-increasing population growth in an open system while neglecting negative feedback processes that constrain that growth. Analysis of aggregate population data using the exponential model and the power law have foretold ‘doomsday’ projections of catastrophic collapse.Footnote14
Early attempts to model demographic trends that consider changes in growth rates over time gave rise to the Logistic Model.Footnote15 This model falls within a class of structural dynamical models that take a different approach to representing socioeconomic factors.Footnote16 Its utility has been disputed as early attempts were also unsuccessful. Pearl’s classic forecasts underestimated US population size, probably due to vast unforeseen immigration during the 20th century. Even so, use of this paradigm to model human populations has been revisited and shown in some cases to track historical population data accurately over a few centuries.Footnote17 The logistic model frames observed phenomena as self-regulating or self-correcting processes, a characteristic of demographic momentum.Footnote18 We argue that the underlying dynamics of the model are the source of its utility in demography. Ahlburg and Lutz used the model for long-term projections of global and regional populations under different alternate futures. The UN applies the logistic model to project short to medium term global and regional population growth trends.Footnote19 We employ a logistic model, applying it separately to the native population and to migrations, and then integrating the two. We aim both to shed light on past population dynamics and to provide an evolutionary basis for mid- and long- range projections for Jews in the historical Palestine region.
Methods
Data collection
Obtaining accurate data for any population in the area challenges demographers.Footnote20 Besides non-reporting, misreporting can confound accurate assessment, especially from historical records. In addition to lack of full documentation, the sampling and statistical methods used for censuses are not consistent across bureaus. We collated data from several sources. For the early 20th century demographic data, we draw on historical compilations from Ottoman and Mandatory British sources,Footnote21 as well as published population estimates from multinational and international organisations.Footnote22 Historical population data for Jerusalem was collected from multiple sources as well.Footnote23 For the latter half of the 20th century, we use data from the Israel Central Bureau of Statistics (ICBS) on the population size of Jews in the region, including those living within the 1949 armistice line and those outside. The accuracy of this data has been questioned elsewhere.Footnote24 Contemporary official estimates of population sizes in the region are robust, though some uncertainty and variance emerge in the official data sources regarding population growth rates. Our analysis is agnostic about data sources and considers the datasets as published, without adjustment.
Mathematical modelling
For modelling the data to conduct either back-casting or forecasting exercises we use the Logistic model that describes density dependent growth in the presence of negative feedback.Footnote25 EquationEquation 1(1)
(1) describes a logistic growth process for a given population:
where (P) represents the population size, (r) the intrinsic growth rate constant, and (K) represents the value of P when it reaches saturation. Solving for P yields the function:
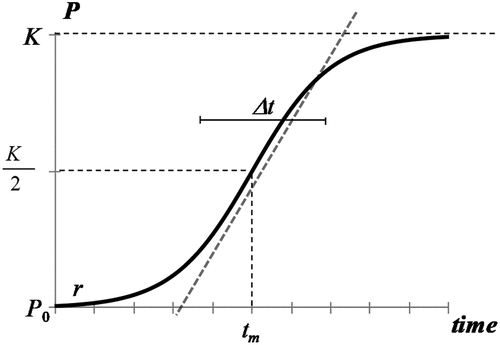
where the midpoint tm represents the time at which P reaches half the saturation value. The resulting S-curve, shown in , describes a process of accelerating and decelerating growth. P follows a sequence beginning with near-exponential growth when the population is small (P≪K/2) followed by a peak in the growth rate occurring at tm when P reaches half the saturation (P = K/2), and finally a diminishing rate of growth until P asymptotically approaches the saturation value (P→K).
Figure 1. The s-curve Logistic model for Population size (P) as a function of time. Source: Authors’ calculations. Notes: P is population size, K is the dynamical steady state maximum for P, and tm is the midpoint where P = K/2. r is the exponential intrinsic population growth rate and its derivative, duration Δt, is the ‘characteristic time’ for the population to grow from 10% to 90%.
To better visualise logistic growth, EquationEquation (2)(2)
(2) can be linearised using the Fisher-Pry transformation.Footnote26 One effect of the transformation is to normalise different growth processes. It also enables backwards extrapolation of the data, indicating the temporal origin of a growth process. In our analyses we also present the so-called Fisher-Pry transform, which normalises each S-curve to show its growth from initiation to saturation at 100% regardless of the actual level of saturation.
Parameter estimation and back-casting
To estimate parameter values and to generate curves for the datasets, we use the open-source Loglet Lab software package (version 4, http://logletlab.com). As shown in , the value for the characteristic duration (Δt) equals the amount of time elapsed between 10% and 90% of the growth to saturation K, which is calculated along with the midpoint (tm) of the process.Footnote27 Confidence intervals for the parameter values indicate the accuracy of forecasts generated by the model.Footnote28 Parameter values, as well as mean absolute percentage errorFootnote29 and goodness-of-fit statistics (RSS and RMS) for each dataset analysed are calculated and reported. In measuring population growth rates (section 3.4) we use the per capita rate (P−1∙ΔP/Δt) to eliminate disparities in population size and examine proportional growth. This can be approximated by the finite difference method with a smoothing algorithm to decrease the noise-to-signal ratio.Footnote30
Results
Premodern population dynamics, 1850–1950
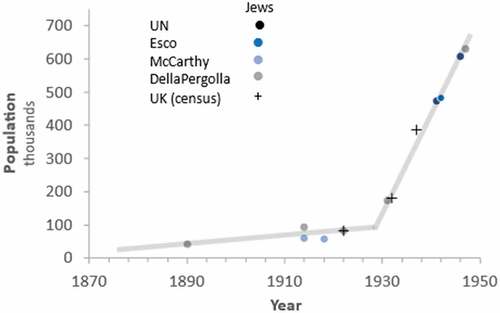
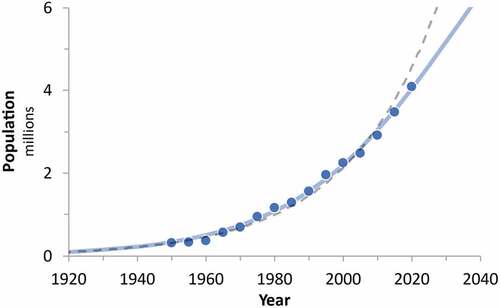
Zionist ideology, espousing the rebirth of Jewish sovereignty in the ancestral homeland, brought Jewish pioneers to the region from the mid-19th century, and by the end of the century several small but influential groups of European Jews flowed into the area.Footnote31 Still, prior to World War I, including both the First and Second Aliyas, the extant data show that the Jewish population grew slowly (). During the British Mandate (1920–48) the number of Jews increased markedly, though still in a linear expansion. Extrapolating the linear trend backwards, or back-casting, the initiation of a growth phase for the Jewish population took off in 1922 (dashed line in ), corresponding with the Third Aliya, the migration mostly of Russian and Polish Jews triggered by the Russian Revolution and the aftermath of World War 1.
Figure 2. Jewish populations during the Ottoman Empire and British Mandate, 1800–1948. Main trendlines and backward extrapolation are shown. Source: as described in methods.
Population in Jerusalem, 1850–1950
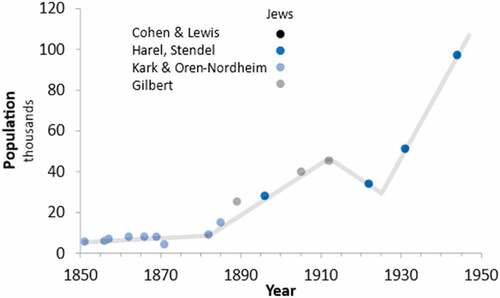
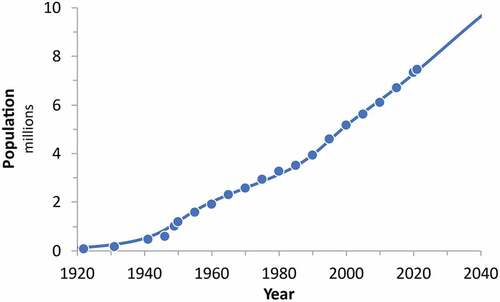
The Ottoman and British censuses used ill-defined and variable administrative borders that create a problem of comparability. Early demographic changes in the region are mirrored in the enclave of Jerusalem,Footnote32 a well-defined administrative unit whose dynamics we thus consider (). During the 19th century, the data for the size of Jerusalem’s Jewish population fluctuated. The first pulse of large Jewish immigration to the city began in 1880, and another in 1920.
Figure 3. Historical Jewish population of Jerusalem during the Ottoman Empire and British Mandate, 1850–1948. Source: as described in methods.
Jewish population dynamics, 1950–2020
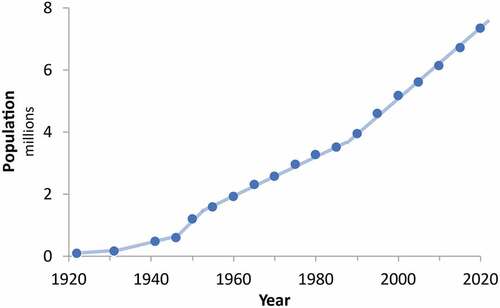
Since 1950, data on the Jewish population in the region is accurate with all births, deaths and migration recorded and nearly no undocumented influx. Israel and its predecessor regions experienced a rapid expansion of the Jewish population over the last 100 years in two distinct linear phases (). The first, between 1950 and 1990, has a net population growth of 65,000 per year (R2 = 0.99, p < 0.001). The second, since 1990, was two-thirds larger with 108,000 per year (R2 = 0.99, p < 0.001). No single biological or sociological mechanism would explain these linear trends, which reflect high birth rates, and more importantly the effect of migration as well as extremely low numbers of deaths relative to the population size due to the youthful population structure, as most immigrants were young.
Figure 4. The path of Jewish population in the State of Israel and predecessors as a sequence of linear segments. Source: Israeli Central Bureau of Statistics. Notes: data is available for every year since 1950 and displayed here for every fifth year for simplicity.
Jewish immigration trends, 1950–2020
Plotting the cumulative number of Jewish immigrants clearly shows a sequence of waves (). To decouple immigration from the population data, we fit the inflow data to the multi-logistic model, which shows good agreement with a model including three waves (). We find a long-trend main immigration curve (in blue) spanning nearly 100 years with a saturation of about 1.5 million with two other waves superposed (in orange and red). During a wave of almost 40 years from 1931 to 1969 about 800,000 people arrived in Israel from Middle Eastern and North African countries (orange data points), and between 1976 and 2006 about one million migrated from Russia and neighbouring countries (red data points). The Fisher-Pry analysis establishes the midpoints of the three waves in 1959, 1950, and 1996.
Figure 5. (a) Sum of Jewish immigration trends in the State of Israel and predecessors. (b) Logistic decomposition of the aggregate trend showing three distinct waves of immigration: 1) a long curve spanning 100 years (blue), a rapid wave originating during the 1930s (Orange) and another rapid wave originating in the mid-1970s (red). (c) Fisher-Pry transform of the three waves normalised to show their growth to the limit of the process, easing comparison of the speed and duration of the waves. Data source: Israel Central Bureau of Statistics.
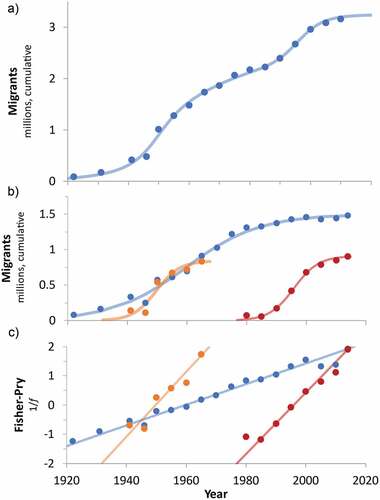
In principle, it matters to know the death rate of elderly immigrants. While this data is not extant, a large number of deaths from the total national Jewish mortality (about 40,000 in 2021) can be assumed to be immigrants. If it is about half, the total immigrant mortality would be about 20,000 per year, equal to the approximately 20,000 new immigrants that entered Israel per year during the past decade, and would maintain the cumulative immigration near saturation. The number of Israelis emigrating yearly is also about 20,000, a level whose effect on national Jewish population can be neglected for a while. While occasional refreshments can occur (as 40,000 migrants in 2022 from Ukraine), the present stable number of immigrants in Israel will naturally decline over the next 10–20 years. This allows for a reasonable conclusion that the migrant Jewish sub-population in Israel is currently in a dynamic steady state.
Native Jewish population 1950–2020 and composite Jewish population model
Subtracting the immigrant data from the total Jewish population numbers will give the main empirical trajectory for the non-immigrant native-born population, which begins with an exponential growth curve with a doubling time of about 18 years, or a compound growth rate of almost 4%/yr (). However, the data have deviated from the trend for about 20 years and thus seem likely to form an S-curve, which a logistic model can fit.
Figure 6. Estimated native Jewish population logistic trajectory and exponential fitted (dashed line) to data through 2000.
We can now combine the analyses of migrant and native populations into a composite multi-logistic model and compare the resulting forecast with others. The fitted line in sums the fitted logistics from .
Figure 7. Composite Jewish population growth trajectory based on the generalised logistic model combining the migration wave model with the logistic model for native Israeli Jewish population.
Israeli government agencies have modelled high, medium and low Jewish population projections based on various assumptions of birth rates and lifespan (Central Bureau of Statistics). The high and medium conform to exponential trends (y∝e0.022 and y∝e0.018, respectively), while the low forecast approximates a linear model (y∝0.116x). No probabilities are attached to the projections published, shown in along with a linear projection as well as our own logistic forecast fitted to historical data.
Figure 8. Historical data and projections of Jewish population in Israel since 1920. Source: Israel Central Bureau of Statistics and authors’ own projections.
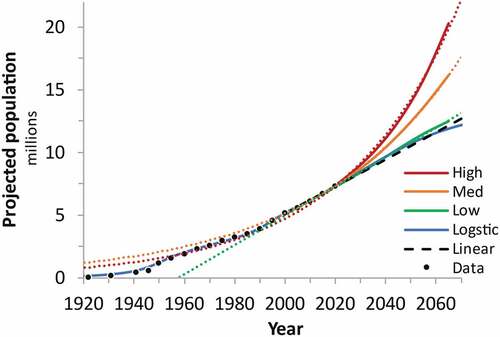
The results reported here fall in the low part of the range communicated elsewhere. Our results are consistent with some current projections of 9–10 million Jews in Israel by 2040Footnote33 but much lower than others giving nearly 19 million in 2050.Footnote34 Both the logistic and linear extrapolation of the prevailing trend results in a possible future population of a little less than 10 million Jews in Israel by 2050. We consider an estimate of 12 million Jews living in the region by the year 2050Footnote35 beyond the confidence intervals of our model and in conflict with little net migration and rising death rates even if assuming increased lifespan.
Discussion and conclusion
Notably, the full collection of disparate data sources employed in this article appears finally to offer a consistent story. Historically, the Jewish population in Israel conforms to a trend line consistent with the logistic model. We interpret the linearity as the outcome or sum of several curvilinear (logistic) processes. Consistent with linearity, approximately 100,000 per year will be added to the Jewish population. Because of the growing denominator, growth rates will decrease. In 2020 the Jewish population was 7.45 million, so growth was 1.01%, while if the population attains 9.8 million in 2050 the growth will fall to 0.8%. The logistic projection fits well with the recent decline in birth rates, which in 2020 fell nearly 5% from a peak in 2018, returning to the rate of 2014. Nonetheless, the growth rate remains substantially higher than the imploding Caucasian-European and various Far Eastern populations. Further analyses could consider subsets such as the Ultraorthodox (Haredi) Jews, who constitute distinct cultural groups with specific demographic characteristics and good data.
The logistic model relies on an envelope function intended to incorporate the aggregate effect of the demographic momentum underpinning myriad human decisions and behaviours that affect biological, technological and social outcomes. In the case of the Jewish population of Israel the model appears to capture well the historical behaviour of both the native population and migrants and their sum and thus provides a valuable reference scenario for a few decades ahead.
Acknowledgments
Thanks to Iddo K. Wernick for probing reviews of drafts of the paper and to Michele Filgate for editorial assistance.
Disclosure statement
No potential conflict of interest was reported by the author(s).
Additional information
Notes on contributors
David Burg
David Burg is Senior Lecturer at Tel Hai Academic College, Israel and affiliated with the Program for the Human Environment at The Rockefeller University, New York City.
Jesse H. Ausubel
Jesse H. Ausubel is Director of the Program for the Human Environment at The Rockefeller University.
Notes
1. Faitelson, “The Politics of Palestinian Demography”; and McCarthy, The Population of Palestine.
2. Mansour, “The Hijaz-Palestine Railway”; Norris, Land of Progress; and Owen, The Middle East in the World Economy.
3. Peel, “Palestine Royal Commission Report”; and Hutcheson and Singleton, “Report of the Anglo-American Committee of Enquiry.”
4. O’Reilly, International Migration and Social Theory; and Ravenstein, “The Laws of Migration.”
5. Glass, “Population Trends in Palestine”; and Peel, “Palestine Royal Commission Report.”
6. Bachi, “Maskanot Politiot Metoch Hakirotai”; and Bachi, “Ha’Ukhlusiya.”
7. ICBS, “Tahazit Ha’Ukhlusiya BeIsrael Ad 1985 (al Basis 1965).”
8. ICBS, “Society in Israel: Past, Present and Future Perspectives,” 2.
9. Courbage, “Demographic Trends and Challenges.”
10. Soffer, “Population Projections for the Land of Israel”; Della-Pergola, “Demography in Israel/Palestine”; Ravid, “The Demographic Environment of Israel”; Bystrov and Soffer, “Israel”; and Soffer, Israel, Demography 2003–2020.
11. Cannan, “The Probability of a Cessation of the Growth of Population in England and Wales”; Leslie, “On the Use of Matrices in Certain Population Mathematics”; and Whelpton, “An Empirical Method of Calculating Future Population.”
12. Keyfitz, “Can Knowledge Improve Forecasts?”
13. Pflaumer, “Forecasting U.S. Population Totals”; and Rogers, “Population Forecasting.”
14. Johansen and Sornette, “Finite-Time Singularity”; and Malthus, “An Essay on the Principle of Population.”
15. Verhulst, “Mathematical Investigations on the Law of Population Growth”; Pearl, “On the Rate of Growth of the Population of the United States”; and Lotka, Elements of Physical Biology.
16. Lutz, Sanderson, and Scherbov, “Expert-Based Probabilistic Population Projections.”
17. Leach, “Re-Evaluation of the Logistic Curve.”
18. Meade, “A Modified Logistic Model,” 491; and Hernando and Plastino, “Scale-Invariance Underlying the Logistic Equation.”
19. Gans and Gans, Population Forecasting 1895–1945; and Booth, “Demographic Forecasting.”
20. Gottheil, “Arab Immigration into Pre-State Israel”; and McCarthy, The Population of Palestine.
21. McCarthy, The Population of Palestine; Schmelz, “The Decline in the Population of Palestine”; and Schmelz, “Population of Palestine.”
22. Barron, “Palestine”; Esco, Palestine; Hutcheson and Singleton, “Report of the Anglo-American Committee of Enquiry”; and Peel, “Palestine Royal Commission Report.”
23. Schmelz, “The Evolution of Jerusalem’s Population”; Gilbert, Illustrated History Atlas; Lewis and Cohen, Population and Revenue; Schölch, “The Demographic Development of Palestine”; Gilbar, Ottoman Palestine; Sharkansky, Policy Making in Israel; Kark and Oren-Nordheim, Jerusalem and Its Environs; and Wasserstein, Divided Jerusalem.
24. Fargues, “Protracted National Conflict”; and Faitelson, “The Politics of Palestinian Demography.”
25. Verhulst, “Mathematical Investigations on the Law of Population Growth.”
26. Fisher and Pry, “A Simple Substitution Model of Technological Change.”
27. Meyer and Ausubel, “Carrying Capacity.”
28. Wu et al., “DEDiscover.”
29. Lewis, International and Business Forecasting Methods.
30. O’Haver and Begley, “Signal-to-Noise Ratio.”
31. Dunbov, “Public Letters on Ancient and Modern Judaism.”
32. Newberg, “The Pentecostal Mission in Palestine.”
33. Bechor, “Jewish Growth.”
34. WBG, “Population Estimates and Projections.”
35. Passig, 2048.
Bibliography
- Bachi, R. “Maskanot Politiot Metoch Hakirotaj al Hahitpathut Hademografit Shel Ha’yehudim Veha’arvim Be’Eretz-Israel (Hebrew).” Jerusalem: Israel Census Bureau, 1944. http://digitool.haifa.ac.il/webclient/StreamGate?folder_id=0&dvs=1424589810389~580
- Bachi, R. “Ha’Ukhlusiya (Hebrew).” Encyclopedia Judaica 6 (1956): 672.
- Barron, J. B. “Palestine: Report and General Abstracts of the Census of 1922.” Jerusalem: Greek Convent Press, 1922.
- Bechor, G. “Jewish Growth Despite What You’ve Been Told.” 2013. www.gplanet.co.il
- Booth, H. “Demographic Forecasting: 1980 to 2005 in Review.” International Journal of Forecasting 22, no. 3 (January, 2006): 547–581. doi:10.1016/j.ijforecast.2006.04.001.
- Bystrov, E., and A. Soffer. “Israel: Demography and Density,” 2012. http://web.hevra.haifa.ac.il/~ch-strategy/images/publications/pdf/demography_2007_en.pdf
- Cannan, E. “The Probability of a Cessation of the Growth of Population in England and Wales during the Next Century.” The Economic Journal 5, no. 20 (December 1, 1895): 505–515. doi:10.2307/2956626.
- Courbage, Y. “Demographic Trends and Challenges in case of Statehood in Palestine: 2012-2048.” In Palestinian Refugees: A Comparative Approach. Birzeit, Palestinian Authority: Adwa Design, 2013.
- de Gans, H. Population Forecasting 1895–1945: The Transition to Modernity. Dordecht, The Netherlands: Kluwer Academic Publishers, 1999.
- Della-Pergola, S. Demography in Israel/Palestine: Trends, Prospects, Policy Implications. IUSSP XXIV General Population Conference, Salvador de Bahia, Brazil. International Union for the Scientific Study of Population, 2001.
- Dunbov, S. “Public Letters on Ancient and Modern Judaism (1897-1907).” 1898.
- Esco. Palestine: A Study of Jewish, Arab and British Policies. Vol. 1. 2 vols. New Haven: Esco Foundation for Palestine, Inc. Yale University Press, 1947.
- Faitelson, Y. “The Politics of Palestinian Demography.” Middle East Quarterly 16, no. 2 (March 1, 2009): 51–59.
- Fargues, P. “Protracted National Conflict and Fertility Change: Palestinians and Israelis in the Twentieth Century.” Population and Development Review 26, no. 3 (September 1, 2000): 441–482. doi:10.1111/j.1728-4457.2000.00441.x.
- Fisher, J. C., and R. H. Pry. “A Simple Substitution Model of Technological Change.” Technological Forecasting and Social Change 3 (1971): 75–88. doi:10.1016/S0040-1625(71)80005-7.
- Gilbar, G. G., ed. Ottoman Palestine, 1800-1914: Studies in Economic and Social History. Leiden: Brill Academic Pub, 1990.
- Gilbert, M. Illustrated History Atlas. Jerusalem: Steimatzky, 1977.
- Glass, D. V. “Population Trends in Palestine.” The Eugenics Review 38, no. 2 (1946): 79–86.
- Gottheil, G. M. “Arab Immigration into Pre-State Israel: 1922-1931.” Middle Eastern Studies 9, no. 3 (1973): 315–324. doi:10.1080/00263207308700251.
- Hernando, A., and A. Plastino. “Scale-Invariance Underlying the Logistic Equation and Its Social Applications.” Physics Letters A 377, no. 3 (2013): 176–180. doi:10.1016/j.physleta.2012.10.054
- Hutcheson, J., and J. E. Singleton. “Report of the Anglo-American Committee of Enquiry regarding the Problems of European Jewry and Palestine.” Lausanne, Switzerland: H.M. Stationery Office, 1946. http://avalon.law.yale.edu/20th_century/angpre.asp
- ICBS. “Forecast of the Population in Israel until 1985, Based on 1965 (Hebrew).” Jerusalem: Israel Central Bureau of Statistics, 1968.
- ICBS. “Society in Israel: Past, Present and Future Perspectives.” Jerusalem: Israel Central Bureau of Statistics, 2013. http://www.cbs.gov.il/webpub/pub/text_page.html?publ=54&CYear=2011&CMonth=1
- Johansen, A., and D. Sornette. “Finite-Time Singularity in the Dynamics of the World Population, Economic and Financial Indices.” Physica A: Statistical Mechanics and Its Applications 294, no. 3 (2001): 465–502. doi:10.1016/S0378-4371(01)00105-4.
- Kark, R., and M. Oren-Nordheim. Jerusalem and Its Environs: Quarters, Neighborhoods, Villages, 1800-1948. Detroit, MI: Wayne State University Press, 2001.
- Keyfitz, N. “Can Knowledge Improve Forecasts?” Population and Development Review 8, no. 4 (December 1, 1982): 729–751. doi:10.2307/1972470.
- Leach, D. “Re-Evaluation of the Logistic Curve for Human Populations.” Journal of the Royal Statistical Society. Series A (General) 144, no. 1 (1981): 94. doi:10.2307/2982163.
- Leslie, P. H. “On the Use of Matrices in Certain Population Mathematics.” Biometrika 33, no. 3 (November 1, 1945): 183–212. doi:10.1093/biomet/33.3.183.
- Lewis, C. D. International and Business Forecasting Methods. London: Butter-Worths, 1982.
- Lewis, B., and A. Cohen. Population and Revenue in the Towns of Palestine in the Sixteenth Century. Princeton, NJ: Princeton University Press, 1978.
- Lotka, A. J. Elements of Physical Biology. Baltimore, MD: Williams & Wilkins Company, 1925.
- Lutz, W., W. C. Sanderson, and S. Scherbov. “Expert-Based Probabilistic Population Projections.” Population and Development Review 24 (January 1, 1998): 139–155. doi:10.2307/2808054.
- Malthus, T. R. “An Essay on the Principle of Population: Or, A View of Its past and Present Effects on Human Happiness,” 1888.
- Mansour, J. “The Hijaz-Palestine Railway and the Development of Haifa.” Jerusalem Quarterly 28 (2006): 5–21.
- Marchetti, C., P. S. Meyer, and J. H. Ausubel. “Human Population Dynamics Revisited with the Logistic Model: How Much Can Be Modeled and Predicted?” Technological Forecasting and Social Change 52, no. 1 (1996): 1–30. doi:10.1016/0040-1625(96)00001-7.
- McCarthy, J. The Population of Palestine: Population History and Statistics of the Late Ottoman Period and the Mandate. New York: Columbia Univ Pr, 1990.
- Meade, N. “A Modified Logistic Model Applied to Human Populations.” Journal of the Royal Statistical Society. Series A (Statistics in Society) 151, no. 3 (1988): 491. doi:10.2307/2982996.
- Meyer, P. S., and J. H. Ausubel. “Carrying Capacity: A Model with Logistically Varying Limits.” Technological Forecasting and Social Change 61, no. 3 (1999): 209–214. doi:10.1016/S0040-1625(99)00022-0.
- Newberg, E. N. “The Pentecostal Mission in Palestine, 1906-1948: A Postcolonial Assessment of Pentecostal Zionism.” Doctoral Thesis, Regent University, 2008.
- Norris, J. Land of Progress: Palestine in the Age of Colonial Development, 1905-1948. Oxford, UK: Oxford University Press, 2013.
- O’Haver, T. C., and T. Begley. “Signal-to-Noise Ratio in Higher Order Derivative Spectrometry.” Analytical Chemistry 53, no. 12 (October 1, 1981): 1876–1878. doi:10.1021/ac00235a036.
- O’Reilly, K. International Migration and Social Theory. Hoboken, NJ: Blackwell Publishing Ltd, 2013.
- Owen, R. The Middle East in the World Economy, 1800-1914. London: Bloomsbury Academic, 1993.
- Passig, D. 2048. Yedioth Ahronoth, 2013. http://books.google.co.il/books?id=4FDrmAEACAAJ
- Pearl, R., and L. J. Reed. “On the Rate of Growth of the Population of the United States since 1790 and Its Mathematical Representation.” Proceedings of the National Academy of Sciences 6, no. 6 (June 1, 1920): 275–288. doi:10.1073/pnas.6.6.275.
- Peel, W. R. W. “Palestine Royal Commission Report.” London: HM Stationery Office, 1937. http://unispal.un.org/unispal.nsf/5ba47a5c6cef541b802563e000493b8c/08e38a718201458b052565700072b358?OpenDocument
- Pflaumer, P. “Forecasting U.S. Population Totals with the Box-Jenkins Approach.” International Journal of Forecasting 8, no. 3, (November, 1992): 329–338. doi:10.1016/0169-2070(92)90051-A.
- Ravenstein, E. G. “The Laws of Migration.” Journal of the Statistical Society 48, (1885): 167–227.
- Ravid, I. “The Demographic Environment of Israel.” Interdisciplinary Center, Herzliya: Lauder School of Government, Diplomacy and Strategy, Institute of Policy and Strategy, 2001.
- Rogers, A. “Population Forecasting: Do Simple Models Outperform Complex Models?” Mathematical Population Studies 5, no. 3 (July 1, 1995): 187–202. doi:10.1080/08898489509525401.
- Schmelz, U. O. “The Evolution of Jerusalem’s Population.” In Urban Geography of Jerusalem: Companion Volume to the Atlas of Jerusalem, 53–75. Jerusalem, Israel: Hebrew University, 1973.
- Schmelz, U. O. “The Decline in the Population of Palestine during World War I.” In Siege and Distress: Eretz Israel during the First World War, edited by M. Eliav, 17–47. Jerusalem: Yad Yitzhak Ben Zvi, 1991.
- Schmelz, U. O. “Population of Palestine: Population History and Statistics of the Late Ottoman Period and the Mandate by Justin McCarthy.” Middle Eastern Studies 28, no. 4 (October 1, 1992): 803–807. doi:10.2307/4283531.
- Schölch, A. “The Demographic Development of Palestine, 1850–1882.” International Journal of Middle East Studies 17, no. 4 (November, 1985): 485–505. doi:10.1017/S0020743800029445.
- Sharkansky, I. Policy Making in Israel: Routines for Simple Problems and Coping with the Complex. Pittsburgh, PA: University of Pittsburgh Press, 1997.
- Soffer, A. “Population Projections for the Land of Israel.” Middle East Review 20 (1988): 43–49.
- Soffer, A. Israel, Demography 2003-2020: Dangers and Opportunities. Haifa: National Security Studies Center, 2003.
- Verhulst, P. F. “Mathematical Investigations on the Law of Population Growth.” In Annotated Readings in the History of Statistics. Springer Series in Statistics, edited by H. A. David and A. W. Edwards, 69–75. New York: Springer, 2001. doi:10.1007/978-1-4757-3500-0_12, 1845.
- Wasserstein, B. Divided Jerusalem: The Struggle for the Holy City. New Haven: Yale University Press, 2001.
- WBG. “Population Estimates and Projections.” Washington, D.C: The World Bank Group, 2015. https://databank.worldbank.org/data/reports.aspx?source=Health%20Nutrition%20and%20Population%20Statistics:%20Population%20estimates%20and%20projections;https://siteresources.worldbank.org/INTWESTBANKGAZA/Resources/EducationSectorAnalysisSept06.pdf
- Whelpton, P. K. “An Empirical Method of Calculating Future Population.” Journal of the American Statistical Association 31, no. 195 (September 1, 1936): 457–473. doi:10.1080/01621459.1936.10503346.
- Wu, H., G. R. Hongyu Miao, C. W. Warnes, A. LeBlanc, C. Dykes, and L. M. Demeter. “DEDiscover: A Computation and Simulation Tool for HIV Viral Fitness Research.” In International Conference on BioMedical Engineering and Informatics, 2008. BMEI 2008, Vol. 1, 687–694, 2008. doi:10.1109/BMEI.2008.288.