
ABSTRACT
Despite recent progress, women are still disadvantaged by their greater domestic labor commitments and impaired access to well-paid jobs; and, in extreme cases, denied the right to live. This has consequences for the well-being of individuals and economic development. Although tools to evaluate country performance in gender equality, especially composite indicators, have been developed since the 1990s, a historical perspective is lacking. This study introduces a composite index of gender equality covering 129 countries from 1950 to 2003. This index measures gender equality in four dimensions (socioeconomic, health, household, and politics). The index shows substantial progress in gender equality, though there is little evidence that less gender-equal countries are catching up. Goldin's “quiet revolution” hypothesis is tested as an explanation for this observation, but fails to provide a good explanation. Rather, the long-term institutional and historical characteristics of countries are the main obstacles to convergence.
INTRODUCTION
“I do not wish them [women] to have power over men; but over themselves.”
― Mary Wollstonecraft, A Vindication of the Rights of Woman (1792)
In 1792, Mary Wollstonecraft set out her principles for the emancipation of women: education of girls on the same footing as boys, an end to prejudice against women, and that women should be evaluated on their own merits rather than achievements of their partners. The past 200 years has seen marked improvements in these respects, as well as many that Wollstonecraft could never have foreseen. Women have gained far-ranging legal rights, such as near-universal women's suffrage and the implementation of legislation in many countries to ensure gender equal inheritance. Girls around the world have achieved vastly increased educational attainment both in absolute terms and relative to their male compatriots, and women everywhere can now expect to outlive men (World Bank Citation2011).
However, for all the progress that has been made, the elimination of discrimination against women has not been achieved. For instance, globally only 23 percent of parliamentarians are women. One-third of girls in the developing world are married before age 18, and one in nine before age 15 (International Center for Research on Women Citation2014). The Organisation for Economic Co-operation and Development (OECD; Citation2015) highlights that gender inequality in access to primary schooling is an issue in sixty-eight countries. More women have entered the paid workforce in recent decades; however, they typically work in the informal sector, characterized by poor earnings and insecurity (OECD Citation2015). Thus, from the persistence of gender pay gaps to the 65–110 million women missing in 2002 due to discriminatory access to medical or dietary resources throughout their lives (Klasen and Wink Citation2002), to this day women have not achieved equality with men in terms of institutional treatment or well-being outcomes.Footnote1
This inequality between men and women is not just intrinsically but also instrumentally important. Over the past decades, policymakers and scholars have started to view gender equality as “smart economics.”Footnote2 Gender inequality has been shown to play a key role in a wide range of development outcomes. Improving women's relative access to resources and legal standing improves children's education (Strauss and Thomas Citation1995; Currie and Moretti Citation2003), reduces corruption in government (Dollar, Fisman, and Gatti Citation2001), and increases economic growth (Klasen and Lamanna Citation2009).Footnote3
Given the relevance of gender equality for development, numerous attempts have been made to measure gender inequality on a global scale. Because gender inequality is a multifaceted concept (Sen Citation1990), measuring it is often done using multiple indicators. No single measure can hope to capture all the dimensions in which gender inequality can occur. For example, looking at multiple indicators shows that while a country like China has achieved parity between the sexes in educational attainment, the ratio of girls to boys indicates a strong son-preference and the related practice of sex-selective abortion.
To compare the overall performance of countries in achieving gender equality, a measure is needed that combines these multiple indicators. Combining data into a composite index brings together different dimensions into a single standardized value. These sorts of indices give insights into overall gender inequality at a national level (World Bank Citation2014).
The attractions of a composite indicator have resulted in the development of numerous measures. The first were the United Nations Development Programme's (UNDP) Gender-Related Development Index (GDI) and Gender Empowerment Measure (GEM), introduced in 1995 to capture the gender dimension of human development. Since then, and in response to various criticisms of the United Nations’ measures, many more indices of gender inequality have appeared (Klasen and Schüler Citation2011). These include the World Economic Forum's Global Gender Gap index, the African Gender Status Index, Social Watch's Gender Equality Index, and the Women's Economic Opportunity Index. Yet all these measures lack historical coverage. The GDI, which starts in 1995, is the earliest available composite indicator and was replaced in 2010 by the Gender Inequality Index (Klasen Citation2006).Footnote4 As a result, there is little work using indices to explore how gender equality develops over time. This raises questions such as: How has the status of women relative to men changed? When do shifts occur, and what can explain them?
A long-term perspective is desirable for multiple reasons. Gender relations have historical roots and do not change overnight. For instance, Alberto F. Alesina, Paola Giuliano, and Nathan Nunn (Citation2013) attribute current-day gender inequalities to traditional agricultural practices and find that the descendants of immigrants from societies traditionally practicing plough agriculture have less equal gender norms and lower female labor force participation today. These deep roots mean that historical measures are needed to understand how gender inequality is determined and evaluate progress. Such data are also necessary for testing more familiar theories on the determinants of gender equality, such as the role of modernization, institutions, or the presence of a nonlinear relation between gender equality and development (Boserup Citation1970; Humphries Citation1993; Goldin Citation1995; Eastin and Prakash Citation2013; Dilli, Rijpma, and Carmichael Citation2015). It can also help establish the robustness and direction of causality of the link between women's empowerment and development (Doepke, Tertilt, and Voena Citation2012).
Recent literature on gender equality has begun to provide such a long-term perspective. For instance, Shawn F. Dorius and Glenn Firebaugh (Citation2010) describe the global decline in gender inequality in terms of health, education, political representation, and economic activity from 1960 onward. The 1995 Human Development Report (UNDP Citation1995) back-calculates the GDI for 1970 and compares it to 1992. Recent reports by the World Bank (Citation2011, Citation2014) also make long-term comparison of countries’ experiences with regard to achieving gender equality. Our aim is to contribute to this literature by introducing a composite index, which will allow for more systematic analyses of the long-term development of gender equality.
This paper introduces the Historical Gender Equality Index (HGEI), capturing various dimensions of gender equality from at least 1950 onward. To our knowledge, the HGEI is the first composite index to allow for such long-term global comparisons. Our measure captures gaps between the genders rather than absolute levels of achievement. The index shows worldwide progress in gender equality, even those who initially performed poorly such as countries in the Middle East and North Africa (MENA), Sub-Saharan Africa, and South Asia. However, while there is progress, there is little evidence for convergence. The main hurdles are economic development and institutional arrangements.
IMPORTANCE OF HISTORY IN UNDERSTANDING THE ROOT CAUSES OF GENDER INEQUALITY
Gender inequalities persist in every part of the world today. However, the nature and the size of inequalities between men and women are not universal (Sen Citation2001). For instance, Scandinavian countries usually rank high in gender equality indices, whereas countries like Yemen and Jordan perform poorly.Footnote5 The fields in which women face inequality today also differ between countries. In China and India, gender inequalities are most obvious in skewed sex ratios resulting from son preference. In terms of political representation of women in parliament, Bolivia, Rwanda, and South Africa outrank some of the most affluent societies in the world (Inter-Parliamentary Union Citation2015). Without incorporating a long-term perspective, however, it is hard to determine whether these differences are new developments or not.
A short-term perspective would miss the gains made by women in terms of life expectancy since the 1980s, as women now outlive men everywhere in the world (Carmichael, Dilli, and Rijpma Citation2014). Similarly, Rwanda, Bolivia, and Andorra overtook the top performers of 1995 (Scandinavia) in the representation of women in parliament (Inter-Parliamentary Union Citation2015). The impact of China's one-child policy on missing girls can only be observed if the evolution of sex ratios since before the 1980s is taken into account (World Bank Citation2011). Finally, while women could inherit property only in a few Western European countries at the beginning of the twentieth century, today gender egalitarian inheritance practices are the norm throughout the world, except in a number of MENA and Sub-Saharan African countries.
Another motivation for a historical approach is that it is needed to analyze the relationship between gender equality and economic development. Contrary to the more recently developed expectation that industrialization would increase the living standards of women and promote gender equality (Goode Citation1963), scholars have observed that the Industrial Revolution created a male breadwinner economy in England (Goldin Citation1995; Horrell and Humphries Citation1995). Claudia Goldin (Citation2006) proposes that the growth in women's labor force participation in the United States from 1930–50 was due to the increase in service-sector jobs, which is not observable without time-series data. For China, Laurel Bossen et al. (Citation2011) show that as mass-produced textiles replaced domestic production, women's confinement to the household was questioned, and with it the practice of footbinding.
The position of women is also determined by norms and values, which can be persistent and rooted in long-lasting institutions, rather than following the development process (Alesina, Giuliano, and Nunn Citation2013; World Bank Citation2014). For instance, a number of scholars have observed that women in Northwestern Europe entered labor markets in significant numbers well before the Industrial Revolution, when the region was still poor by today's standards (Horrell and Humphries Citation1995; De Moor and van Zanden Citation2010). After controlling for the level of socioeconomic and political development, Boris Branisa, Stephan Klasen, and Maria Ziegler (Citation2013) find in a cross-country study that in the period after 2009 discriminatory social institutions are associated with women's lower education levels and higher fertility and child mortality rates. The disadvantages experienced by women in the MENA have been attributed to cultural and religious customs and laws concerning marital and inheritance practices (Htun and Weldon 2011). Likewise, polygamy is a persistent family practice in many Sub-Saharan African countries and is associated with negative health outcomes such as depression, anxiety, and sexually transmitted infections (STIs; Bove and Valeggia Citation2009). Taken together, these examples suggest that practices disadvantaging women are distinct and longstanding, probably going back centuries.
INTRODUCING THE HISTORICAL COMPOSITE GENDER INEQUALITY INDEX
To provide measures and advocacy tools to highlight gender inequality, many organizations have developed composite indices (an overview can be found in Tables A1 and A2 in the Supplemental Online Appendix). We focus our discussion here on the choices made in developing the HGEI.
A. Geske Dijkstra's four requirements for the construction of a gender equality index guide our choices in constructing the HGEI: “(1) It should cover a limited number of indicators, but these indicators together should cover as many dimensions of gender equality as possible; (2) Data should be available for many countries; (3) It should be simple to calculate and to understand; (4) It should allow comparisons between countries but also over time” (2006: 276).
We aim to provide a global overview of gender equality in the long run. Data availability thus plays a role in determining the dimensions included in the HGEI. As discussed earlier, a large share of the evidence on the drivers of gender equality is based on recent cross-sectional data. However, due to the shortcomings of cross-sectional data analysis in causal identification, the recent literature has increasingly directed its attention to methods such as experimental design and instrumental variables. While these methods may outperform the cross-sectional approach, they face issues such as external validity and exclusion restrictions. Therefore, long-term panel data can help in establishing the robustness and direction of causality of the link between gender equality and development (Doepke, Tertilt, and Voena Citation2012). Panel data are useful in eliminating time-invariant characteristics and allow for the inclusion of lags of explanatory variables to account for the length of time it takes to affect the dependent variable (Finkel Citation1995). Given the deep roots of current gender inequality outcomes (Alesina, Giuliano, and Nunn Citation2013), the fact the HGEI only covers the period from 1950s onward is not ideal. However, given the short-time span covered in the current indices, our index still adds to the literature and to the tools available for evaluating changes in the position of women relative to men over time.
Our main aim is to give an indication of gender disparities in well-being outcomes that result from institutional, cultural, and social influences (OECD Citation2011). These well-being dimensions were chosen following the conceptual framework of How's Life? (OECD Citation2011; Carmichael, Dilli, and Rijpma Citation2014). Not all key issues included in contemporary gender inequality indices could be covered. It was not possible, for instance, to include income or access to high-paying jobs, even though they are crucial factors for the economic standing of women (Kabeer Citation1999).Footnote6 Similarly, the Social Institutions and Gender Index (SIGI) brings together data on a variety of social institutions that influence gender inequality (Jütting et al. Citation2008); however, it is hard to capture the same variables in a historical context. Data on time allocation (or access to leisure and sleep) are challenging to obtain nowadays, let alone for the historical period. Historical data for bodily autonomy might become available in the future, but at this time we cannot include them in our index.Footnote7
Dimensions of gender equality and subindices used to capture them
Here we discuss the indicators covered in the HGEI and how they matter for gender equality. In the HGEI, these dimensions are captured in subindices. All the gender indices mentioned above capture different areas in which gender inequality can occur. While we aim to capture the same features of society encompassed by current indices, the dimensions captured in the HGEI differ slightly (see the Supplemental Online Appendix). The ratio of women to men has been taken for all measures to capture the gap in performance between the genders.
Health
Access to health resources and a healthy life are key to enjoying other aspects of well-being (Sen Citation1999). In our framing, health has two elements: birth, and once born, being able to live a life of normal length in good health (Robeyns Citation2003). To capture gender differences, we use sex ratios and life expectancy ratios.
Women's health can be evaluated by looking at sex ratios, based on Amartya Sen's (Citation1992) concept of missing women. While there are no indications of gender bias in the chances of being born in Western societies, sex-selective abortion has led to millions of “missing girls” in societies where son preference is prevalent (for example, China or India). We calculate the ratio of girls to boys in the age category 0–5. We focus on this age category rather than later stages of life for two reasons. The first is that three-fifths of missing women go missing in the birth–childhood period. Second, the phenomenon of missing girls at birth reflects discrimination in the household, resulting from the combination of son preference combined with declining fertility and the spread of technologies to determine the sex of the child before birth (World Bank Citation2011). Missing women at later stages of the life-course reflect not only discriminatory practices against women, but also issues of general development, such as lack of healthcare or water and sanitation infrastructure (World Bank Citation2011). Thus, relying on data from Mitchell (Citation2007) and the UN's (Citation2013b) World Population Prospects, our measure specifically focuses on a sex-selection bias in the period of early infancy, where the bias is caused by abortion, infanticide, and the possibility that young girls are systematically less cared for (Anderson and Ray Citation2010).
Although currently women's life expectancy is higher than that of men's globally, this was not so in 1900. In particular, South and Southeast Asia have seen substantial gains in women's life expectancy over the past fifty years (Carmichael, Dilli, and Rijpma Citation2014). Inequality in life expectancy is associated with nutritional inequality and unequal access to medical care. Life expectancy thus sheds light on physical well-being (UNDP Citation2014). To evaluate this, we rely on data from the UN (Citation2013a). There is a low correlation between the sex ratio and the life expectancy ratio (not exceeding 0.37 and usually much lower), meaning the two indicators pick up different aspects of gender inequalities in health.
Autonomy within the household
The household is where key decisions regarding education, marriage, and labor force participation are made. Interfamilial relations are argued to play a central role in women's disempowerment (Malhotra Citation2003). On average, women do more nonmarket care than men for children, the elderly, and the sick (Robeyns Citation2003). Gender equality in the household is therefore important for women and children's well-being as well as their economic activities.
We use marriage ages to capture gender differences in the household. Child brides are the most extreme example in this dimension, having implications for the well-being of women throughout their lives and for the overall well-being of societies. The World Bank (Citation2014) observes that each year, almost one in five girls in developing countries become pregnant before her 18th birthday. Besides high fertility rates, early marriage ages also lower life expectancy and increase child and maternal mortality. In developing countries, pregnancy-related complications are the largest cause of mortality for girls ages 15–19, resulting in nearly 70,000 deaths annually. Early marriage ages are also predictive of domestic violence outcomes in the household (Kishor and Johnson Citation2004).
The data on women's singulate mean age at marriage (SMAM) and men's SMAM come from Sarah Carmichael (Citation2011), based on various resources published by the UN, World Bank, Demographic Healthy Surveys, John Hajnal (Citation1965), and national censuses. The SMAM statistic is a calculation of the average length of single life of those who marry before age 50 (Hajnal Citation1965; UN Citation2008). Where the age gap between spouses is low, it is more likely that the partnership will be an equal, companionate one. A large difference in marriage ages is likely to reflect an unequal position of spouses, and even arranged and child marriage (Caldwell, Reddy, and Caldwell Citation1983).
Political power
Political power and representation for women are key to ensuring that that their well-being is taken into account in the political process. Despite improvements over the twentieth century, women's participation in national parliaments remains one of the major challenges to achieving gender equality globally: less than a quarter of the world's parliamentarians are women (Carmichael, Dilli, and Rijpma Citation2014). Empowering women in the field of politics is important for both intrinsic and instrumental reasons. For instance, in India, educational and health investments were higher in states where women parliamentarians had a larger share of seats (Clots-Figueras Citation2012).
To capture the political position of women, we focus on national parliaments. Data on the percentage of seats in parliament held by women come from Pamela Paxton, Jennifer Green, and Melanie M. Hughes’ (Citation2008) dataset. The percentage of women in parliament provides only limited insight. Data on conventional forms of political participation (such as voting trends) would provide more information about women's agency; however, these are unavailable due to secret ballot systems, and capturing other, unconventional forms of political participation – such as protesting – with quantitative methods is extremely challenging.
Socioeconomic status
Access to knowledge is in itself important (Sen Citation1999), but increasing women's education also matters for increasing women's capacity to make meaningful life decisions and development in general (Klasen and Lamanna, Citation2009). The World Bank (Citation2014) highlights that around the world, better-educated women are often better able to make choices and implement decisions, even where gender norms are restrictive. For example, in South Asia and the MENA, more educated women are less likely to ask their husband's or family's permission to seek medical care. However, even in Western industrialized countries, where gender differences in education at the macro level have narrowed substantially, young women are still less likely to choose science, technology, engineering, or mathematics subjects at the tertiary level, translating into occupational segregation, and associated wage differences (OECD Citation2011). This, however, is not captured in the measure employed here: average years of education.
Employment is closely linked to material resources. The income it generates gives women the ability to live their lives independently of men and strengthens their bargaining position in the household. Goldin (Citation2014) attributes a major role to the employment of women in explaining the converging gender roles of men and women, which she describes as one of the key developments in the last century. The World Bank (Citation2014) also argues that employment is instrumental for women's agency. In Bangladesh, for example, women working outside the home, both in formal and informal employment are more likely to vote. Moreover, on average, women who work in wage employment have more control over household resources. Evidence from developing countries shows that poor women devote the largest share of the financial resources they control to family rather than personal needs (Agarwal Citation1997).
To capture differences in the socioeconomic position of men and women, we use data on educational attainment and labor force participation. Robert J. Barro and Jong-Wha Lee's (Citation2013) educational attainment dataset has the best global coverage split by gender. We use average years of schooling among the adult population ages 25 and over for men and women. The gender gap in labor force participation is calculated based on data from the International Labour Organization (Citation2010). We take the ratio of women to men active in the labor force.
Method
Missing values
In a long-term composite indicator, missing values can be an issue. In historical time series, missing observations are likely to exist; and if any of the six indicators were missing, we would be unable to calculate the HGEI for that country and year. Because all the indicators capture important aspects of gender equality, we would prefer not to exclude indicators to improve coverage.
To solve this, a multiple imputation method was used, which estimates the missing values using a bootstrap-based expectation maximization (EM) algorithm (Honaker, King, and Blackwell Citation2011). This technique has been shown to outperform other commonly used techniques in dealing with missing values (Allison Citation2002). It also prevents “loss of valuable information and severe selection bias” (King et al. Citation2001: 49).
Prior to multiple imputation, countries that had no observation for any of the variables were dropped, so that we had at least one observation for each variable before the values were imputed. This left 129 countries with information on all the dimensions.
We used Amelia II to predict the missing values for all the indicators presented in Table . Amelia II can impute the missing values separately for each country and each wave of the countries (Honaker, King, and Blackwell Citation2011). Ignoring the nested structure of the data (years nested within countries) would result in imprecise imputations (van Buuren Citation2010). To get more precise imputations of missing values, we included auxiliary variables, namely: economic development (gross domestic product [GDP] per capita), religion (percentage Catholics, Protestants, or Muslims), total public spending on education as a percentage of GDP, oil rents as a percentage of GDP, and the percentage labor force employed in industrial and service sector. All these indicators are included as they have been shown to be related to overall country-level gender equality (Spierings, Smiths, and Verloo Citation2009). The data coverage and the descriptive statistics of the variables after imputation are provided in Table .
Table 1 Overview and summary statistics of the components of the HGEI before imputation
To get a sense of how our imputation technique influences the trends in the HGEI, we also imputed the data using a log-linear interpolation technique. Figure A1 in the Supplemental Online Appendix plots the regional trends of the HGEI based on the two methods that result in no large differences.
Construction of the HGEI
In constructing the HGEI, we take into account the critiques of the GDI and the GEM raised by Dijkstra (Citation2006) and Stephan Klasen and Dana Schüler (Citation2011). Both highlight the need for an index that measures the position and status of women relative to men, independently of the absolute levels of income per capita or overall human development. Moreover, the index should be comparable between countries and over time. They also argue for an index that is straightforward to calculate and interpret. As Iñaki Permanyer (2010: 184) points out, techniques like latent variable models can produce “sophisticated results” that are difficult for researchers and policymakers to interpret.Footnote8
Our primary interest is a composite measure that is easily comparable over time and between countries (Dijkstra Citation2006). By focusing on ratios rather than levels, we evaluate the position of women relative to men in a given society rather than the actual levels of resources and opportunities available to women (Bericat Citation2012). Following Ricardo Hausman, Laura D. Tyson, and Saadia Zahidi's (Citation2012) Global Gender Gap index (GGG), our measures are in ratios.Footnote9 This allows both for comparisons between countries, as well as a notion of an ideal level of equality. Leaving the equality benchmarks fixed over time means that comparisons can be made between years. Moreover, measured gender inequality is independent of a country's level of development. Finally, ratios provide a straightforward interpretation of countries’ progress over time in each dimension and the overall index (Hausman, Tyson, and Zahidi Citation2012).
A number below 1 indicates inequality biased against women; 1 reflects perfect equality; and a value above 1 would mean inequality biased against men. For ease of interpretation, we set an equality benchmark for all the variables to be 1, except for sex ratios where the equality benchmark is set to 0.944.Footnote10 In its gender equality indices, the UN assumes that, due to biological advantages, women live on average five years longer than men (Austad Citation2006; Eskes and Haanen Citation2007). Before calculating the ratio, we corrected for this difference.Footnote11 We truncate the ratios at the equality benchmark for each variable. This assigns the same score to a country that has reached parity between men and women and one where women have surpassed men. Thus, as in Hausman, Tyson, and Zahidi's (Citation2012) GGG, the HGEI assesses how women are performing relative to men, but it does not penalize countries for having surpassed the equality benchmark.
As a third step, we calculated the weighted average of each of two of the subindices (health and socioeconomic status) to avoid a single measure driving the variation in the subindex. Because household and politics are captured by single components, no weighting procedure was necessary. Following the GGG index, we normalize the variables in each subindex by determining what a 1 percent point change would translate into in standard deviations (calculated by dividing 0.01 by the standard deviation of each variable).Footnote12 The weights are presented in Table .
Table 2 Weights for the HGEI
Table 3 Overview and description of the variables after imputation
Finally, we calculated an arithmetic average of the four subindices and multiplied it by 100. Our measure thus ranges from 0 to 100, where 100 is a score indicating women have at least achieved an equal position to men on each of the indicators in our index.
It has been argued that the geometric mean is most suitable when working with ratios (Permanyer Citation2010; Klasen and Schüler Citation2011; Bericat Citation2012). One reason is that it would not allow ratios above 1 to compensate for ratios below 1; that is, it should not be possible for a disadvantage to men to compensate for a disadvantage to women. However, we follow the strategy of Hausman, Tyson, and Zahidi (Citation2012), which deals with cross-compensation by truncating values above 1 and taking the arithmetic mean. While this procedure means we lose some information about inequality, it is suited to our index in a number of ways. Firstly, we are interested in the long-term trend from gender inequality to gender equality: historically, situations where men were disadvantaged relative to women are rare. Moreover, using this procedure prevents the HGEI being driven largely by a single indicator that is continuously low. In our case this prevents political participation, which is low throughout the period, from masking substantial advances in all the other indicators.Footnote13 A final, related point is that using the arithmetic mean provides a more easily interpretable index. A geometric mean would also introduce further complexity by introducing non-constant trade-offs between the indicators (Ravallion Citation2012).
Our data on the HGEI index, which provide information for 129 countries annually from 1950 to 2003, are available online on the Clio-infra website. The data can be accessed at the following link: https://www.clio-infra.eu/Indicators/HistoricalGenderEqualityIndex.html.
Shortcomings of the HGEI
Like other composite indices of gender equality, the HGEI has shortcomings. For one, our measure does not capture how women are doing in absolute terms, but only relative to men. Achieving conceptual coherence prevents combining absolute and relative measurements of attainment in the same index (Bericat Citation2012). However, focusing on gender inequalities rather than attainment comes at the cost of being unable to say whether gender gaps are closing over time due to the improving position of women or worsening position of men. In Eastern Europe, for instance, research shows that mortality for men has increased, often attributed to lifestyle factors related to tobacco and alcohol (McKee and Shkolnikov Citation2001; Rehm et al. Citation2007). This means that improvements in gender equality in this indicator are not always solely due to an improvement of the position of women.
Moreover, composite indicators, our own included, are usually calculated on the macro level, that is, for countries or states. This means they face criticism for their aggregated approach, as gender inequality affects people at the individual level (Robeyns Citation2003). As a result, we are not able to capture the diversity and the size of the gender gap between individuals or groups within countries.
Furthermore, truncating the ratios at the equality benchmark for each variable implies that rather than gender inequality in a given society, we can only provide insight into the extent to which women are disadvantaged relative to men, and cannot show if there are cases where women are performing better than men. Another issue arises from the requirement that composite gender equality measures evaluate countries’ performances independent of their income level. We try to deal with this by taking ratios. However, our measures of gender equality may still be dependent on the overall level of development, for example women's labor force participation being higher when there is a large tertiary sector.
Lastly, we cannot provide a full overview of gender disparities in all the dimensions captured by other composite indices. Women's income, an important component of socioeconomic resources, is not included, as historical data on wages disaggregated by gender are only sparsely available. We also cannot capture unequal distribution of housework, which is related to women's well-being (Klasen Citation2004) and to the position of women outside the household, linked as it is to political or labor force participation (Verba, Burns, and Schlozman Citation1997; van der Lippe et al. Citation2011). We also do not cover issues related to the institutional structure of societies, which plays a crucial role in the opportunities available for women, for example, inheritance rights or freedom of movement (Jütting et al. Citation2008).Footnote14 This choice is made on the basis of a lack of data, but also due to the fact that such measures do not translate easily into ratios.
To explore how the HGEI compares to current-day indicators, we plot the HGEI in 2000 against the GII, the GGG, the SIGI, and Women's Economic Opportunity Index (WEOI; see Supplemental Online Appendix Figure A3). Despite the difference in the choice of measures and methodology in constructing the indices, overall the HGEI corresponds well with current-day indices.
Our motive for constructing the HGEI was to investigate whether there are institutional and cultural roots to gender equality. While we are especially interested in historical institutions and culture and the SIGI is only available for recent years, the slow-changing nature of institutions and culture means a comparison with the SIGI is still illuminating (Branisa, Klasen, and Ziegler Citation2013). Apart from parliamentary activity and sex ratios, our indicators show a strong relationship with the SIGI family code index (see Supplemental Online Appendix Figure A4). This highlights the importance of cultural practices regulating family life, supporting the findings of Dilli, Rijpma, and Carmichael (Citation2015) that family systems are relevant in explaining long-term cross-sectional differences in gender equality. The weak correlations with parliamentary activity and sex ratios might be driven by recent developments, such as legislation and the availability of sex-selective abortion.
CHARACTERIZING TRENDS IN GENDER EQUALITY
provides the growth rate of the HGEI for each country compared with their starting value in the 1950s and 1980s.Footnote15
Figure 1 HGEI levels and growth: 1950s–90s and 1980s–90s
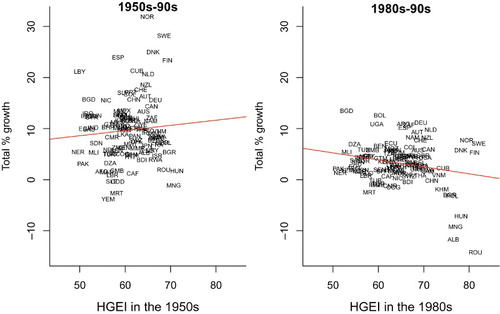
Since the 1950s, gender equality and its growth have displayed diverse patterns. Although Western Europe and its offshoots are generally the best performers, in the 1950s, Denmark, Canada, and Australia had gender gaps similar to countries in Sub-Saharan Africa, Latin America, and the former Soviet Union and Eastern Europe (for example, Botswana, Uruguay, and Albania). Among these countries, while Denmark has made the most progress in closing the gap since 1950, Yemen made the least progress. Within regions there is also substantial variation. Progress in the MENA in closing the gender gap differs substantially. Libya, for instance, was the least gender equal in 1950, but made the most progress (a similar growth rate to the Netherlands), whereas progress was much more limited in Egypt. Yemen and Mauritania had particularly marked gender inequality in 1950, but over time their gender gap actually grew.
The overall pattern from the 1950s to the 1980s is divergence: countries with a low HGEI score in the 1950s grew less than countries with a high score. Only from the 1980s onward can convergence be observed, in part driven by a decrease in gender equality in the former socialist countries in the 1990s (though it can also be observed when considering growth to the 2000s).
Whether the trends in gender equality are characterized by convergence or divergence is tested more formally in Table . The growth rate of the HGEI per decade is regressed on the lag of the level of the HGEI. Progressively more controls are added to check for conditional convergence and to test the extent to which the results were driven by biases in the fixed-effects models (Barro Citation2012; Croissant and Millo Citation2008).
Table 4 Panel regressions of growth rate on lag of HGEI: 1950s–90s
There was no unconditional convergence in the HGEI over the entire period. On the contrary, there is slight divergence: countries scoring a point higher on the HGEI had a 0.06 percentage point higher decennial growth rate. This would make only a minor difference over the entire period. The fixed-effects model too shows no sign of unconditional convergence.
Controlling for the level of economic development by including the log of GDP per capita makes little difference. The coefficient on the growth rate becomes negative, indicating convergence, but the effect is small (0.02 percentage points) and not statistically significant. Only the fixed effects model displays significant convergence conditional on per capita GDP, though estimating convergence this way is known to have a downward bias (Barro Citation2012).Footnote16 Supplemental Online Appendix Table A4 reports regressions for subperiods, which show slight unconditional convergence (0.13 percentage points) from the 1980s onward and convergence conditional on economic development from the 1970s onward (0.26 percentage points).
The fixed-effects model also controls for long-term institutional and historical characteristics, which in themselves might be important as a source of persistent gender equality. To investigate this further, convergence was estimated, controlling for historical and institutional characteristics that influence gender equality, such as religion, legal systems, and family organization. Time-varying variables such as educational expenditure, the Polity 2 score, and the institutionalization of gender equality, which captures the effect of international initiatives, were also included. The justification of this exercise is twofold. Firstly, countries with historical institutions that are detrimental to the position of women might experience slower growth toward gender equality. Moreover, it is worthwhile testing whether the indicators relevant for explaining cross-national differences in the level of gender equality (Dilli, Rijpma, and Carmichael Citation2015), are also relevant for how progress toward gender equality is made.
Once institutional and cultural variables are controlled for, conditional convergence is found: countries with 1-point higher HGEI grow 0.27 percentage points per decade slower. However, at average growth rates and HGEI levels, this would still only lead to a 0.5-point increase in the HGEI over the entire period. In sum, unconditional convergence is absent and conditional convergence is weak.
Turning to the impact of the explanatory variables in Model 5, countries with higher economic development, investing more in education and which have participated in international gender-equality initiatives for a longer time, have a higher growth rate in the HGEI. The long-term institutional variables show less significant results when explaining the cross-national differences in the growth rates in gender equality.
Besides the importance of long-term characteristics of countries for progress toward gender equality, other mechanisms might drive the lack of convergence. Goldin (Citation2006) has pointed to a “quiet revolution” from the late 1970s onward in a broad range of indicators of gender equality. These originated from changing expectations among women about their careers, in turn due to three proceeding evolutionary phases of increasing women's labor force participation in the tertiary sector. If these revolutions mostly occurred in developed countries, which already had high gender equality, this trend could obstruct convergence.Footnote17
To test for this possibility, we looked for breakpoints in the annual HGEI series for each country by comparing linear models of a time trend before and after each year using F-tests (Zeileis et al. Citation2002).Footnote18 shows the timing of breakpoints leading to higher growth in the HGEI for countries broken down by income group: low, middle, and high (World Bank Citation2015). Indeed, around 1980, many countries’ HGEI growth rate increased. However, these breakpoints were not exclusive to developed countries and countries that already had a high HGEI. Indeed, some of the earliest breakpoints occur in low-income countries. Breakpoints in these countries occur at lower levels of the HGEI and their progress afterward is less consistent. In sum, the HGEI shows some evidence for Goldin's (2006) idea of a quiet revolution. However, we also find breaks in developing counties, making them an unlikely explanation for the lack of convergence.
Figure 2 Breakpoint dates in HGEI by income group
CONCLUSION
Gender equality is important not only from the intrinsic perspective that women should not be denied well-being, but also from the policy perspective that empowering women has a positive effect on other development outcomes. For these reasons, many attempts to measure gender equality have been made, often by means of composite indices. However, the current indices are limited to the period after 1995, which means a long-term perspective is lacking. This is problematic because economic development and changes in attitudes to women are long-term processes, and because current indices provide only a limited sense of what progress has been made toward gender equality.
To address this problem, we created a composite index measuring gender equality from 1950 to 2003, consisting of women's to men's ratios of life expectancy, sex ratios at ages 0–5, marriage ages, parliamentary seats, average years of schooling, and labor force participation. The index covers the four gender equality dimensions of health, autonomy within the household, political power, and socioeconomic resources.
Our aggregation procedure keeps the index comparable over time and as transparent as possible, while also accommodating the structure of the data. The resulting index reveals that most regions and countries of the world made progress toward gender equality over the past fifty years. However, while there has been much progress, there is little convergence between countries. At all times, however, it should be remembered that behind a composite index can lie great variation in the underlying indicators. This means that future research should also pay attention to the dimensions in which gender inequality occurs.
SUPPLEMENTAL DATA
Supplemental data for this article can be accessed at https://doi.org/10.1080/13545701.2018.1442582.
Supplementary Appendix
Download PDF (4.5 MB)ACKNOWLEDGMENTS
The authors thank Jan Luiten van Zanden, Jan Kok, Lotte van der Vleuten, Lex Heerma van Voss, Ingrid Robeyns; participants at the OECD-Clio Infra How was life? Workshop and the CESifo Venice summer Institute workshop, “The Determinants of Gender Gaps: Institutional Design and Historical Factors”; and the members of the IEHA executive council. Lastly, we thank the anonymous reviewers for their useful feedback and the editors of Feminist Economics for their assistance in bringing this to print.
Additional information
Notes on contributors
Selin Dilli
Selin Dilli is a postdoctoral researcher in the Department of Economic and Social History at Utrecht University. She works as part of the project “Agency, Gender, and Economic Development in the World System, 1850–2000,” funded by The Netherlands Organization for Scientific Research (NWO). Her main research interests include political institutions, political participation, and gender equality. She has previously published in International Political Science Review, CESifo Economic Studies, and the OECD publication How Was Life?
Sarah G. Carmichael
Sarah G. Carmichael is Assistant Professor in the Department of Economic and Social History at Utrecht University. She works as part of the project “Agency, Gender, and Economic Development in the World System, 1850–2000,” funded by The Netherlands Organization for Scientific Research (NWO). Her main research interest includes family, marriage patterns, and gender equality. She has previously published in The History of The Family, CESifo Economic Studies, and the OECD publication How Was Life?
Auke Rijpma
Auke Rijpma is Assistant Professor in the Department of Economic and Social History at Utrecht University. He works as part of the project “Agency, Gender, and Economic Development in the World System, 1850–2000,” funded by The Netherlands Organization for Scientific Research (NWO). His main research interests include agency, well-being, and long-term development. He has published previously in The Economic History Review, CESifo Economic Studies, and the OECD publication How Was Life?
Notes
1 The range is due to the use of different methods of calculation.
2 Gender inequality can also denote that men are disadvantaged relative to women (as recently observed in the case of higher educational attainment in some countries). However, as this is historically rarely the direction in which inequality runs, we investigate the gaps disadvantageous to women.
3 See Carmichael, Dilli, and Rijpma (Citation2014) for a review of the literature on this link.
4 The 1995 HDR presents values for the GDI in 1970 and other indices could be back-calculated with ease; however this has not, to the best of our knowledge, been done consistently with as broad an index as ours.
5 According to the Global Gender Gap index (2012), Iceland, Norway, Sweden, and Finland are the top four countries, whereas Yemen has the highest gender disparity. These countries show similar performances on the GII and SIGI.
6 See however Stephan Klasen (Citation2004), who argues that it is not immediately clear that gender inequalities in labor force participation should necessarily be seen as relevant for a well-being assessment as they might from consensual division of labor within the household.
7 The list is not exhaustive. Gender equality can occur in other dimensions, for instance social capital. We can only capture dimensions that can be measured at the macro level.
8 We carried out a principal component analysis (PCA) to evaluate whether our indicators tap into one single component, in our case, gender equality. The eigenvalue for the first component was 2.15, well above 1 and thus justifying the construction of a single measure. The internal consistency is moderate (Cronbach's alpha: 0.64).
9 A complete overview of all the variables in the GGG can be found in the World Economic Forum's (Citation2013) report.
10 See Stephan Klasen and Claudia Wink (Citation2003) for a discussion on “missing girls.”
11 An argument against this correction is that societal factors that cause reduced male life expectancy encourage men to adopt riskier lifestyles and represent a gender bias against men (Waldron Citation1967). However, the life expectancy difference is found across mammals, and there is evidence that it originates in slower aging by the female of the species and, at least in humans, in greater resistance to disease and lower mortality rates at all ages for women (Kalben Citation2000; Clutton-Brock and Isvaran Citation2007). However, Klasen argues that “[a]s no society, past or present, treated the two sexes equally and the two sexes did not differ in survival-related behaviours, it is hard to separate biology from behaviour. Thus, it is hard to say whether females ‘should’ enjoy a longevity advantage” (2004: 7).
12 To take an example, average years of schooling has a standard deviation of 0.26. This means 0.01 was divided by 0.26, resulting in 0.04. Then the same procedure was carried out for labor force participation, meaning 0.01 was divided by the standard deviation of 0.24, resulting in 0.04 again. This means that average years of schooling received a weight of 0.12, which has a slightly higher standard deviation than that of labor force participation.
13 Supplemental Online Appendix Figure A2 shows that using the geometric mean, countries start with lower values and make more progress. The difference between the two estimates is largely driven by the changes in parliamentary activity.
14 However, see Carmichael, Dilli, and Rijpma (Citation2014) for women's inheritance rights in the years 1920, 1950, and 2000 based on George P. Murdock (1967); Mary Hallward-Driemeier, Tazeen Hasan, and Anca Bogdana Rusu (Citation2013); and Auke Rijpma and Sarah G. Carmichael (Citation2016).
15 Carmichael, Dilli, and Rijpma (Citation2014) provide a detailed description of the historical evolution of gender equality.
16 To check whether our findings are driven by the choice of imputation method, the estimation was repeated based on data imputed using log-linear interpolation and extrapolation based on similar regional countries (see Table A3 in the Supplemental Online Appendix). Overall, the results are similar, except that the effect of the institutional and cultural variables is larger.
17 We have also tested for the existence of a U-shaped relation between gender equality and income that could also obstruct convergence, but found no evidence for it in the HGEI (Goldin Citation1995). It can be found for labor force participation, for which Goldin originally observed the U-shaped relation. For a critical account of the U-shaped link based on a historical perspective, see Jane Humphries and Carmen Sarasúa (Citation2012).
18 To minimize the chance of finding a breakpoint, the annual series was linearly interpolated rather than using the full multiple imputation procedure.
References
- Agarwal, Bina. 1997. “‘Bargaining’ and Gender Relations: Within and Beyond the Household.” Feminist Economics 3(1): 1–51. doi: 10.1080/135457097338799
- Alesina, Alberto, Paola Giuliano, and Nathan Nunn. 2013. “On the Origins of Gender Roles: Women and the Plough.” Quarterly Journal of Economics 128(2): 469–530. doi: 10.1093/qje/qjt005
- Allison, Paul D. 2002. Missing Data. Thousand Oaks, CA: SAGE.
- Anderson, Siwan and Debraj Ray. 2010. “Missing Women: Age and Disease.” Review of Economic Studies 77(4): 1262–1300. doi: 10.1111/j.1467-937X.2010.00609.x
- Austad, Steven N. 2006. “Why Women Live Longer than Men: Sex Differences in Longevity.” Gender Medicine 3(2): 79–92. doi: 10.1016/S1550-8579(06)80198-1
- Barro, Robert J. 2012. “Convergence and Modernization Revisited.” NBER Working Paper 18295, National Bureau of Economic Research.
- Barro, Robert J. and Jong Wha Lee. 2013. “A New Data Set of Educational Attainment in the World, 1950–2010.” Journal of Development Economics 104: 184–98. doi: 10.1016/j.jdeveco.2012.10.001
- Bericat, Eduardo. 2012. “The European Gender Equality Index: Conceptual and Analytical Issues.” Social Indicators Research 108(1): 1–28. doi: 10.1007/s11205-011-9872-z
- Boserup, Ester. 1970. Woman’s Role in Economic Development. New York: St. Martin’s Press.
- Bossen, Laurel, Wang Xurui, Melissa J. Brown, and Hill Gates. 2011. “Feet and Fabrication: Footbinding and Early Twentieth-Century Rural Women’s Labor in Shaanxi.” Modern China 37(4): 347–83. doi: 10.1177/0097700411403265
- Bove, Riley and Claudia Valeggia. 2009. “Polygyny and Women’s Health in Sub-Saharan Africa.” Social Science and Medicine 68(1): 21–9. doi: 10.1016/j.socscimed.2008.09.045
- Branisa, Boris, Stephan Klasen, and Maria Ziegler. 2013. “Gender Inequality in Social Institutions and Gendered Development Outcomes.” World Development 45: 252–68. doi: 10.1016/j.worlddev.2012.12.003
- Caldwell, John C., P. H. Reddy, and Pat Caldwell. 1983. “The Causes of Marriage Change in South India.” Population Studies 37(3): 343–61. doi: 10.1080/00324728.1983.10408866
- Carmichael, Sarah. 2011. “Marriage and Power: Age at First Marriage and Spousal Age Gap in Lesser Developed Countries.” History of the Family 16(4): 416–36. doi: 10.1016/j.hisfam.2011.08.002
- Carmichael, Sarah, Selin Dilli, and Auke Rijpma. 2014. “Gender Inequality since 1820.” In How Was Life? Global Well-Being since 1820, edited by Jan Luiten van Zanden, Joerg Baten, Marco Mira d’Ercole, Auke Rijpma, Conal Smith, and Marcel Timmer. Paris: OECD Publishing.
- Clots-Figueras, Irma. 2012. “Are Female Leaders Good for Education? Evidence from India.” American Economic Journal: Applied Economics 4(1): 212–44.
- Clutton-Brock, Timothy Hugh and Kavita Isvaran. 2007. “Sex Differences in Ageing in Natural Populations of Vertebrates.” Proceedings of the Royal Society B: Biological Sciences 274(1629): 3097–104. doi: 10.1098/rspb.2007.1138
- Croissant, Yves and Giovanni Millo. 2008. “Panel Data Econometrics in R: The plm Package.” Journal of Statistical Software 27(2): 1–43. doi: 10.18637/jss.v027.i02
- Currie, Janet and Enrico Moretti. 2003. “Mother’s Education and the Intergenerational Transmission of Human Capital: Evidence from College Openings.” Quarterly Journal of Economics 118(4): 1495–1532. doi: 10.1162/003355303322552856
- De Moor, Tine, and Jan Luiten van Zanden. 2010. “Girl Power: The European Marriage Pattern and Labour Markets in the North Sea Region in the Late Medieval and Early Modern Period.” Economic History Review 63(1): 1–33. doi: 10.1111/j.1468-0289.2009.00483.x
- Dijkstra, A. Geske. 2006. “Towards a Fresh Start in Measuring Gender Equality: A Contribution to the Debate.” Journal of Human Development 7(2): 275–83. doi: 10.1080/14649880600768660
- Dilli, Selin, Auke Rijpma, and Sarah G. Carmichael. 2015. “Achieving Gender Equality: Development versus Historical Legacies.” CESifo Economic Studies 61(1): 301–34. doi: 10.1093/cesifo/ifu027
- Doepke, Matthias, Michèle Tertilt, and Alessandra Voena. 2012. “The Economics and Politics of Women’s Rights.” Annual Review of Economics 4: 339–72. doi: 10.1146/annurev-economics-061109-080201
- Dollar, David, Raymond Fisman, and Roberta Gatti. 2001. “Are Women Really the ‘Fairer’ Sex? Corruption and Women in Government.” Journal of Economic Behavior and Organization 46(4): 423–9. doi: 10.1016/S0167-2681(01)00169-X
- Dorius, Shawn F. and Glenn Firebaugh. 2010. “Trends in Global Gender Inequality.” Social Forces 88(5): 1941–68. doi: 10.1353/sof.2010.0040
- Eastin, Joshua C. and Aseem Prakash. 2013. “Economic Development and Gender Equality: Is There a Gender Kuznets Curve?” World Politics 65(1): 156–86. doi: 10.1017/S0043887112000275
- Eskes, Tom and Clemens Haanen. 2007. “Why Do Women Live Longer than Men?” European Journal of Obstetrics & Gynecology and Reproductive Biology 133(2): 126–33. doi: 10.1016/j.ejogrb.2007.01.006
- Finkel, Steven E. 1995. “Causal Analysis with Panel Data.” Number 07-105, Sage University Paper Series, Quantitative Applications in Social Sciences. Thousand Oaks, CA: SAGE.
- Goldin, Claudia. 1995. “The U-Shaped Female Labor Force Function in Economic Development and Economic History.” In Investment in Women’s Human Capital, edited by T. Paul Schultz, 61–90. Chicago: University of Chicago Press.
- Goldin, Claudia.. 2006. “The Quiet Revolution that Transformed Women’s Employment, Education, and Family.” American Economic Review 96(2): 1–21. doi: 10.1257/000282806777212350
- Goldin, Claudia.. 2014. “A Grand Gender Convergence: Its Last Chapter.” American Economic Review 104(4): 1091–119. doi: 10.1257/aer.104.4.1091
- Goode, William J. 1963. World Revolution and Family Patterns. New York: Free Press.
- Hajnal, John 1965. “European Marriage Patterns in Perspective.” In Population in History: Essays in Historical Demography, edited by D. V. Glass and D. E. C. Eversley, 101–43. London: Edward Arnold.
- Hallward-Driemeier, Mary, Tazeen Hasan, and Anca Bogdana Rusu. 2013. “Women’s Legal Rights over 50 Years: Progress, Stagnation or Regression?” Policy Research Working Paper WPS6616, World Bank, Washington, DC.
- Hausmann, Ricardo, Laura D. Tyson, and Saadia Zahidi. 2012. “The Global Gender Gap Report.” World Economic Forum. http://www3.weforum.org/docs/WEF_GenderGap_Report_2012.pdf.
- Honaker, James, Gary King, and Matthew Blackwell. 2011. “Amelia II: A Program for Missing Data.” Journal of Statistical Software 45(7): 1–47. doi: 10.18637/jss.v045.i07
- Horrell, Sara and Jane Humphries. 1995. “Women’s Labour Force Participation and the Transition to the Male-Breadwinner Family, 1790–1865.” Economic History Review 48(1): 89–117. doi: 10.2307/2597872
- Htun, Mala, and Laurel Weldon. 2011. “Sex Equality in Family Law: Historical Legacies, Feminist Activism, and Religious Power in 70 Countries.” World Bank Development Report 2012 Background Paper. https://openknowledge.worldbank.org/handle/10986/9204.
- Humphries, Jane. 1993. “Gender Inequality and Economic Development.” In Economics in a Changing World, Vol. 3, edited by Dieter Bös, 218–33. New York: St. Martin’s Press.
- Humphries, Jane and Carmen Sarasúa. 2012. “Off the Record: Reconstructing Women’s Labor Force Participation in the European Past.” Feminist Economics 18(4): 39–67. doi: 10.1080/13545701.2012.746465
- International Center for Research on Women. 2014. “Child Marriage: Facts and Figures.” https://www.icrw.org/child-marriage-facts-and-figures/.
- International Labour Organization. 2010. “Employment by Age and Sex.” http://www.ilo.org/ilostat.
- Inter-Parliamentary Union. 2015. “Women in Politics: 2015.” https://www.ipu.org/resources/publications/infographics/2016-07/women-in-politics-2015.
- Jütting, Johannes P., Christian Morrisson, Jeff Dayton-Johnson, and Denis Drechsler. 2008. “Measuring Gender (In)Equality: The OECD Gender, Institutions and Development Data Base.” Journal of Human Development 9(1): 65–86. doi: 10.1080/14649880701811401
- Kabeer, Naila. 1999. “Resources, Agency, Achievements: Reflections on the Measurement of Women’s Empowerment.” Development and Change 30(3): 435–64. doi: 10.1111/1467-7660.00125
- Kalben, Barbara Blatt. 2000. “Why Men Die Younger: Causes of Mortality Differences by Sex.” North American Actuarial Journal 4(4): 83–111. doi: 10.1080/10920277.2000.10595939
- King, Gary, James Honaker, Anne Joseph, and Kenneth Scheve. 2001. “Analyzing Incomplete Political Science Data: An Alternative Algorithm for Multiple Imputation.” American Political Science Review 95(1): 49–69.
- Kishor, Sunita and Kiersten Johnson. 2004. Profiling Domestic Violence: A Multi-Country Study. Calverton, MD: Macro International Inc.
- Klasen, Stephan. 2004. “Gender-Related Indicators of Well-Being.” WIDER Discussion Paper 04-05, WIDER, Helsinki.
- Klasen, Stephan.. 2006. “UNDP’s Gender-Related Measures: Some Conceptual Problems and Possible Solutions.” Journal of Human Development 7(2): 243–74. doi: 10.1080/14649880600768595
- Klasen, Stephan, and Francesca Lamanna. 2009. “The Impact of Gender Inequality in Education and Employment on Economic Growth: New Evidence for a Panel of Countries.” Feminist Economics 15(3): 91–132. doi: 10.1080/13545700902893106
- Klasen, Stephan and Dana Schüler. 2011.“Reforming the Gender-Related Development Index and the Gender Empowerment Measure: Implementing Some Specific Proposals.” Feminist Economics 17(1): 1–30. doi: 10.1080/13545701.2010.541860
- Klasen, Stephan and Claudia Wink. 2002. “A Turning Point in Gender Bias in Mortality? An Update on the Number of Missing Women.” Population and Development Review 28(2): 285–312. doi: 10.1111/j.1728-4457.2002.00285.x
- Klasen, Stephan and Claudia Wink. 2003. “‘Missing Women’: Revisiting the Debate.” Feminist Economics 9(2–3): 263–99. doi: 10.1080/1354570022000077999
- Malhotra, Anju. 2003. “Conceptualizing and Measuring Women’s Empowerment.” Paper presented at the Workshop on “Measuring Empowerment: Cross-Disciplinary Perspectives” at the World Bank, Washington, DC, February 4–5.
- McKee, Martin and Vladimir Shkolnikov. 2001. “Understanding the Toll of Premature Death among Men in Eastern Europe.” British Medical Journal 323(7320): 1051–5. doi: 10.1136/bmj.323.7320.1051
- Mitchell, Brian. 2007. International Historical Statistics: 1750–2005. London: Palgrave Macmillan.
- Murdock, George P. 1967. Ethnographic Atlas. Pittsburgh, PA: University of Pittsburgh Press.
- Organisation for Economic Co-operation and Development (OECD) 2011. How’s Life? Paris: OECD Publishing.
- Organisation for Economic Co-operation and Development (OECD). 2015. “Gender Equality and Women’s Rights in the Post-2015 Agenda: A Foundation for Sustainable Development.” http://www.oecd.org/dac/POST-2015%20Gender.pdf.
- Paxton, Pamela, Jennifer Green, and Melanie M. Hughes. 2008. “Women in Parliament, 1945–2003: Cross-National Dataset.” Inter-university Consortium for Political and Social Research, Ann Arbor, MI.
- Permanyer, Iñaki. 2010. “The Measurement of Multidimensional Gender Inequality: Continuing the Debate.” Social Indicators Research 95(2): 181–98. doi: 10.1007/s11205-009-9463-4
- Preston, Samuel H. 1975. “The Changing Relation between Mortality and Level of Economic Development.” Population Studies 29(2): 231–48. doi: 10.1080/00324728.1975.10410201
- Ravallion, Martin. 2012. “Troubling Tradeoffs in the Human Development Index.” Journal of Development Economics 99(2): 201–9. doi: 10.1016/j.jdeveco.2012.01.003
- Rehm, Jürgen, Urszula Sulkowska, Marta Mańczuk, Paolo Boffetta, John Powles, Svetlana Popova, and Witold Zatoński. 2007. “Alcohol Accounts for a High Proportion of Premature Mortality in Central and Eastern Europe.” International Journal of Epidemiology 36(2): 458–67. doi: 10.1093/ije/dyl294
- Rijpma, Auke and Sarah G. Carmichael. 2016. “Testing Todd and Matching Murdock: Global Data on Historical Family Characteristics.” Economic History of Developing Regions 31: 10–46. doi: 10.1080/20780389.2015.1114415
- Robeyns, Ingrid. 2003. “Sen’s Capability Approach and Gender Inequality: Selecting Relevant Capabilities.” Feminist Economics 9(2–3): 61–92. doi: 10.1080/1354570022000078024
- Sen, Amartya. 1990. “Gender and Cooperative Conflicts.” In Persistent Inequalities: Women and World Development, edited by Irene Tinker, 123–49. New York: Oxford University Press.
- Sen, Amartya.. 1992. “Missing Women.” British Medical Journal 304: 587–8. doi: 10.1136/bmj.304.6827.587
- Sen, Amartya.. 1999. Development as Freedom. Oxford: Oxford University Press.
- Sen, Amartya.. 2001. “The Many Faces of Gender Inequality.” The New Republic. http://prof.chicanas.com/readings/SenInequality.pdf.
- Spierings, Niels, Jeroen Smiths, and Mieke Verloo. 2009. “On the Compatibility of Islam and Gender Equality: Effects of Modernization, State Islamization, and Democracy on Women’s Labor Market Participation in 45 Muslim Countries.” Social Indicators Research 90(3): 503–22. doi: 10.1007/s11205-008-9274-z
- Strauss, John and Duncan Thomas. 1995. “Human Resources: Empirical Modeling of Household and Family Decisions.” In Handbook of Development Economics 3, Part A, edited by Jere Behrman and T.N. Srinivasan, 1883–2023. Amsterdam: Elsevier.
- United Nations. 2008. “World Marriage Data 2008.” United Nations Population Division. http://www.un.org/esa/population/publications/WMD2008/Metadata/SMAM.html.
- United Nations. 2013a. “The Gender Dimension of the Millennium Development Goals Report 2013.” UN Women. http://www.unwomen.org/en/news/stories/2013/7/the-gender-dimension-of-the-millennium-development-goals-report-2013.
- United Nations. 2013b. “World Population Prospects: The 2012 Revision, Key Findings and Advance Tables.” United Nations Population Division. https://esa.un.org/unpd/wpp/publications/Files/WPP2012_HIGHLIGHTS.pdf.
- United Nations Development Programme (UNDP). 1995. Human Development Report 1995. New York: UNDP. http://hdr.undp.org/en/content/human-development-report-1995http://hdr.undp.org/en/content/human-development-report-1995.
- United Nations Development Programme (UNDP). 2014. Humanity Divided: Confronting Inequality in Developing Countries. New York: UNDP.
- van Buuren, Stef. 2010. “Multiple Imputation of Multilevel Data.” In Handbook of Advanced Multilevel Analysis, edited by Joop J. Hox and Kyle Roberts, 173–96. Milton Park, UK: Routledge.
- van der Lippe, Tanja, Judith de Ruijter, Esther de Ruijter, and Werner Raub. 2011. “Persistent Inequalities in Time Use between Higher Educated Men and Women: A Detailed Look at the Influence of Economic Circumstances, Policies, and Culture.” European Sociological Review 27: 164–79. doi: 10.1093/esr/jcp066
- Verba, Sidney, Nancy Burns, and Kay L. Schlozman. 1997. “Knowing and Caring about Politics: Gender and Political Engagement.” Journal of Politics 59(4): 1051–72. doi: 10.2307/2998592
- Waldron, Ingrid. 1967. “Why Do Women Live Longer than Men?” Social Science and Medicine 10(7–8): 349–62. doi: 10.1016/0037-7856(76)90090-1
- Wollstonecraft, Mary. 1792/2004. A Vindication of the Rights of Woman: With Strictures on Political and Moral Subjects. London: Penguin.
- World Bank. 2011. Gender Equality and Development World Development Report 2012. Washington, DC: World Bank.
- World Bank. 2014. Voice and Agency: Empowering Women and Girls for Shared Prosperity. Washington, DC: World Bank.
- World Bank. 2015. “World Bank Income Classifications 2015.” https://blogs.worldbank.org/opendata/new-country-classifications.
- World Economic Forum. 2013. The Global Gender Gap Report 2013. http://www3.weforum.org/docs/WEF_GenderGap_Report_2013.pdf.
- Zeileis, Achim, Friedrich Leisch, Kurt Hornik, and Christian Kleiber. 2002. “Strucchange: An R Package for Testing for Structural Change in Linear Regression Models.” Journal of Statistical Software 7(2): 1–38. doi: 10.18637/jss.v007.i02