
 ?Mathematical formulae have been encoded as MathML and are displayed in this HTML version using MathJax in order to improve their display. Uncheck the box to turn MathJax off. This feature requires Javascript. Click on a formula to zoom.
ABSTRACT
This paper discusses the challenges associated with implementing time-use surveys among agricultural households in developing countries and offers advice on best practices for two common measurement methods: stylized questions and time diaries. Using data from Women’s Empowerment in Agriculture Index (WEAI) surveys in Bangladesh and Uganda, it finds that stylized questions do not always produce shorter interviews compared to time diaries, and recall accuracy may depend on the regularity and saliency of the activity and enumerator abilities. The paper suggests that combining promising methodological innovations from other disciplines with mainstream time-use data collection methods would allow capture of both the quantity and quality of time and provide richer insights into gendered time-use patterns. Broadening the scope of time-use research to other aspects of well-being can help identify how time constraints contribute to gender inequality and inform the design of policies and interventions to relieve those constraints.
HIGHLIGHTS
Time-use surveys are essential for addressing gender disparities, yet little research has compared time-use survey methods in developing countries.
Developing country agricultural contexts present unique logistical challenges to time-data collection, including low literacy and unfamiliarity with clock-oriented time.
In Bangladesh and Uganda, there are systematic differences between time-use estimates obtained using stylized questions and time diaries.
Men and women experience different emotions toward different types of work, and gender gaps exist in the distribution of pleasant and unpleasant activities.
Learning from non-economics disciplines, including research on quality of time, leads to richer insights into gendered time-use patterns.
KEYWORDS:
INTRODUCTION
Global patterns in time use demonstrate the existence, particularly in developing countries, of substantial gender disparities in time spent on unpaid domestic and care work. On average, women spend at least three times as many hours as men on unpaid work, and as a result, have a higher total work burden than men, when both unpaid and paid work are considered (United Nations Citation2015). These disparities impose several constraints on women’s well-being and livelihoods, reducing access to paid employment and time for education, leisure, and social activities. Yet, gender disparities in unpaid work often go undiagnosed by traditional household surveys. Time-use surveys, on the other hand, are well-suited for measuring unpaid work and are, thus, essential for designing effective policies and interventions to relieve these constraints.
While time-use surveys have a rich history in developed countries, they have become more common in developing countries only in the last few decades. Amidst logistical and institutional constraints, the developing country agriculture setting presents challenges that complicate data collection, for example, low literacy and a lack of familiarity with clock-oriented time. The trade-offs involved in overcoming these challenges underlie great variation in methodological approaches (for example, sampling design, questionnaire design, and mode of data collection) across regions and countries (Esquivel et al. Citation2008). This inconsistency complicates comparison of time-use patterns across countries and over time and makes it more difficult to monitor global progress on reducing gender disparities in unpaid work. Understanding the costs and benefits associated with different methodological approaches is the first step toward a standard methodology for time-use measurement. Yet, with the exception of a few studies focused on developed countries (Juster, Ono, and Stafford Citation2003; Kan and Pudney Citation2008; Frazis and Stewart Citation2012), little research exists comparing time-use survey methods. To our knowledge, the only similar study using data from developing countries is by Thomas Daum et al. (Citation2019).
This paper attempts to fill this evidence gap, focusing on two common methods: stylized questions and time diaries. First, we develop guidance on best practices for conducting time-use surveys with these methods in developing countries, building on literature on the cognitive aspects of survey methods and our own experiences collecting time-use data as part of the Women’s Empowerment in Agriculture Index (WEAI) surveys (Alkire et al. Citation2013), which we co-developed. Because the choice of method depends on the research question, our recommendations focus on survey design and on the importance of having well-trained staff to implement the time-use interviews.
Second, we analyze differences between time-use estimates obtained from 7-day recall stylized questions and 24-hour recall time diaries using data from WEAI surveys in Bangladesh and Uganda in which respondents answered both types of questions. We focus on two comparisons: do stylized questions produce shorter interview times than time diaries, and do systematic differences exist between the estimates produced by the methods? We find that stylized questions do not always produce shorter interviews compared to time diaries. We attribute this to the greater cognitive burden placed on respondents by the stylized questions, which required respondents to mentally aggregate activities over the reference period. In contrast, the sequential nature of the time diary, coupled with a shorter recall period, may have improved respondents’ memory information processing and led to timelier completion of the interview. In addition, we find systematic differences in time-use estimates linked to the type of activity, respondent characteristics, and enumerator fixed effects for men and women in both countries. The latter-most underscores the importance of having well-trained staff to implement the time-use interviews.
Third, we explore how time-use data can be collected and analyzed to understand quality of time use. We analyze primary data from Bangladesh combining data from a 24-hour recall time diary with men’s and women’s emotions during each episode of activity. Our findings suggest that men and women differ in the tasks they perceive as pleasant or unpleasant, and that women spend a greater proportion of their time on unpleasant tasks than do men, indicating a quality differential in time use.
Finally, we discuss how disciplines outside of economics, such as psychology and health/nutrition, and new emergent technologies (for example, activity trackers) can help broaden the scope of time-use research and lead to richer insights into gendered time-use patterns.
OVERVIEW OF COMMON TIME-USE SURVEY METHODS
Survey methods used to collect time-use data fall into two general categories: methods focused on specific activities (stylized questions) and methods aimed at capturing all activities (time diaries) undertaken within a specific period. Research questions answerable by time-use studies fall into two broad, potentially overlapping categories: how much time people spend on particular activities and how people experience time spent on these activities.Footnote1 Which method is best suited to measure time-use data in developing country agriculture? While the answer ultimately depends on the research question, recall accuracy and implementation feasibility also matter.
Stylized questions
Stylized questions (SQ) ask respondents to estimate the amount of time they devoted to a particular activity during a specific time interval (for example, the previous day, week, or month). SQ require that respondents are familiar with clock-oriented time but do not require them to be literate or numerate. SQ are commonly used in time-use surveys aimed at specific sets of activities (for example, labor force surveys, impact evaluations), where a full accounting of the respondent’s activities over the reference period would be needlessly cumbersome. A recent impact evaluation in northwest Bangladesh provides an example (see Box 1).
Box 1 Stylized questions used in the Strengthening the Dairy Value Chain Project (SDVCP)
The CARE-Bangladesh Strengthening the Dairy Value Chain Project aimed to improve the participation of smallholder farmers in the dairy value chain and targeted several components of the project specifically to women, who are traditionally responsible for the care and feeding of livestock (Quisumbing et al. Citation2013). Women were encouraged to bring milk to collection points instead of selling them to itinerant buyers, which was expected to increase women’s time on dairy-related activities. To assess the implications of increased time involved in dairying on domestic work and for sharing of time burdens among household members, the authors asked respondents the following questions about eighteen livestock-related activities and five household activities (see Figure ):
Who is primarily responsible for doing it?
Who does it in the absence of the responsible person?
In the past 30 days, who usually does it?
In an average week in the past 30 days, how many hours total has this person spent on the activity?
Figure 1 Stylized questions in SDVCP Endline Survey Questionnaire
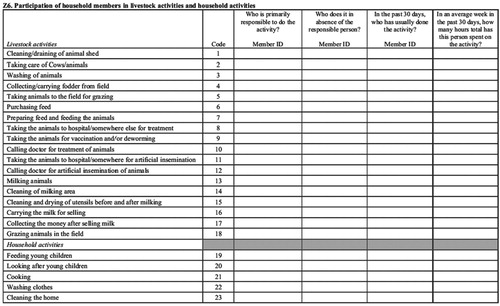
The list of activities included in the survey focused on the specific areas of interest in which the project hypothesized that tradeoffs exist: livestock and household activities. Total time spent in these activities was aggregated for men, women, boys, and girls. The authors found that the increased allocation of women’s time to dairy activities came at the expense of time in household activities, with young girls (but not boys) consequently increasing their time in domestic work.
Box 2 Time diary in the Women’s Empowerment in Agriculture Index (WEAI) survey
The WEAI survey collects time-use data for the following eighteen activities:
Personal activities: sleeping and resting, eating and drinking, personal care, school (including homework)
Market work: work as employed, own business work, farming/livestock/fishing
Nonmarket work: shopping/getting service, weaving/sewing/textile care, cooking, other domestic work, care for children/adults/elderly
Leisure: watching TV/listening to radio/reading, exercising, social activities and hobbies, religious activities, traveling/commuting
While most activities should fall within these categories, an open-ended “Other (specify)” option is also included in the module. The survey allows for the reporting of multiple (simultaneous) activities for the same time period.
Originally designed as a paper survey, the WEAI TD uses a format based on the stylized activity log proposed by Andrew S. Harvey and Maria Elena Taylor (Citation2000). Rows, representing each type of activity, and columns, representing the previous 24 hours divided into 15 minute intervals, form an 18×96 grid (see Figure ). Activities are recorded by drawing horizontal lines across the grid. In this way, the format itself acts to promote accuracy. By simply checking that a continuous (though staggered) line extends across the grid, enumerators can verify that the previous 24 hours have been counted fully and that no additional time has been recorded in the module. Indeed, errors of this sort in data collected using the WEAI TD are believed to be rare, although this needs to be tested with a proper comparison group. Nonetheless, some implementers have reported that the grid format is too complicated and requires extra training for enumerators.
Figure 2 Time diary in WEAI 2.0 individual questionnaire
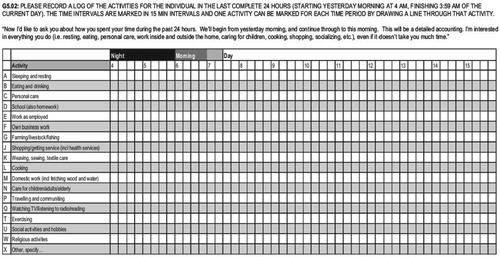
The WEAI TD has recently been adapted for use with computer-assisted personal interviewing (CAPI) software on a tablet or smartphone, replacing the grid format with nested “drop-down” menus that allow for greater specificity of listed activities, while also providing built-in accuracy checks.
SQs are generally considered to be the most feasible method for collecting time-use data, given that they typically require fewer questions and less effort (for example, shorter interviews) to implement than other methods, such as time diaries (Harvey and Taylor Citation2000). This is clearly true in most developed country settings, where SQs are routinely used in labor force surveys and where work hours are more regular and easier to recall.Footnote2 It is less likely in developing country agriculture, given that the cognitive burden imposed by SQs may be difficult for less-educated enumerators and respondents to cope with (see discussion below). Collecting time-use data is also inherently more difficult in the agricultural sector because activities are less predictable, owing to seasonality and short-term weather fluctuations, compared to industry and services. Depending on the degree of formality, collecting time-use data could be easier for respondents in industry and services, although workers on short-term contracts, own-account workers, and entrepreneurs could also have unpredictable work schedules.
Time diaries
Time diaries (TDs) collect information about all activities during a specific reference period, typically the previous 24 hours. TDs can be self-reported but are typically completed with enumerator assistance.
Self-reported TDs require respondents to record for themselves all activities over the course of the reference period, typically in 15 or 30 minutes increments. Self-reporting is usually carried out contemporaneously, with the respondent carrying a paper log or, more recently, an electronic device (for example, tablet, smartphone) with them and recording activities as they occur. Given the lack of supervision, collecting quality data from self-reported TDs requires that respondents are compliant, as well as literate, numerate, and (in some cases) technologically savvy. As a result, self-reported TDs are rare in developing countries, though a few exceptions exist (Floro and Pichetpongsa Citation2010; Masuda et al. Citation2014; Chatzitheochari et al. Citation2018; Daum et al. Citation2019).
Survey-based TDs are based on respondents’ recollection of their activities during the reference period and completed with the help of an enumerator during a survey interview. Similar to SQs, they require that respondents be familiar with clock-oriented time and do not require respondents to be literate or numerate. The structure of the interview can vary depending on the expertise of the survey team. Most commonly, respondents are asked to describe the sequence and duration of their activities over the reference period in chronological order, beginning with the time they woke up and ending when they went to sleep, as illustrated in Box 2.
Survey-based TDs have been implemented in at least fifty-seven developing countries around the world (Fisher Citation2015). TDs are widely perceived to provide a superior blend of accuracy and feasibility compared to other methods, and, hence, are often considered to be the “gold standard” for use in developing countries. However, although anecdotal evidence abounds on the merits of survey-based TDs compared to other methods, empirical evidence supporting this claim is very limited. Whether TDs are more cost effective to implement than other methods has also, to our knowledge, never been formally analyzed. This may be partially due to lack of data; the financial data required to evaluate differences in survey costs may not be shared by development organizations nor tracked in a way that supports rigorous comparisons. Equally rare are follow-up studies (for example, qualitative interviews, cognitive testing) and enumerator debriefings aimed at evaluating respondents’ experience with different methods.
Interview length is the one area where existing data allows an empirically rigorous comparison of methods. Questions about how to shorten interviews often arise during budget discussions. Unsurprisingly, time stamps, which indicate the start- and end-times for particular survey modules, have become more common in household surveys, particularly during piloting when the impetus for experimentation and the opportunity for refinement is high. Indeed, the data analyzed in this paper come from methodological experimentation undertaken during piloting to streamline the WEAI. Comparative studies on the accuracy of time-use methods, particularly SQs versus TDs, generally find that TDs are more accurate (Juster, Ono, and Stafford Citation2003; Kan and Pudney Citation2008; Frazis and Stewart Citation2012).
It is important to note, however, that TDs embedded in multi-purpose household surveys, such as the WEAI, may not be directly comparable to stand-alone national time-use surveys, nor able to answer the same research questions.Footnote3 In particular, surveys like the WEAI, which only collects information from one or two respondents per household – and thus exclude other household members – are not suitable for calculating the total unpaid work done by the household or its distribution across different members.
COGNITIVE ASPECTS OF TIME-USE SURVEY METHODS
To understand the specific challenges involved in collecting time-use data in developing country agriculture, we draw on insights from psychology on the cognitive aspects of survey methods.Footnote4 Consider, for example, the steps required to answer the following question from the WEAI 2.0 pilot survey: “In the last seven days, how much time did you spend on cooking?” To accurately answer this question, respondents must: (1) properly identify the reference period (“the last 7 days”) and the specific activity in question (“cooking”), (2) search their memory of the past seven days to retrieve all instances of cooking activities, and (3) correctly aggregate these instances into a frequency estimate. Each one of these steps presents unique challenges to respondents and enumerators.
Perhaps the most basic challenge is correctly associating the activity referred to in the survey with the actual activities the respondent engaged in during the reference period. This requires a clear understanding by both respondents and enumerators. Enumerators should be familiar enough with the intentions of the survey designers and examples from the local environment to ensure that respondents correctly identify the activity. The risk of confusion can be minimized by ensuring that the survey is properly translated into respondents’ native language or dialect; avoiding vague or ambiguous phrases, which may be interpreted differently depending on personal experience; and providing enumerators with explicit instructions about how to categorize different activities.
The piloting of the WEAI was instructive. We originally included a category for “farming” in the WEAI TD, intended to capture any crop-related activity irrespective of location. However, the latter point was not effectively communicated to the survey team in Bangladesh, who interpreted “farming” as only referring to agricultural activities performed away from the homestead, such as cultivating field crops. As a result, all activities performed by women on the homestead, even if they were agriculture-related (for example, home gardening) were classified as “domestic work.” Estimates based on this data underestimated the extent of women’s agricultural work and, because other non-farming tasks were also classified as “domestic work,” considerably limited the research questions we could investigate using the data. As a result of this experience, we revised the guidance documents to prevent a recurrence of this mistake and now instruct enumerators to provide respondents with examples of farming activities appropriate to the study setting.
Confusion can also occur in the identification of the reference period. Such risks can be mitigated by avoiding ambiguous or vague terminology. For example, asking about a fixed reference period, such as “the last seven days,” is much more likely to yield consistent interpretation than asking about hypothetical reference periods, such as “the last several days.”
However, even if respondents can correctly identify the intended reference period, problems can still occur in accurately associating memories with the reference period. This is because autobiographical memory tends to be organized in the context of ongoing life experiences, rather than in relation to specific dates (Belli Citation1998). Thus, temporal-based attempts at anchoring (for example, “in the last month” or “during the last 12 months”) may be relatively ineffective. Locally relevant recall cues (for example, public events, religious services) or graphical aids (for example, personal event timelines), which could be included as prompts, may help anchor the reference period in respondents’ personal experiences.
Whereas longer recall periods tend to encourage guessing and estimation based on established patterns of activity, shorter recall periods generally improve respondents’ ability to recall specific activities (Brown Citation2002). Nevertheless, respondents may exhibit “telescoping” behavior, particularly for longer recall periods, in which distant events are reported as having happened more recently and recent events as occurring much longer ago (Sudman and Bradburn Citation1973).
More accurate recall may also be encouraged by structuring the time-use interview to mimic the chronological ordering of autobiographical memory. For example, asking respondents to recall when and for how long they engaged in each of an exhaustive list of activities can be unnecessarily repetitious and challenging for respondents, whereas encouraging respondents to recount the activities of the previous day sequentially, as in a TD, may enhance recall accuracy. Guidance for the WEAI TD illustrates how to structure TD interviews in this way.Footnote5 The interview begins with the enumerator asking the respondent to recall what time he or she woke up and went to sleep the previous day; this establishes the boundaries for the time period that must be “filled in” during the interview and reduces the risk that the amount of time recorded in the diary exceeds or falls below 24 hours or that an activity is accidentally omitted. Next, the enumerator asks the respondent what they did immediately after waking up and for how long. The interview moves from one episode to the next, until a full account of the respondent’s day is captured. The enumerator’s primary task throughout the interview is to “translate” the respondent’s narrative of the previous day into the coding scheme of the TD. Enumerators are encouraged to avoid interrupting the respondent unless absolutely necessary. For instance, if the respondent reports weeding her rice paddy, the enumerator seamlessly codes this as “farming” without interrupting the narrative. The interview ends with a question about whether the amount of work performed during the previous day was typical.
Another cognitive aspect of time-use methods that complicates measurement involves respondents’ ability to accurately aggregate individual instances of the same activity over the reference period. Typically, psychologists believe that a person’s ability to accurately formulate frequency estimates is directly related to how often an activity occurs – regularity – and how distinguishable it is from other activities – saliency (Menon Citation1993; Brown et al. Citation2007). Frequency estimates for activities that occur regularly but are not exceptionally salient (for example, eating breakfast, brushing your teeth) are likely to be extrapolated based on an assessment of the rate of occurrence. Activities that are very short in duration or that involve frequent switching between similar tasks may be less salient than activities that are longer in duration. More salient activities are likely to evoke a “recall-and-count” strategy, in which respondents recall each individual occurrence of the activity. Neither estimation strategy is ideal if activities are commonplace and do not follow a set schedule, such as agricultural labor. This is consistent with the findings from empirical research investigating recall bias in agricultural labor statistics and time-use evidence from developed countries: SQs tend to yield less accurate estimates than time diaries for irregularly occurring activities, and conversely, more accurate estimates for regularly occurring activities (Juster, Ono, and Stafford Citation2003; Arthi et al. Citation2018).Footnote6 Thus, SQs may be better suited for answering research questions about activities that tend to follow a set schedule (for example, salaried employment), where the risk of aggregation errors is considerably less.
Seasonality
The cycle of activity associated with different agricultural livelihoods varies according to seasonality. As a result, the amount of time a person spends farming can change not only from one season to another but also within a season, depending on weather, crop choice, and technology.Footnote7 In contrast to the cognitive issues discussed above, which tend to originate from how questions are asked, seasonality bias stems from when questions are asked. Time-use surveys typically capture a small cross section of how a person spends their time; the shorter the reference period, the more likely it is to miss seasonal variation in time-use patterns.
Seasonality bias is a much greater concern for TDs, which tend to focus on a single 24 -hour period of time, than for SQs, which may cover multiple days. While precautions can be taken, such as follow-up questions to distinguish between patterns of time allocation that are unusual (for example, holidays, festivals, and so on) or posing questions about “usual” or “typical” days, none of these are perfect solutions. To ensure coverage across seasons, time-use data should ideally be collected at several different points of time for each respondent (Frazis and Stewart Citation2012). However, cost considerations make this sampling strategy unlikely to be tenable for most researchers. The most practical advice is to be aware of the seasonal labor patterns associated with the study setting (for example, by conducting qualitative interviews or focus group discussions prior to the survey) and to stage data collection at the most appropriate time for the particular research question.
FEASIBILITY AND ACCURACY OF STYLIZED QUESTIONS AND TIME DIARIES
Feasibility
Feasibility, often interpreted in terms of field costs and linked to survey length, is an important consideration when deciding which method to use for collecting time-use data. Yet, the financial data required to evaluate differences in survey costs are seldom available, or alternatively, costs may not be tracked in a way that enables a rigorous comparison. For example, the costs of administering the time-use module may be bundled up with the costs of implementing other survey modules, and the conditions surrounding a particular survey may differ. Indeed, the only way to track financial information consistent with assessing feasibility would be an experimental design involving multiple surveys, which vary only by the type of time-use method used. We did not follow this strategy in the WEAI survey analyzed below, and thus, we are unable to assess differences in the financial costs associated with SQs and TDs. Instead, we focus on interview length, the one aspect of implementation feasibility for which we have data.
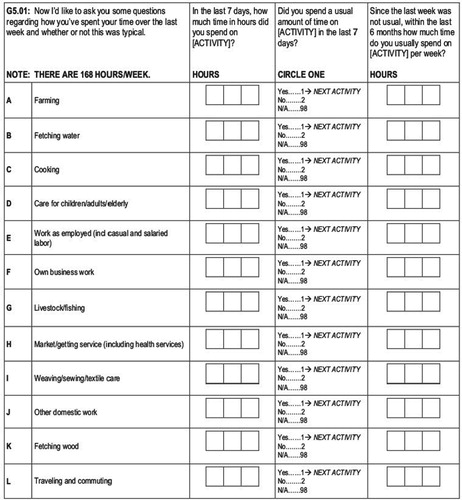
To assess whether SQs or TDs are easier to implement in rural areas of developing countries, we use data from the 2014 pilot testing of the WEAI 2.0 survey in Bangladesh and Uganda. The WEAI TD collects information about the time men and women spent on a wide range of activities during the previous 24 hours. To address concerns raised by implementers about the time required to conduct the WEAI TD interview, we designed a SQ version of the WEAI TD to streamline data collection. The questionnaire asked the following questions with respect to twelve productive and reproductive work activities (see Figure ):
In the last seven days, how much time in hours did you spend on [ACTIVITY]?
Did you spend an usual amount of time on [ACTIVITY] in the last seven days?
Since the last week was not usual, within the last six months how much time did you usually spend on [ACTIVITY] per week?Footnote8
We expected that SQs would be easier for respondents and enumerators to understand and would require less time to implement compared to the TD. Sample villages were randomly assigned either a TD-only or an experimental module that included both SQs and the TD. In the experimental module, the SQs were asked immediately prior to the TD. Basic descriptive statistics for the data are given in Table .
Table 1 Descriptive statistics of WEAI 2.0 pilot survey by country
While the different recall periods (7 day versus 24 hour, respectively) utilized by the SQs and TD should minimize the risk of contamination, the sequencing of the modules should have been randomized. Respondents’ ability to recall their activities over the past 24 hours – and the length of time it took them to complete the TD – may have been impacted (primed) by first answering the SQs about their activities over the last seven days. Even so, it is unclear in which direction the TD interview lengths would be biased: downward (if the SQs stimulated improved recollection of the past 24 hours) or upward (if after answering the SQ respondents had difficulty restricting their focus to the past 24 hours). Nonetheless, this issue should be kept in mind when considering our results.
We first compare the length of time required to complete the survey module for each method (see Table ). Although in Bangladesh the SQs took less time to complete than the TD (by almost 9 minutes), in Uganda we observed no significant difference between the two methods. Thus, contrary to our expectation, the SQs did not always produce shorter interviews than TDs.
Table 2 Average interview length by method and country (in minutes)
According to the survey teams in both countries, respondents often found the SQs to be more challenging than the TDs. Many enumerators reported that they had to help respondents to extrapolate the total weekly time spent on an activity based on whatever the respondent could remember of that week – even if this account was incomplete. This suggests that SQ estimates were more likely to be based on respondents’ assessment of the usual rate of occurrence for an activity, rather than a “recall-and-count” strategy. Thus, the SQ estimates likely contain a higher degree of measurement error than the TD estimates.
Field reports from both countries also revealed that the SQs required more training than the TD. However, given that many enumerators were already familiar with the TD from previous WEAI piloting but lacked experience with the SQs, we hesitate to read too much into this difference. Indeed, we suspect that, in most cases, SQs would require less training time than TDs.
Overall, the results of our experiment provide little evidence that SQs can reliably produce shorter interview times than TDs. Whether this finding would extend to other developing countries or sectors other than agriculture is unclear and deserves further research.
Accuracy
The complexity involved in answering time-use questions means that respondents’ own estimates may not always be accurate and that the extent of inaccuracy may vary by survey method. In this section, we analyze which method is best suited for overcoming the types of challenges outlined above by examining differences in SQ and TD estimates. While we are unable to measure the accuracy of the two methods due to issues discussed below, this does not detract from the importance of accuracy as a general criterion for evaluating the time-use methods.
Two problems complicate this comparison. First, although the activities covered by the SQs and TD overlapped, each method used a different reference period. The TD asked about all activities during the previous 24 hours (Figure ); the SQs asked about time spent on specific activities during the past seven days (Figure ). To permit comparison, we converted the SQ estimates into daily averages by dividing by seven. However, while the time spent on an activity during the past 24 h may correspond to the average daily time spent on an activity over the past week, this may be disrupted by events like illness or weather shocks. Fortunately, both the SQ and TD modules include questions about whether the amount of time reported was typical for the respondent. Under ideal circumstances, we could simply restrict our analysis to only those accounts reported to be typical. However, because circumstances in the field are often far from ideal, even if we restricted our analysis to “typical” time use, we cannot rule out that some of the observed difference between SQ and TD estimates stems from natural variation in respondents’ activities over the reference periods, rather than recall error or other reporting biases. This limitation should be borne in mind when considering our results.
Figure 3 Stylized questions in WEAI 2.0 individual questionnaire
A more fundamental problem in comparing time-use estimates across the two methods is that we do not observe how people actually spend their time and thus lack the proper frame of reference to say which method is the most accurate. Because establishing which method is the most accurate is impossible without this frame of reference, we focus on understanding why the SQ and TD estimates in our data differ. More specifically, we attempt to draw out any non-random variation in the difference between the two estimates using multivariate regression and test whether this variation can be attributed to the types of cognitive challenges described above.
Do differences in time-use estimates vary systematically according to the type of activity? Based on the previous discussion, we expect this to be true, and more specifically, we expect that the divergence between the two methods will be greatest for irregular, less salient activities, such as agricultural work.
We begin by estimating country-specific OLS regressions that examine whether differences between SQ and TD estimates vary systematically according to the activity. The specification for these regressions is:
(1)
(1)
The dependent variable is the absolute difference between the two estimates for individual i in activity j, and the explanatory variables comprise a set of dummy variables corresponding to each type of activity. The unit of analysis is activity-specific, and each respondent may be represented in the sample up to nine times (the total number of activities asked about). To account for this, we cluster standard errors at the individual level.
Table compares the average time spent on each activity and the statistical significance of the difference (based on paired t-tests) for respondents in both countries. Respondents reported spending roughly the same amount of time on employed labor and travelling/commuting, regardless of method. This pattern is broadly consistent with the notion that the ability to accurately recall an activity is affected by the regularity and saliency of the activity. Employed labor and, to some extent, commuting to and from the workplace are likely to follow a very regular schedule; hence, respondents’ ability to accurately report their time may not be as greatly affected by the longer recall period associated with SQ.
Table 3 Average time spent on different activities by method and country (in minutes)
Table presents the regression results. We find that the degree of difference between SQ and TD estimates changes depending on the activity, although there is considerable variation across countries. In both countries, farming/livestock/fishing and domestic work are associated with larger differences, whereas weaving/sewing/textile care is associated with smaller differences. Because agriculture tends to follow an irregular schedule and can often be monotonous, we expected to find significant divergence between methods, based on the premise that respondents would struggle to accurately recall time spent on agricultural work over a 7-day period. Indeed, we observed the largest difference for farming/livestock/fishing. For other activities, no consistent pattern emerges across countries.
Table 4 OLS regression results: Do differences in reported time use between time diary and stylized estimates vary according to the activity?
Overall, the results suggest that whether SQs and TDs should be expected to provide similar estimates depends on both the activity in question and the study setting. Yet, we would advise against over-interpreting the country-specific differences we observe, which could stem from any number of unobserved factors affecting the frequency or performance of certain activities and from differences in survey implementation. For instance, more experienced enumerators may be able to extract more accurate estimates from respondents regardless of the type question used. In fact, in Bangladesh, where enumerators tended to be highly qualified, often holding an advanced, post-secondary degree, differences between the two methods tended to be quite low regardless of activity type: the largest average discrepancy observed in the Bangladeshi sample is 21 minutes (shopping/receiving service), compared to 87 minutes in the Ugandan sample (domestic work).
Next, we investigate potential sources of reporting bias that could impact differences in the estimates provided by the two methods. Although not exclusively associated with time-use surveys, social desirability bias could occur if a respondent changed how much time they reported spending on an activity based on how they wanted to be perceived by enumerators and/or others in their community. While the presence of social desirability bias or other reporting biases is not directly observable, we do have information on several potentially related factors: respondent characteristics (sex, age, education, literacy); enumerator fixed effects; and interview characteristics (whether the respondent was interviewed alone or with other adults present). Theoretically, none of these should be significantly related to the difference between the estimates obtained from the SQs and TDs. Thus, any statistically significant correlation associated with these factors may be a sign of potential reporting bias. Such correlation could, however, arise from other processes related to these variables outside of our consideration, and thus, we caution against interpreting these results as definitive proof of reporting bias.
We investigate this question using a similar empirical framework. The general specification for these regressions is:
(2)
(2)
The dependent variable is the absolute difference between the two estimates for individual i in activity j. The explanatory variables include a vector X of respondent characteristics (sex, age, age-squared, literacy, and education), an enumerator fixed effect, a dummy variable for whether the interview was conducted alone, and the same set of activity dummy variables included in EquationEq. 1
(1)
(1) . Standard errors are clustered at the individual level. Table presents the results. Joint significance tests for each set of predictors are included in the bottom panel of the table.
Table 5 OLS regression results: Do differences in reported time use between time diary and stylized estimates vary according to respondent, enumerator, or interview characteristics?
In both countries, we find evidence of the joint significance of both respondent and enumerator characteristics but not for whether the respondent was interviewed alone. Individually, we see variation across countries in how specific traits relate to the difference between estimates. Sex is associated with smaller differences between estimates in the Bangladeshi sample and larger differences in the Ugandan sample. This pattern may stem from differences in the types of activities traditionally undertaken by women, with women being more involved in a wider range of productive activities in Uganda and more mobile compared to women in Bangladesh, as well as the possibility that activities in monoculture rice cultivation (in Bangladesh) may not vary much within the short reference period in the interview. Education is associated with smaller differences between estimates in the Bangladeshi sample, but literacy has an opposite effect, suggesting nonlinearities. Enumerator fixed effects are jointly significant in both countries, supporting the hypothesis that respondents’ ability to respond to questions about time use may be correlated with enumerators’ ability to successfully (or unsuccessfully) conduct time-use interviews.
PUSHING THE BOUNDARIES OF TIME-USE STUDIES: QUALITY OF TIME
Research on quality of time moves beyond the traditional focus of time-use research – how much time people devote to different activities – and attempts to understand how people experience time devoted to these activities. Some tasks may bring pleasure or happiness, whereas other tasks may be more unpleasant or physically taxing, due to higher energy expenditure or some element of danger or risk. Information about quality of time could provide insights into how labor is shared within households. Indeed, women often perform multiple activities at once (for example, livelihood activities and childcare), which can be more stressful or demanding than engaging in a single activity.
Accurately measuring quality of time is difficult. One approach involves inferring a person’s physical or emotional state based on the type of activities they engage in. For example, Floro (Citation1995) and Maria S. Floro and Anant Pichetpongsa (Citation2010) draw conclusions about the deleterious effects of overlapping work activities on women’s well-being, but this requires strong assumptions about the physical and emotional demands of combining work activities. Similar assumptions are implicit in the workload indicator of the WEAI: time spent on secondary work activities is given half the weight of primary work activities, regardless of the type or sequence of activities being combined.
Experience sampling
Assumptions like these are problematic, given the idiosyncrasies involved in how people experience time (Krueger et al. Citation2009). For example, not all leisure activities are equally enjoyable and not all non-leisure activities are equally arduous. Experience sampling, the most common approach to measuring psychological aspects of quality of time, avoids such assumptions and relies on respondents’ own evaluations of their physical or emotional state.Footnote9 It includes approaches like the Experience Sampling Method (ESM; Hektner, Schmidt, and Csikszentmihalyi Citation2007), which asks respondents to record specific details about the activities they are currently engaged in at random moments throughout their day, usually prompted by a preprogrammed device (for example, stopwatch, pager, timer, or smartphone), as well as several other adaptations of ESM.
Although interest in experience sampling has mostly been limited to psychologists, there are several promising avenues for methodological innovation in time-use research based on ESM that have the potential to reduce recall bias. Assuming full compliance on the part of respondents and the absence of incentives to misrepresent one’s actions (for example, if the respondent is engaged in illicit or illegal activities), experience sampling – recorded contemporaneously rather than retroactively – should yield exact data on respondents’ activities.
In related work conducted as an add-on to data collection of the WEAI in Bangladesh, one of us incorporated aspects of experience sampling into a traditional, 24-hour recall TD to yield insights into the intrahousehold sharing of labor in Bangladesh (Seymour and Floro Citation2016). In our survey, respondents were asked to report how often they experienced five emotions (happiness, sadness, tiredness, pain, and stress) during each episode of activity indicated in the TD on a 10 point Likert scale, ranging from 1 (“did not experience the feeling at all”) to 10 (“experienced the feeling all the time”). Episodes were classified as unpleasant or pleasant depending on the most intense emotion experienced during the episode.Footnote10
Figure shows the proportion of time men and women in the sample experienced as pleasant for different categories of activities and provides insight into the intrahousehold sharing of labor among couples in Bangladesh. Although men and women reported roughly the same amount of overall working time, men allocated more of their time to labor market work (75 percent of total work), whereas women allocated more time to household work (86 percent of total work).
Figure 4 Kernel density estimates of the proportion of time experienced as pleasant by gender and type of activity Notes: The dotted lines show the mean values among men and women, respectively. Only the difference for household work is statistically significant, according to conventional thresholds. Labor market work includes: work as employed; own business work; farming; construction; fishing; and other work. Household work includes: collecting water and firewood; vegetable gardening; animal husbandry; caring for children and the sick/elderly; cooking; shopping/going to the market; cleaning the home; weaving, sewing, and textile care; and other domestic work. Total work is the sum of labor market work and household work. Leisure includes: traveling; watching television; listening to radio; reading; sitting with family; social activities; and other leisure. Sources: Figure 4.2 from Seymour and Floro (Citation2016).
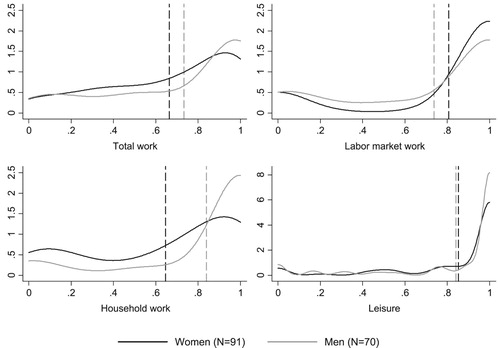
This gender gap is even more meaningful if we consider how men and women experienced time spent in these activities. Women in the sample experienced 65 percent of time spent on household work as pleasant, compared to 84 percent for men. Women’s negative experience is largely attributable to a few specific domestic activities that involve repetitive tasks and drudgery (cooking, cleaning the home, collecting water and firewood, and other domestic work) rather than caring for children and sick/elderly adults, which women in the sample thought of positively (see Figure ). Women experienced 92 percent of time spent on care work as pleasant compared to 64 percent for non-care household work. Labor market work, on the other hand, was experienced as pleasant at roughly the same rate by men and women in the sample.
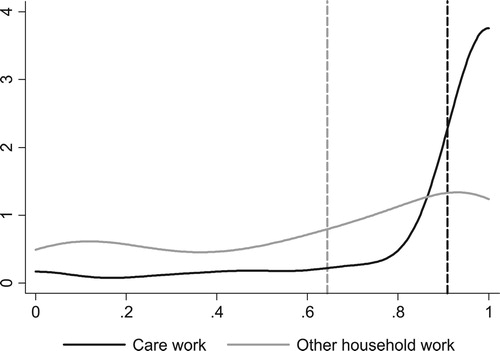
Figure 5 Kernel density estimates of the proportion of time experienced as pleasant by women: Care work vs. other types of household work Notes: Kernel density estimates of the proportion of time experienced as pleasant by women for care work versus other types of household work (cooking, cleaning the home, collecting water and firewood, and other domestic work). The dashed lines indicate mean values. T-test performed comparing the means values of care work and other household work indicate that the difference is statistically significant at the 99 percent confidence level. Source: Figure A.1 from Seymour and Floro (Citation2016).
Reticence among time-use researchers to use experience sampling in developing countries may arise from the common impression that experience sampling methods are prohibitively costly to implement, given that respondents must be equipped with appropriate data collection devices. In the current global environment of decreasing technology costs and high levels of mobile phone usage, these constraints are quickly becoming less binding. For instance, wearable activity-tracking devices can be used to track the movement of individual respondents and yield richer datasets, capable of answering a wider set of research questions. Technological innovation based on experience sampling may thus be key to improving current time-use methods.
Energy expenditure
Aside from the psychological aspects of time use, there is growing interest in monitoring energy expenditure or work effort associated with various activities. Drawing from efforts to measure physical activity, the key concepts revolve around frequency, duration, and intensity (FAO Citation2004). Development practitioners could be concerned, for example, by whether an intervention “did no harm” in terms of increasing women’s energy expenditure. This question can be disaggregated into three components: (1) whether the intervention increased the duration, intensity, and frequency of engagement in intervention activities; (2) if yes, whether it led to any adverse changes in BMI; (3) whether the intervention caused any other undesirable effects on time, such as reduction in time for child care, relaxation, or leisure.Footnote11 These questions are especially relevant in rural areas of developing countries where lack of publicly provided infrastructure, limited access to mechanical or animal power, or access to labor-saving devices is associated with higher work burdens and increased drudgery. This approach is quite different from the developed country literature, which emphasizes increasing activity levels to prevent becoming overweight and to avoid obesity.
Advances to reduce the costs of monitoring energy expenditure in a field setting are fairly recent. The “gold standard” for measuring energy expenditure, the “doubly labeled water” method, in which respondents drink water infused with heavy (non-radioactive) isotopes that can be tracked in urine samples, is costly and infeasible to collect in large samples in a field setting; recent studies in developing countries have used smaller samples.Footnote12 Moreover, to characterize energy expenditure over an extended period of time, we would ideally measure the intensity, duration, and frequency of activity. Several methods exist for obtaining this information (for example, heart rate monitoring, pedometers, or activity-tracking devices), but the most common is activity diaries. Activity diaries face similar issues as TDs: once the amount of time spent on a specific activity is determined (which is itself subject to recall bias), the activity has to be matched to a list of activities in various categories, each with its own energy expenditure conversion factors.Footnote13 Because respondents are unlikely to recall whether activities were consistently performed at peak intensity, estimates of energy expenditures using these methods are likely to be unreliable.
CONCLUSION
Time-use surveys are essential for diagnosing and designing effective policies or programs to address gender disparities in time. Yet, understanding how to effectively and consistently implement time-use surveys in rural areas of developing countries has lagged behind progress in developed countries. This paper contributes on several fronts to reversing this trend.
Based on research into the cognitive aspects of survey methods and our own experience on the WEAI, we offer guidance on best practices for SQs and TDs, the most common methods used to measure time use. SQs, which typically require the aggregation of discrete moments of activity over longer intervals, impose a greater cognitive burden on respondents than TDs, which usually focus on the previous 24 hours. This burden can be reduced by focusing on certain activities, such as wage or salary employment, which tend to follow a set schedule and are easier to accurately aggregate over time. For more irregular activities, SQs are likely to yield less accurate estimates than TDs. Because agricultural livelihoods in developing countries may be affected by weather, crop choice, and changes in technology that might influence time use, TDs are likely to be the preferred method in these settings.
Several challenges extend to both methods, some of which can be mitigated through the careful design of questionnaires and interview protocols. In general, vague descriptors or ambiguous reference periods should be avoided and locally relevant examples should be provided to assist respondents in identifying the correct reference periods and activities. The time-use interview should be structured to mimic the chronological ordering of autobiographical memory. Best practices for structuring interviews include not asking respondents to recall when and for how long they engaged in a long list of activities but, rather, encouraging respondents to recount their activities as part of a free-flowing narrative and relying on well-trained enumerators to “translate” the respondents’ words into the correct activity codes. Seasonality is likely to be an issue regardless of method. The best defense is a proper understanding of seasonal variation in labor patterns for the study setting, which may be used to inform the timing and sampling of the survey and the interpretation of the data. Information on seasonality can be obtained from analysis of weather data or through qualitative research methods, like the construction of seasonal calendars.
Second, we provide an empirical comparison of SQs and TDs using data from WEAI surveys in Bangladesh and Uganda. We find that SQs did not always produce shorter interviews compared to TDs, likely due to their relatively greater cognitive burden. We examine time-use estimates obtained from the SQs and TDs, and while we are unable to discern which method is most accurate, we are able to identify systematic differences between the two estimates, related to the type of activity, respondent characteristics such as age and education, and enumerator fixed effects. Consistent with insights from psychology on the cognitive aspects of survey methods, our results suggest a link between the ability to accurately recall activities in time-use surveys and the regularity and saliency of the activity in question. The existence of significant enumerator fixed effects in our data suggests that enumerators’ abilities can affect how well respondents are able to accurately recall their time use, and it emphasizes the importance of proper enumerator training when conducting time-use surveys.
Our last contribution sets the stage for survey methods that recognize the potential for measuring well-being in multiple aspects of time use, based on analysis of data from a small survey one of us conducted in Bangladesh. The finding that men and women experienced different emotions towards different types of work and that gender gaps existed in the distribution of pleasant and unpleasant activities suggest that broadening the scope of time-use research to capture both quantity and quality of time use will provide richer insights into gendered time-use patterns. The best path to this goal may be through combining mainstream time-use data collection methods with promising methodological innovations from other disciplines. Lessons from psychological approaches can be useful for discerning whether activities contribute to greater subjective well-being. Approaches from the biomedical sciences can arrive at reasonable estimates of energy expenditure. While the focus of this paper has been on quantitative methods for collecting time-use data, qualitative methods can play an important role in the design, implementation, and analysis of time-use surveys. Qualitative research conducted prior to quantitative data collection can be valuable for discerning seasonal labor patterns associated with the study setting and ensuring that the correct activities (and examples) are included in the time-use instrument. Seasonality calendars can identify not only patterns in product and labor demand but also psychological stresses associated with lack of food in the lean season, which may affect respondents’ recall of their activities and the degree to which they think these are pleasurable. Qualitative methods, such as focus group discussions and semi-structured interviews, can be incredibly effective for understanding local gender norms and contextualizing quantitative results. Careful documentation and comparison of all these approaches will help to advance the multidimensional measurement of time, to identify what time constraints – whether in quantity or quality – contribute most to gender inequality, and what policies and interventions can be implemented to relieve those constraints.
ACKNOWLEDGMENTS
This paper is part of a broader collaboration on methodological experimentation among several researchers from the World Bank, the International Food Policy Research Institute, the International Rescue Committee, and Oxford University to improve the measurement of time use, women’s agency, and ownership and control of assets. Specifically, the collaboration aims to achieve three goals: (1) assess the relative quality of the existing methods of measuring these constructs; (2) design and test new ideas to measure these constructs; (3) generate evidence on which measurement method is most appropriate given the policy and research question at hand. This work was undertaken as part of the Gender, Agriculture, and Assets Project Phase Two (GAAP2), the CGIAR Research Program on Agriculture for Nutrition and Health (A4NH), and the CGIAR Research Program on Policies, Institutions, and Markets (PIM).
Additional information
Funding
Notes on contributors
Greg Seymour
Greg Seymour is Research Fellow at the Environment and Production Technology Division at the International Food Policy Research Institute (IFPRI). His current research focuses on the refinement and validation of the Women’s Empowerment in Agriculture Index (WEAI) and, in broader research efforts, to understand the impacts of women’s empowerment on agricultural outcomes. He received his PhD and MA in economics from American University.
Hazel Malapit
Hazel Malapit is Senior Research Coordinator at the Poverty, Health, and Nutrition Division at IFPRI. She coordinates research, training, and technical assistance on the implementation of the Women’s Empowerment in Agriculture Index (WEAI), manages and coordinates the integration of gender into the research of the CGIAR Research Program on Agriculture for Nutrition and Health (A4NH), and conducts research on gender, women’s empowerment, agriculture, health, and nutrition issues. She received her MA in economics from the University of the Philippines and her PhD in economics from American University.
Agnes Quisumbing
Agnes Quisumbing is Senior Research Fellow at the Poverty, Health, and Nutrition Division at IFPRI. She has published widely on gender, intrahousehold allocation, property rights, poverty, and economic mobility. She is currently engaged in impact evaluations of nutrition-sensitive agricultural development programs in South Asia and Sub–Saharan Africa, focusing on their impacts on women’s empowerment and gender asset inequality. She received her PhD and MA in economics from the University of the Philippines, Quezon City, was a Fulbright-Hays Fellow at the Massachusetts Institute of Technology, and a Visiting Fellow at the Economic Growth Center, Yale University.
Notes
1 The applicability of time-use studies to research questions in either category, of course, depends on a broad range of factors, including the breadth of information collected in the survey and respondent selection within households.
2 See, for example, the labor force component of the US Current Population Survey: http://www2.census.gov/programs-surveys/cps/techdocs/questionnaires/Labor%20Force.pdf.
3 We thank an anonymous referee for raising these important differences between the WEAI surveys and stand-alone national time-use surveys.
4 Although this evidence comes almost entirely from developed countries, many of the insights are likely still relevant in developing countries.
5 These guidelines were developed based on the protocol developed for the WEAI by Data Analysis and Technical Assistance, Limited (DATA) in Bangladesh. A video tutorial for the method is available online: https://www.youtube.com/watch?v=jr8ebiKUkbQ.
6 Similarly, Man Yee Kan and Stephen Pudney (Citation2008) compare SQ and TD estimates for the same individual in a British survey and find evidence of greater measurement error in SQs versus TDs, though they attribute this mostly to randomness rather than systematic bias.
7 Seasonality bias is not limited to farming. Time spent on other activities that also follow a seasonal schedule (for example, small businesses, construction work, migrant labor) may also exhibit seasonality bias.
8 Question 3 only asked if the time spent on [ACTIVITY] in the last 7 days was unusual according to the respondent.
9 Also called “event sampling methodology,” this method was initially developed by Reed Larson and Mihaly Csikszentmihalyi (Citation1983). Antecedents of this method include random spot observation. In random spot observation, external observers collect the data, whereas in experience sampling, the respondent responds about his or her conditions at a given time.
10 For example, if a respondent reported experiencing happiness (10) more often than sadness (2), tiredness (4), pain (1), and stress (3) during a particular episode of activity, then the episode was classified as pleasant.
11 This draws from notes prepared by Gina Kennedy on measuring energy expenditure and physical activity, see http://www.a4nh.cgiar.org/files/2015/01/Energy-Expenditure-and-Physical-Activity-Reference-Notes1.pdf.
12 A recent example of this approach in a developing country context is the study by Herman Pontzer et al. (Citation2012) in Tanzania.
13 There are several questionnaires, mainly from the US and Europe, that include links to physical activity questionnaires, for example: http://appliedresearch.cancer.gov/resource/collection.html.
REFERENCES
- Alkire, Sabina, Ruth Meinzen-Dick, Amber Peterman, Agnes R. Quisumbing, Greg Seymour, and Ana Vaz. 2013. “The Women's Empowerment in Agriculture Index.” World Development 52: 71–91. doi: 10.1016/j.worlddev.2013.06.007
- Arthi, Vellore, Kathleen Beegle, Joachim De Weerdt, and Amparo Palacios-López. 2018. “Not Your Average Job: Measuring Farm Labor in Tanzania.” Journal of Development Economics 130: 160–72. doi: 10.1016/j.jdeveco.2017.10.005
- Belli, Robert F. 1998. “The Structure of Autobiographical Memory and the Event History Caldendar: Potential Improvement in the Quality of Retrospective Reports in Surveys.” Memory 6(4): 383–406. doi: 10.1080/741942610
- Brown, Norman R. 2002. “Encoding, Representing, and Estimating Event Frequencies: A Multiple Strategy Perspective.” In Etc. Frequency Processing and Cognition, edited by Peter Sedlmeier and Tilmann Betsch, 37–53. New York: Oxford University Press.
- Brown, Norman R., Rebecca L. Williams, Erin T. Barker, and Nancy L. Galambos. 2007. “Estimating Frequencies of Emotions and Actions: A Web-Based Diary Study.” Applied Cognitive Psychology 21: 259–76. doi: 10.1002/acp.1303
- Chatzitheochari, Stella, Kimberly Fisher, Emily Gilbert, Lisa Calderwood, Tom Huskinson, Andrew Cleary, and Jonathan Gershuny. 2018. “Using New Technologies for Time Diary Data Collection: Instrument Design and Data Quality Findings from a Mixed-Mode Pilot Survey.” Social Indicators Research 137(1): 379–90. doi: 10.1007/s11205-017-1569-5
- Daum, Thomas, Hannes Buchwald, Ansgar Gerlicher, and Regina Birner. 2019. “Times Have Changed: Using a Pictorial Smartphone App to Collect Time–Use Data in Rural Zambia.” Field Methods 31(1): 3–22. doi: 10.1177/1525822X18797303
- Esquivel, Valeria, Debbie Budlender, Nancy Folbre, and Indira Hirway. 2008. “Explorations: Time-Use Surveys in the South.” Feminist Economics 14(3): 107–52. doi: 10.1080/13545700802075135
- Fisher, Kimberly. 2015. Metadata of Time Use Studies. Centre for Time Use Research, University of Oxford, United Kingdom. http://www.timeuse.org/information/studies/.
- Floro, Maria S.. 1995. “Women's Well-Being, Poverty, and Work Intensity.” Feminist Economics 1(3): 1–25. doi: 10.1080/714042246
- Floro, Maria S. and Anant Pichetpongsa. 2010. “Gender, Work Intensity, and Well-Being of Thai Home-Based Workers.” Feminist Economics 16(3): 5–44. doi: 10.1080/13545701.2010.499657
- Food and Agriculture Organization of the United Nations. 2004. Human Energy Requirements. Rome: FAO.
- Frazis, Harley and Jay Stewart. 2012. “How to Think About Time-Use Data: What Inferences Can We Make About Long- and Short-Run Time Use from Time Diaries?” Annals of Economics and Statistics 105/106: 231–45. doi: 10.2307/23646463
- Harvey, Andrew S. and Maria Elena Taylor. 2000. “Time Use.” In Designing Household Survey Questionnaires for Developing Countries: Lessons from 15 Years of the Living Standards Measurements Study, Volume 2, edited by Margaret Grosh and Paul Glewwe, 249–72. Washington, DC: World Bank.
- Hektner, Joel M., Jennifer A. Schmidt, and Mihaly Csikszentmihalyi. 2007. Experience Sampling Method: Measuring the Quality of Everyday Life. Thousand Oaks, CA: Sage Publications.
- Juster, F. Thomas, Hiromi Ono, and Frank P. Stafford. 2003. “An Assessment of Alternative Measures of Time Use.” Sociological Methodology 33: 19–54. doi: 10.1111/j.0081-1750.2003.t01-1-00126.x
- Kan, Man Yee and Stephen Pudney. 2008. “Measurement Error in Stylized and Diary Data on Time Use.” Sociological Methodology 38: 101–32. doi: 10.1111/j.1467-9531.2008.00197.x
- Krueger, Alan B., Daniel Kahneman, David Schkade, Norbert Schwarz, and Arthur A. Stone. 2009. “National Time Accounting: The Currency of Life.” In Measuring the Subjective Well-Being of Nations: National Accounts of Time Use and Well-Being, edited by Alan B. Krueger, 9–86. Chicago: University of Chicago Press.
- Larson, Reed and Mihaly Csikszentmihalyi. 1983. “The Experience Sampling Method.” New Directions for Methodology of Social and Behavioral Science 15: 41–56.
- Masuda, Yuta J., Lea Fortmann, Mary Kay Gugerty, Marla Smith-Nilson, and Joseph Cook. 2014. “Pictorial Approaches for Measuring Time Use in Rural Ethiopia.” Social Indicators Research 115(1): 467–82. doi: 10.1007/s11205-012-9995-x
- Menon, Geeta. 1993. “The Effects of Accessibility of Information in Memory on Judgments of Behavioral Frequencies.” Journal of Consumer Research 20(3): 431–40. doi: 10.1086/209359
- Pontzer, Herman, David A. Raichlen, Brian M. Wood, Audax Z.P. Mabulla, Susan B. Racette, and Frank W. Marlowe. 2012. “Hunter-Gatherer Energetics and Human Obesity.” PLoS ONE 7(7): e40503. doi: 10.1371/journal.pone.0040503
- Quisumbing, Agnes R., Shalini Roy, Jemimah Njuki, Kakuly Tanvin, and Elizabeth Waithanji. 2013. “Can Dairy Value-Chain Projects Change Gender Norms in Rural Bangladesh? Impacts on Assets, Gender Norms, and Time Use.” IFPRI Discussion Paper No. 1311, International Food Policy Research Institute, Washington, DC.
- Seymour, Greg and Maria S. Floro. 2016. “Identity, Household Work, and Subjective Well-Being Among Rural Women in Bangladesh.” IFPRI Discussion Paper 1580, International Food Policy Research Institute, Washington, DC.
- Sudman, Seymour and Norman M. Bradburn. 1973. “Effects of Time and Memory Factors on Response in Surveys.” Journal of the American Statistical Association 68(344): 805–15. doi: 10.1080/01621459.1973.10481428
- United Nations. 2015. The World’s Women 2015: Trends and Statistics. New York: United Nations, Department of Economic and Social Affairs, Statistics Division.