
 ?Mathematical formulae have been encoded as MathML and are displayed in this HTML version using MathJax in order to improve their display. Uncheck the box to turn MathJax off. This feature requires Javascript. Click on a formula to zoom.
ABSTRACT
Introduction
Individuals experiencing auditory hallucinations (AH) tend to perceive voices when exposed to random noise. However, the factors driving this tendency remain unclear. The present study examined the interaction of a top-down (expectations) and bottom-up (type of noise) process to better understand the mechanisms that underlie AH.
Methods
Fifty-two healthy individuals (29 with high proneness and 23 with low proneness to AH) completed a signal detection task, in which they listened to pre-recorded sentences. The last word was either masked by noise or only noise was presented without the word. Two types of noise existed (speech-related versus speech-unrelated frequencies) and words were characterised by either high or low levels of semantic expectation.
Results
Participants with high proneness to AH showed a more liberal decision bias (i.e., they were more likely to report having heard a word) and poorer discrimination ability as compared to participants with low proneness to AH – but only when the word was masked by speech-related noises and the level of expectation was high. Further, the more liberal decision bias correlated negatively with the tendency to experience AH.
Conclusion
This novel paradigm demonstrated an interaction between top-down (level of expectation) and bottom-up (type of noise) processes, supporting current theoretical models of AH.
Signal detection (SD) theory (Green & Swets, Citation1966) is the theoretical field concerned with explaining and predicting the ability to distinguish signals from noise in uncertain environments. A liberal decision bias in signal detection refers to the tendency to report that a signal is present and is assumed to be one of the core mechanisms of auditory hallucinations (AH) (Brookwell et al., Citation2013; Waters et al., Citation2012). This assumption is born out of auditory SD paradigms specifically designed to examine AH. In the first study employing such an approach by Bentall and Slade (Citation1985), participants were asked to listen to recordings of white noise, in which the white noise was either presented alone or together with barely audible embedded words. Participants were then required to indicate whether they detected a word in the noise. As in any other SD paradigm, there were four possible outcomes for each trial: If a signal is actually present ( = a word is embedded in the noise), one may correctly detect it (hit) or not (miss). In turn, if the signal is absent ( = no word embedded in the noise), one may correctly indicate so (correct rejection) or erroneously perceive a signal (false alarm). This last category is akin to AH in that one erroneously perceives something that is not actually there. In SD paradigms, response patterns are reflected by two main indices: perceptual sensitivity (i.e., the ability to detect true signals) and decision bias (i.e., the tendency to report that signals are present).
In the original study by Bentall and Slade (Citation1985), people with hallucinations (both patients and healthy individuals) showed a more liberal decision bias compared to people without hallucinations, but no significant difference in terms of perceptual sensitivity. In other words, people with hallucinations have a greater tendency to answer “yes, I heard a word” but are not necessarily worse at discriminating whether a word was presented or not. In addition, the bias in signal detection was significantly correlated with the severity of AH in patients (this was not examined in healthy participants).
The more liberal decision bias has been replicated several times and can be considered a reliable group effect (e.g., Alganami et al., Citation2017; Barkus et al., Citation2007; Bentall & Slade, Citation1985; Brookwell et al., Citation2013; Chhabra et al., Citation2016; Rankin & O'Carroll, Citation1995; Vercammen et al., Citation2008). However, the results are inconsistent concerning perceptual sensitivity, with some studies reporting a lower perceptual sensitivity in people with AH (e.g., Chhabra et al., Citation2016; Li et al., Citation2002) while others found no significant differences (e.g., Alganami et al., Citation2017; Barkus et al., Citation2007). Similarly, some studies reported significant relations between AH proneness and the decision bias (e.g., Bentall & Slade, Citation1985; Daalman et al., Citation2012; Laloyaux et al., Citation2019; Vercammen & Aleman, Citation2010) while others did not (e.g., Chhabra et al., Citation2016; Daalman et al., Citation2012; Hoskin et al., Citation2014). The largest study to date with more than 1000 mostly healthy participants found a positive correlation between the false alarm rate and the tendency to experience AH as well as a negative correlation between the decision bias and the tendency to experience AH. The results on perceptual sensitivity were inconclusive (Moseley et al., Citation2021). These inconsistent results may be, in part, explained by a lack of understanding the factors that drive the effect.
The prevailing neurocognitive theoretical model of AH (Waters et al., Citation2012) claims that AH arise through an interaction between bottom-up and top-down processes. On the bottom-up level, the model hypothesises a certain degree of neural hyperactivity of the auditory network – that can be triggered by internal or external conditions such as a noisy environment. On the top-down level, the model proposes the involvement of various cognitive and emotional factors such as a liberal decision bias, low cognitive control, increased hypervigilance, and high expectation that would influence the form and the meaning of the AH. In this model, a decision bias in signal detection is hypothesised to increase the likelihood of detecting aberrant signals from the auditory network.
Studies have examined different top-down factors that modulate the decision bias in auditory signal detection tasks. One such factor is a high level of expectation regarding the presence of a signal. In particular, three studies used semantic priming to explore the impact of the level of expectation on auditory SD paradigms. In Vercammen and Aleman (Citation2010), students with high or a low proneness towards hallucinations were presented with sentences, in which the last word was either replaced by a burst of white noise alone or by a burst of white noise with an embedded word that was unpredictable or predictable (e.g., the sailor sells his chair VS the sailor sells his boat, respectively). Participants were asked to indicate whether they heard a word embedded in the noise and to identify it. Results revealed that the number of false alarms (i.e., the number of times participants reported hearing a word that was not actually in the noise) was significantly correlated with the proneness towards hallucinations. The effect remained significant after controlling for the number of hits. Predictable and unpredictable words had been collapsed in the analysis (i.e., they were not analysed separately).
Daalman et al. (Citation2012) employed the task developed by Vercammen and Aleman (Citation2010) and found that healthy participants with high proneness towards AH made significantly more false alarms than the healthy controls without AH – after controlling for the number of hits. Participants with psychosis, who reported AH, showed an intermediate performance. In addition, the number of false alarms was significantly correlated to AH proneness in healthy participants. In the patient group, the severity of AH did not significantly correlate with the number of false alarms. Here, too, predictable and unpredictable words were analysed together.
Hoskin et al. (Citation2014) looked at the role of both semantic expectation and negative emotions. Healthy participants were asked to listen to sentences, in which the last word was either replaced by a burst of white noise alone or by a burst of white noise with an embedded word. The sentences were designed to create a high or a low level of expectation regarding the last word (e.g., “The apple fell from the tree” vs. “The person looked at the tree”). In addition, the participants’ emotional state was manipulated with the help of a simple visual attention task involving negative or neutral pictures. Finally, participants were assessed with a measure of hallucination proneness. Results revealed that a high level of semantic expectation was significantly correlated with higher perceptual sensitivity (i.e., better performance in the SD task) as well as with a significantly more liberal decision bias. No main effect of emotions or an interaction effect was found. Finally, hallucination proneness did not correlate significantly with the decision bias.
Taken together, results from these three studies suggest that an aberrant top-down processing in the form of semantic expectation contributes to AH, in agreement with the neurocognitive model of AH (Waters et al., Citation2012). However, this model further claims that AH arise through an interaction of both top-down and bottom-up processes and not only from an aberrant influence of top-down processes. In the auditory SD paradigms described above, one could hypothesise, for example, that the bottom-up processes are related to the noise – the basic input and main source of perception. Nonetheless, the impact of the noise on the decision bias in signal detection has not been examined yet. Taking into account both top-down and bottom-up factors, such as type of noise, may aid explaining, at least partially, the inconsistent results concerning perceptual sensitivity and the relationship between the decision bias in signal detection and AH proneness.
Accordingly, Laloyaux et al. (Citation2019) argued that the sound frequencies composing the noise should be taken into consideration. Most studies using an auditory signal detection paradigm in the context of AH used white noise. However, there seems to be no theoretical reason behind this choice. White noise is a heterogeneous mixture of sound waves extending over a wide frequency range – typically from 1 Hz to 20k Hz – where all frequencies have the same intensity. However, human hearing is not equally sensitive to all the frequencies composing the white noise. In particular, the human audiogram reveals to be most sensitive to frequencies ranging from 2k to 4k Hz, corresponding to the majority of the sound energy of spoken language (Quam et al., Citation2012). Based on this observation and considering that most AH are perceived as voices, it seems sensible to hypothesise that the decision bias observed in SD paradigms using white noise is driven by specific frequencies of the noise. However, this important issue has not been explored, in general, and, in particular, not in interaction with top-down factors such as level of expectation.
Based on the neurocognitive model of AH (Waters et al., Citation2012), the aim of the present study was to examine the role of both specific noise frequencies and the level of expectation on the decision bias in people with high and a low proneness towards AH. It was hypothesised that in individuals with high proneness towards AH, a liberal decision bias in signal detection would arise through an interaction between: (1) specific frequencies composing the white noise (bottom-up) – and in particular those that are related to the perception of speech that would trigger aberrant signals – and (2) a high level of expectation (top-down).
Methods
Participants
The experiment consisted of two parts. Firstly, between 450–600 individuals were screened to identify participants with high and low proneness to AH, henceforth termed “High AH group” and “Low AH group”, respectively. The numbers represent our best estimate, as we can document 429 participants but one file with additional participants could not be retrieved. The participants were recruited from various faculties at the University of Bergen by visiting lectures (with permission from the teachers) and asking students to complete a screening questionnaire during the break. To keep participants naïve, they were told the cover story that the study aimed to explore the relations between certain personality traits and language processing and that those with certain traits would be invited to participate in a follow-up experiment. No incentive was offered at this stage, but the students were told that they would receive financial compensation, if they participate in the follow-up experiment. Participants were also asked to self-report if they had any hearing impairment or (past and current) psychiatric or neurological diagnosis.
We then identified 33 individuals (High AH group) who answered positively (“possibly applies to me” or “certainly applies to me”) to at least two of the four critical screening items described in the “Hallucination Screening Section” below. The Low AH group consisted of 25 individuals who answered negatively to all four items (0 = “certainly does not apply to me”, 1 = “possibly does not apply to me”). All 58 participants were invited to participate in the follow-up experiment. One participant from the high AH group had to be excluded because she reported having tinnitus when coming to the lab – while she indicated no hearing impairment during the screening phase. None of the remaining participants self-reported (a) hearing deficits, (b) past or current neurological diagnosis, or (c) past or current psychiatric diagnosis, except for one participant who recovered from depression five years prior to the study. Five additional participants were excluded as outliers, based on the well-established procedure of Hoaglin and Iglewicz (Citation1987). In this particular case, we excluded participants beyond the third interquartile range in one of the conditions of the SD task, two in the Non-Human noise/High expectation condition (one participant each from the High/Low AH group), two in the Human noise/High expectation condition (both from the High AH group), and one in the Human noise /Low expectation condition (from the Low AH group). This was done to exclude extreme performances that might artificially drive potential effects. These exclusions represent roughly 10% of the total sample size. The final sample consisted of 29 High AH (13 men, 16 women) and 23 Low AH participants (5 men, 18 women). Demographic information of the two groups is presented in .
Table 1. Demographic characteristics of participants.
Hallucination screening questionnaire
The hallucination screening questionnaire consisted of the extended version (Larøi & Van der Linden, Citation2005) of the Launay Slade Hallucination Scale (LSHS) (Launay & Slade, Citation1981) in addition to one item from the revised version by McCarthy-Jones and Fernyhough (Citation2011) (i.e., “I hear people call my name and find that nobody has done so”), as it has good face validity regarding the aim of the study. In total, this LSHS version consisted of 17 items that assess the tendency to experience hallucination-like experiences such as AH, visual hallucinations, and vivid thoughts. Participants answered on a 5-point scale (0 = “certainly does not apply to me”, 1 = “possibly does not apply to me”, 2 = “unsure”, 3 = “possibly applies to me”, and 4 = “certainly applies to me”). To prevent participants from guessing the true purpose of the study, ten additional distracting items were added, assessing various personality traits, unusual experiences, and sleep quality.
To select two groups of participants that were either highly or hardly prone to AH, only the following four items from the screening questionnaire were used: “I have been troubled by hearing voices in my head”; “In the past, I have had the experience of hearing a person’s voice and then found that no one was there”; “I often hear a voice speaking my thoughts aloud”; “I hear people call my name and find that nobody has done so”.
Semantic signal detection task
Participants were asked to carry out a computerised, semantic SD task inspired by Hoskin et al. (Citation2014) and Vercammen and Aleman (Citation2010). Specifically, participants listened to 140 sentences from which the last word was either replaced by a burst of 2 s of noise alone or by a burst of noise containing an embedded word. The sentences were designed to create a high or a low level of expectation regarding the last word of the sentence (see below for examples). Furthermore, two different types of noise were used: a noise containing speech related frequencies (Human-noise) and a noise that does not contain these frequencies (Non-human noise).
Each trial of the SD task begins with a visual countdown, which consists of a shrinking circle to mimic a “3, 2, 1” countdown. This was done to prevent interference with the verbal material. Subsequently, participants listen to the sentence ending with a burst of noise and indicate whether they heard the last word of the sentence (or not) by pressing a key on the keyboard (yes/no forced choice). After that, the next trial begins.
Sentences
Around 180–200 short sentences – between 4 and 9 words long – with the last word missing were generated in Norwegian. The number of sentences are an estimate, as we cannot retrieve the files with all original sentences. The sentences are emotionally neutral, written in third-person, and do not contain proper nouns. Half of the sentences ended with a word for which participants had high expectations, whereas the other half contained sentences with a word for which participants had no or low levels of expectation. An independent sample of 25 participants was asked to fill the missing word of each sentence with the first word that came to mind. One hundred and forty of those sentences were retained based on the level of agreement between the participants regarding the missing word. In particular, sentences with a high level of expectation are those for which at least 85% of participants reported the same word. Examples are: “Bees gather nectar to make *honey*”; “The firemen extinguished the *fire*”; “A new-born cat is called a *kitten*”; “The hen is brooding an *egg*”. The sentences with a low level of expectation are those for which maximum 35% (ranging from 10% to 35%) of participants reported the same word. Examples are: “In their free time, they play *football*”; “The robber stole *books*”; “She does not like *hip-hop*”; “In summer, there are a lot of *seagulls*”.
Of the 140 sentences, half ended with an expected word (henceforth termed “High expectation condition”); the other half ended with a word that was not necessarily expected (“Low expectation condition”). Half of the sentences were recorded by a male and half by a female speaker. Thirty-five of those 70 sentences, in both expectation conditions, had the last word embedded in a Human noise and 35 in a Non-human noise. Of those 35 sentences in each of the four noise/expectation conditions, 15 contained a word while 20 did not. The sentences were distributed across the four conditions to balance sentence length, sex/gender of the speaker, and the percentage of agreement regarding the last word. The distribution is illustrated in .
Figure 1. Flow-chart depicting the number of sentences across the different conditions.
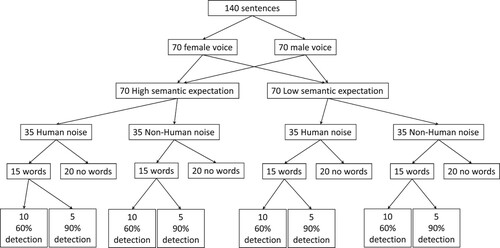
For the sentences that actually contained a word embedded in the noise, two different signal-to-noise ratios were used: For 66% of the sentences, the last word was barely audible, and for 33%, the word was easy to detect. The thresholds were determined based on an independent sample of 10 participants. During this pre-test, participants were presented with different signal to noise ratios and had to indicate whether they heard a word in the two types of noise but without having to identify it. Trial order was pseudorandomised. By alternating stimuli that do and do not contain a word, the expectation effect was meant to be facilitated (Catalan et al., Citation2014). The words were randomly embedded at various moments within the 2 s of noise to avoid temporal prediction.
Types of noise
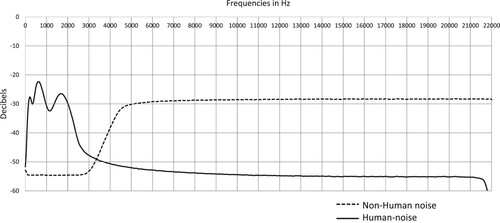
Human noise and Non-human noise varied in terms of the intensity of the speech-related frequencies. This was done based on the fundamental (F0) and formant (F1 and F2) frequencies reported by Hillenbrand et al. (Citation1995). The formants refer to the main frequencies in speech waves. In other words, they are the sound frequencies that human language is composed of. The Human noise and the Non-human noise were created using Adobe Audition©. Both noises are based on white noise in which the speech frequencies (F0, F1, F2) are increased (Human-noise) or decreased (Non-human noise) using the Fast Fourier Transform filter effect (using these parameters: scale = logarithmic, spline curve = off, FFT size = 2048, and Window = Blackman). The sound spectra are represented in . In the Human-noise spectrum, the three peaks represent respectively F0, F1, and F2.
Figure 2. Sound spectrum of the Human noise and Non-human noise.
Presentation of stimuli
Specific hardware was used to ensure the best possible rendering of the sound frequencies composing the noises. Specifically, we used open headphones Beyerdynamic© DT 880 - 32 Ω. Unlike many headphones (and in particular, most low-cost headphones), these headphones have an excellent frequency response – including the high frequencies – and do not compress the sound. In addition, we used a specific USB digital-to-analogue-converter (DAC) AudioQuest© DragonFly Black. A proper DAC is important, since most of the built-in DACs (such as in laptops, desktop computers or smartphones) are not able to accurately render the complete sound spectrum without distortion. The auditory stimuli were normalised and presented at 70 decibels. This was ensured by a sound level metre replicating the frequency response associated with the human hearing. The experiment was conducted in a soundproof room without windows and took approximately 10 min.
Cardiff Anomalous Perceptions Scale (CAPS)
The CAPS (Bell et al., Citation2006) was added as an additional assessment tool for hallucinations that was not used during screening. It is a 32-item questionnaire designed to measure anomalous perceptions such as auditory and visual hallucinations. Each item is first scored on a yes/no scale, and, if the participants answer affirmatively to an item, they are further asked about the frequency, distress, and intrusiveness of the experience. For the present study, only the answers to the yes/no scale were used and only for the seven AH items (items 3, 6, 7, 11, 13, 28, and 32). Analyses revealed excellent internal consistency for these items (McDonald's ω = 0.80).
Procedure
Demographic information had been collected during the screening part of the study. Upon confirming their identity, participants were seated in front of a computer, completed an audiogram to verify absence of hearing deficits, and subsequently were presented with the instructions of the SD task. After they had completed three practice trials, participants were left alone in the room to avoid any involuntary influence from the experimenter. Next, the CAPS was completed. Finally, participants in the follow-up experiment were fully debriefed and received 150 NOK (around 15 € or 16.50 USD). The study was approved by the local ethics committee (REK Vest, # 2017/2490) in accordance with the Declaration of Helsinki and participants signed a formal written consent form (one before entering the screening phase of the study and one after full debriefing).
Data analysis
Demographic characteristics of the High and Low AH individuals were compared using Student’s t-tests and Fishers exact test.
For each of the four noise/expectation conditions in the SD task, the decision bias (β) and perceptual sensitivity (A’) were calculated for each participant. Mean false alarms and hit rates are presented in . The formulas below were derived from Stanislaw and Todorov (Citation1999): β was calculated using the classic formula, where the constant e is multiplied by the square difference between the square false alarm (FA) rate and the square hit (Hit) rate divided by two. Lower β scores denote a more liberal response bias (i.e., participants are more likely to answer “yes, there was a word embedded in the noise”):
Often, d’ is reported as the indicator for perceptual sensitivity in SD theory. However, due to the yes/no nature of the task, the requirements for d’ (i.e., both the signal and noise are normally distributed and have the same standard deviation) could not be verified. As a result, A’ was calculated instead using the following formulas, where higher A’ scores denote a better perceptual sensitivity:
To test the hypothesis that High AH individuals would show a more liberal response bias and lower perceptual sensitivity than Low AH individuals, particularly when the level of expectation is high (as opposed to low level of expectation) and the word is embedded in Human noise (as opposed to Non-human noise), the means of β and A’ in each SD task condition were subjected to planned contrasts. More specifically, two GLMs with a factorial 2 (High/Low AH) x 2 (Human/Non-human Noise) x 2 (High/Low expectation condition) design were set up – one for β and one for A’. The group variable (High/Low AH) served as the categorical predictor, β/A’ from the four SD task conditions variables served as dependant variables, and age as well as education were included as continuous predictors (controlled variables). Subsequently, planned contrasts were directly calculated for each condition of interest with alpha set to 0.014 adjusted for multiple testing (Hommel, Citation1983, Citation1988). The analysis was carried out with TIBCO Statistica, Version 13.
Table 2. Mean hit rate and false alarm (FA) rate (in percentage).
For following up the significant findings in the decision bias, Fisher’s exact tests were used to compare the proportion of participants who reported at least one false alarm in each of the four SD task conditions. Here, the alpha-level was set to 0.024 (Hommel, Citation1983, Citation1988).
Finally, correlational analyses (Pearson) were conducted to examine the relationship between AH proneness (as assessed with LSHS-AH and CAPS-AH) and the decision bias β in each of the four SD task conditions. This was done on the total sample (N = 52) to have more variability in LSHS-AH and CAPS-AH scores and for comparisons with previous studies (e.g., Daalman et al., Citation2012; Vercammen & Aleman, Citation2010). The alpha-level was set to 0.018 (Hommel, Citation1983, Citation1988).
Results
The High AH group was significantly older and had significantly more years of education than the Low AH group. Hence these two factors were controlled for in the planned comparisons. As expected, High AH individuals also had significantly higher total LSHS scores, higher LSHS-AH score, and higher CAPS-AH scores than the Low AH individuals. The gender proportion was not significantly different between both groups (Fisher’s exact p = 0.141; Cramer’s V = 0.24).
Decision bias
The means for β in each SD task condition for both groups, adjusted for age and level and education, are presented in and . In the Human noise/High Expectation condition, High AH individuals had a significantly lower (i.e., more liberal) decision bias than Low AH individuals (F(1,48) = 7.29, p = 0.009, d = 0.69) but no significant group differences emerged in the Human noise/Low expectation condition (F(1,48) = 0.001, p = 0.969, d = 0.01).
Figure 3. Decision bias (β) adjusted for age and level of education.
Note: Error bars represent standard error of the mean; * = p< 0.01.
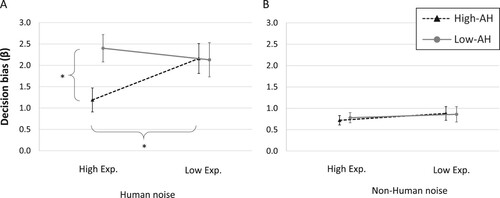
Table 3. Least square means (adjusted for age and level of education) for response bias β.
Within group contrasts revealed that in the Human noise conditions, the High AH group had a significantly lower β (i.e., more liberal response bias) in the High Expectation condition than in the Low Expectation condition (F(1,48) = 7.90, p = 0.007, d = 0.56). No significant group difference emerged in the Low AH group between the High and Low expectation condition (F(1,48) = 0.45, p = 0.502, d = 0.15).
In the Non-human noise conditions, the Low and High AH groups did not significantly differ from each other in either the High expectation condition (F(1,48) = 0.11; p = 0.736, d = 0.1) or the Low expectation condition (F(1,48) = 0.003; p = 0.951, d = 0.02). Similarly, within group contrasts showed no significant differences between High and Low expectation conditions for the High AH (F(1,48) = 0.21, p = 0.643, d = 0.11) and for the Low AH (F(1,48) = 0.96, p = 0.331, d = 0.22).
Fisher’s exact tests revealed that only the Human noise/High Expectation condition significantly differentiated both groups with 100% of the High AH reporting at least one false alarm (). When considering ≥ 2 false alarms, 79% of the High-AH group met the criterion as compared to 52% of the Low-AH group in the Human noise/High Expectation condition (one-tailed Fisher’s exact p = 0.03, Cramer’s V = 0.29). When considering all trials, the High AH group made 27% of errors in this condition, compared to 15% for the Low AH group (see ).
Table 4. Percentage of participants who reported at least one false alarm in each SD task condition per group.
Perceptual sensitivity
As shown in and , the two groups did not differ significantly in the Human noise condition (High expectation condition: F(1,48) = 4.19, p = 0.046, d = 0.59; Low expectation condition: F(1,48) = 0.31, p = 0.582, d = 0.16). Similarly, there was no significant group difference in the Non-human noise condition (High expectation condition: F(1,48) = 4.38; p = 0.041, d = 0.60; Low expectation condition: F(1,48) = 2.56; p = 0.115, d = 0.16).
Figure 4. Perceptual sensitivity (A’) adjusted for age and level of education.
Note: Error bars represent standard error of the mean; * = p< 0.01.
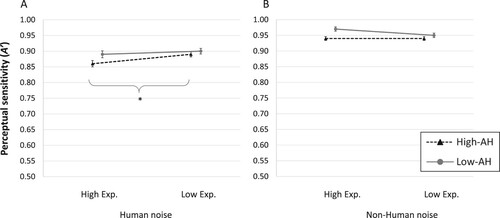
Table 5. Least square means (adjusted for age and level of education) for perceptual sensitivity A’.
Within group contrasts revealed that with Human noises, the High AH group had a significantly lower A’ (indicating poorer perceptual sensitivity) in the High expectation condition as compared to the Low expectation condition (F(1,48) = 10.63, p = 0.002, d = 0.62). Low AH individuals, on the other hand, showed a similar sensitivity in the High and Low expectation condition (F(1,48) = 0.27, p = 0.602, d = 0.11). Also with Non-human noises, there was no significant difference between High and Low expectation conditions (High AH: F(1,48) = 2.98, p = 0.090, d = 0.25; Low AH: F(1,48) = 6.02; p = 0.017, d = 0.39).
Association between AH proneness and decision bias
Both LSHS-AH and CAPS-AH scores were negatively correlated with β in the Human noise/High expectation condition (). None of the other correlations reached significance. This suggests that higher LSHS-AH and CAPS-AH scores (i.e., greater proneness to AH) were associated with a more liberal decision bias and a greater tendency to choose “yes, I heard a word”. The LSHS-AH and CAPS-AH scores themselves correlated with r = .67, p < .0001.
Table 6. Correlational analyses (Pearson) between AH proneness and response bias β.
Discussion
The present study aimed to test whether the combination of a top-down (expecting a certain word) and bottom-up (masking that word with noise that resembles human speech) process would elicit false auditory perceptions more easily in participants, who are prone to AH. Previous studies focused mostly on examining top-down effects with SD tasks (Daalman et al., Citation2012; Hoskin et al., Citation2014; Laloyaux et al., Citation2019; Vercammen & Aleman, Citation2010).
Decision bias
Several studies using similar SD paradigms found a more liberal decision bias in either patients or healthy individuals that were prone to AH as compared to control groups who were less prone to AH (Alganami et al., Citation2017; Barkus et al., Citation2007; Bentall & Slade, Citation1985; Brookwell et al., Citation2013; Chhabra et al., Citation2016; Moseley et al., Citation2021; Rankin & O'Carroll, Citation1995; Vercammen et al., Citation2008). We, too, found a significantly more liberal decision bias (β) in healthy individuals, who are highly prone to AH, as compared to healthy individuals, who are less prone to AH. However, we only found the more liberal decision bias when two conditions were met: when participants had a high expectation to hear a certain word and when the masking noise contained frequencies that mimic human speech. No difference with respect to decision bias emerged between the two groups when the masking noise did not contain speech-like frequencies or when participants did not expect a certain word. This finding was corroborated by additional analyses showing that all participants (100%) with high proneness to AH had at least one false alarm in the Human noise/High level of expectation condition (79% reported ≥ 2 false alarms). This differed significantly from participants with low proneness to AH, of whom 69% had one false alarm (52% reported ≥ 2 false alarms). Again, no significant group differences emerged when participants were exposed to non-human noise or had low expectations regarding the missing word at the end of the sentence.
Further, the present results are congruent with findings showing that top-down processing in the form of semantic priming contributes to false auditory perceptions: Both Vercammen and Aleman (Citation2010) as well as Daalman et al. (Citation2012) used the same semantic SD task and reported a group difference between individuals that were highly and less prone to AH. They did not, however, directly compare trials with high and low levels of expectation. In line with the present study, Hoskin et al. (Citation2014) found that when participants expected a certain word, their decision bias became more liberal than when they did not expect a certain word. However, the present study additionally revealed that this effect can be modulated not only by a top-down process (semantic priming) but also by an interaction of the top-down and a bottom-up process (type of masking noise). The present study thus corroborates the model of AH proposed by Waters et al. (Citation2012). A possible explanation is that noise with speech-like frequencies is more likely to trigger aberrant signals in the auditory network; and expecting a certain word (high level of expectation) would then increase the likelihood of detecting these aberrant signals and reporting them as being real perceptions.
Lastly, we found a significant correlation between the decision bias and both the LSHS and CAPS score – once more, only in the Human noise/High level of expectation condition: The higher the LSHS/CAPS score, the more liberal the decision bias. The correlation with the LSHS scores may simply reflect the planned comparisons results, as participants were grouped in high/low proneness to AH groups based on LSHS items. Although the CAPS was not used to group participants, results based on the CAPS yielded a similar pattern, corroborating the relationship between the decision bias and AH proneness. Other studies reported a similar relationship (Bentall & Slade, Citation1985; Daalman et al., Citation2012; Laloyaux et al., Citation2019; Vercammen & Aleman, Citation2010). Yet, other studies did not find a significant correlation (e.g., Chhabra et al., Citation2016; Daalman et al., Citation2012; Hoskin et al., Citation2014). This inconsistency is likely to arise from differences in the SD paradigms (e.g., which stimuli were used) and/or the sample (e.g., clinical hallucinators, clinical non-hallucinators, healthy individuals). It may also be possible that by designing the SD paradigm more in line with the theoretical model of AH (Waters et al., Citation2012) that postulates both top-down and bottom-up processes, the present study might have been more sensitive to detect this relationship.
Perceptual sensitivity
We found that participants, who were highly prone to AH, detected words more poorly when they expected a certain word as compared to when they did not expect a certain word. However, this effect only emerged in the Human noise condition. No other within-group comparisons reached significance, and, in general, no significant group differences were found. These findings suggest that not only did participants with high proneness to AH exhibit a more liberal decision bias, but they also discriminated more poorly between signals and noises in the Human noise/High level expectation condition. Poorer signal/noise discrimination ability had also been reported for people with schizophrenia as compared to controls in similar SD paradigms (Chhabra et al., Citation2016; Li et al., Citation2002). Hoskin et al. (Citation2014), on the other hand, found that when healthy participants had high expectations regarding the missing word, their perceptual sensitivity was increased. However, the participants in that study were not specifically selected for high/low proneness to AH, which could explain the different outcomes.
Limitations
Although we screened around 450–600 participants, a relatively small number of participants fulfilled the inclusion criteria for the high and low proneness groups (n = 29 and n = 23, respectively), resulting in relatively low statistical power. Between-group comparisons could only reliably detect effect sizes of d = 0.87 (based on a power analysis with the adjusted alpha = .014, power = .80, n1 = 29, n2 = 23, one-tailed). For within-group comparisons, the corresponding minimum effect size is d = 0.59 for n = 29 and d = 0.67 for n = 23 (with the adjusted alpha = .014, power = .80, one-tailed). The power analyses was carried out with G*Power (Faul et al., Citation2009). As a result, we could have missed smaller findings, for example, the high and low proneness to AH groups showed a trend towards a group difference (p = .046, d = 0.59) in the Human noise/High expectation and in the Non-human noise/High expectation condition (p = 0.041, d = 0.60) for the perceptual sensitivity measure. At the same time, the small sample sizes could have led to spurious findings, warranting future replications.
Furthermore, participants were included in the high and low proneness group who answered “certainly applies/does not apply to me” and “possibly applies/does not apply to me” to all selection questions. It could be argued that the “possibly” answer is too vague but excluding those participants would have further reduced the sample size.
One could have also run a sensitivity analysis, in which participants would be grouped into high and low AH individuals based on the CAPS items. We refrained from such an analysis, because the CAPS was completed after the signal detection task and participants could have formed hypotheses and expectations about the study’s purpose, which in turn could have affected the results. A better approach to test how much the findings of the present study depend on the screening items, would be to re-run the study using selected CAPS items for screening. Moreover, future studies should consider using a more conservative criterion for group selection (as well as including a clinical sample).
Conclusion
The present study developed a novel, auditory false perception paradigm based on the SD theory that allows assessing the impact of both the well-established top-down effect of semantic priming and a new bottom-up effect (speech-like noise). The task builds upon similar SD paradigms that, however, focused mostly on how aberrant top-down processing could aid explaining the occurrence of AH. Moreover, the present study employed speech-related frequencies for the first time, while previous studies typically employed white noise, without providing the rationale behind their choice. We found that participants, who were highly prone to AH, showed a more liberal decision bias and poorer perceptual sensitivity, when they expected certain words which were masked with speech-like sounds, as compared to participants, who were less prone to AH. This finding highlights the relevance of examining interactions of top-down and bottom-up processes when studying the mechanisms behind AH and lends further support to interactive models of AH. Due to the small sample size, future replications with healthy individuals are warranted. Along the same vein, future studies could examine clinical and non-clinical populations that actually experience AH to further verify the model by (Waters et al., Citation2012) and/or include additional top-down and bottom-up processes in the SD theory framework, such as emotional states (Laloyaux et al., Citation2019) or stress (Hoskin et al., Citation2014).
Declaration of interest
The authors declare that they have no conflict of interest.
Disclosure statement
No potential conflict of interest was reported by the author(s).
Data availability statement
The data are available from the first author, Julien Laloyaux, [email protected].
Additional information
Funding
Notes on contributors
Julien Laloyaux
Julien Laloyaux is a clinical psychologist and holds a PhD in Psychology from the University of Liège. He is specialized in psychotic symptoms and CBT. He is currently codirector of the psychological consultation center Psyliège in Belgium.
Marco Hirnstein
Marco Hirnstein carried out his PhD in Cognitive Neuroscience at the University of Durham (UK) and the Ruhr-University Bochum (Germany). He is currently Professor in Cognitive Neuroscience at the University of Bergen (Norway) and his main research interests include auditory hallucinations, clinical applications of non-invasive brain stimulation, and hemispheric asymmetries.
Karsten Specht
Karsten Specht holds a PhD in Cognitive Neuroscience from the University of Magdeburg, Germany, and has a professorship at the Department of Biological and Medical, University of Bergen, Norway, with a focus on Cognitive Neuroscience and Neuroimaging. His main research area is the functional and structural segregation of the temporal lobe, with a focus on auditory perception of speech and music but also multisensory integration as well as theory of mind processes. Further, he works on new clinical application of neuroimaging methods.
Anne Giersch
Anne Giersch holds a PhD in Cognitive Neuroscience from the University of Strasbourg, and is research director (professor) at INSERM. Her current interests include cognitive disorders, and especially perceptual and timing disorders in psychosis. She explores the perception of patients using experimental psychology and psychophysics.
Frank Larøi
Frank Larøi holds a PhD in Psychology from the University of Liège and is Professor of Psychology at the Universities of Oslo and Liège. His current research interests include investigating psychosis (and specific symptoms such as hallucinations, delusions, negative symptoms, etc.) with a variety of methodologies.
References
- Alganami, F., Varese, F., Wagstaff, G. F., & Bentall, R. P. (2017). Suggestibility and signal detection performance in hallucination-prone students. Cognitive Neuropsychiatry, 22(2), 159–174. https://doi.org/https://doi.org/10.1080/13546805.2017.1294056
- Barkus, E., Stirling, J., Hopkins, R., McKie, S., & Lewis, S. (2007). Cognitive and neural processes in non-clinical auditoryhallucinations. British Journal of Psychiatry, 191(S51), s76–s81. https://doi.org/https://doi.org/10.1192/bjp.191.51.s76
- Bell, V., Halligan, P. W., & Ellis, H. D. (2006). The cardiff anomalous perceptions scale (CAPS): A new validated measure of anomalous perceptual experience. Schizophrenia Bulletin, 32(2), 366–377. https://doi.org/https://doi.org/10.1093/schbul/sbj014
- Bentall, R. P., & Slade, P. D. (1985). Reality testing and auditory hallucinations: A signal detection analysis. British Journal of Clinical Psychology, 24(Pt 3), 159–169 https://doi.org/https://doi.org/10.1111/j.2044-8260.1985.tb01331.x
- Brookwell, M. L., Bentall, R. P., & Varese, F. (2013). Externalizing biases and hallucinations in source-monitoring, self-monitoring and signal detection studies: A meta-analytic review. Psychological Medicine, 43(12), 2465–2475. https://doi.org/https://doi.org/10.1017/S0033291712002760
- Catalan, A., Simons, C. J. P., Bustamante, S., Drukker, M., Madrazo, A., de Artaza, M. G., Gorostiza, I., van Os, J., & Gonzalez-Torres, M. A. (2014). Novel evidence that attributing affectively salient signal to random noise Is associated with psychosis. PLOS ONE, 9(7), e102520. https://doi.org/https://doi.org/10.1371/journal.pone.0102520
- Chhabra, H., Sowmya, S., Sreeraj, V. S., Kalmady, S. V., Shivakumar, V., Amaresha, A. C., Narayanaswamy, J. C., & Venkatasubramanian, G. (2016). Auditory false perception in schizophrenia: Development and validation of auditory signal detection task. Asian Journal of Psychiatry, 24, 23–27. https://doi.org/https://doi.org/10.1016/j.ajp.2016.08.006
- Daalman, K., Verkooijen, S., Derks, E. M., Aleman, A., & Sommer, I. E. (2012). The influence of semantic top-down processing in auditory verbal hallucinations. Schizophrenia Research, 139(1–3), 82–86. https://doi.org/https://doi.org/10.1016/j.schres.2012.06.005
- Faul, F., Erdfelder, E., Buchner, A., & Lang, A.-G. (2009). Statistical power analyses using G*power 3.1: Tests for correlation and regression analyses. Behavior Research Methods, 41(4), 1149–1160. https://doi.org/https://doi.org/10.3758/BRM.41.4.1149
- Green, D. M., & Swets, J. A. (1966). Signal detection theory and psychophysics. Wiley.
- Hillenbrand, J., Getty, L., Clark, M., & Wheeler, K. (1995). Acoustic characteristics of American English vowels. The Journal of the Acoustical Society of America, 97(5), 3099–3111. https://doi.org/https://doi.org/10.1121/1.411872
- Hoaglin, D. C., & Iglewicz, B. (1987). Fine-Tuning some resistant rules for outlier labeling. Journal of the American Statistical Association, 82(400), 1147–1149. https://doi.org/https://doi.org/10.1080/01621459.1987.10478551
- Hommel, G. (1983). Tests of the overall hypothesis for arbitrary dependence structures. Biomedical Journal, 25(5), 423–430.
- Hommel, G. (1988). A stagewise rejective multiple test procedure based on a modified Bonferroni test. Biometrika, 75(2), 383–386. https://doi.org/https://doi.org/10.1093/biomet/75.2.383
- Hoskin, R., Hunter, M. D., & Woodruff, P. W. (2014). The effect of psychological stress and expectation on auditory perception: A signal detection analysis. British Journal of Psychology, 105(4), 524–546. https://doi.org/https://doi.org/10.1111/bjop.12048
- Laloyaux, J., De Keyser, F., Pinchard, A., Della Libera, C., & Larøi, F. (2019). Testing a model of auditory hallucinations: The role of negative emotions and cognitive resources. Cognitive Neuropsychiatry, 24(4), 256–274. https://doi.org/https://doi.org/10.1080/13546805.2019.1629895
- Larøi, F., & Van der Linden, M. (2005). Nonclinical participants’ reports of hallucinatory experiences. Canadian Journal of Behavioural Science/Revue Canadienne des Sciences du Comportement, 37(1), 33–43. https://doi.org/https://doi.org/10.1037/h0087243
- Launay, G., & Slade, P. (1981). The measurement of hallucinatory predisposition in male and female prisoners. Personality and Individual Differences, 2(3), 221–234. https://doi.org/https://doi.org/10.1016/0191-8869(81)90027-1
- Li, C. S., Chen, M. C., Yang, Y. Y., Chen, M. C., & Tsay, P. K. (2002). Altered performance of schizophrenia patients in an auditory detection and discrimination task: Exploring the ‘self-monitoring’ model of hallucination. Schizophrenia Research, 55(1–2), 115–128. https://doi.org/https://doi.org/10.1016/S0920-9964(01)00203-1
- McCarthy-Jones, S., & Fernyhough, C. (2011). The varieties of inner speech: Links between quality of inner speech and psychopathological variables in a sample of young adults. Consciousness and Cognition, 20(4), 1586–1593. https://doi.org/https://doi.org/10.1016/j.concog.2011.08.005
- Moseley, P., Aleman, A., Allen, P., Bell, V., Bless, J., Bortolon, C., Cella, M., Garrison, J., Hugdahl, K., Kozáková, E., Larøi, F., Moffatt, J., Say, N., Smailes, D., Suzuki, M., Toh, W. L., Woodward, T., Zaytseva, Y., Rossell, S., & Fernyhough, C. (2021). Correlates of hallucinatory experiences in the general population: An international multisite replication study. Psychological Science, 32(7), 1024–1037. https://doi.org/https://doi.org/10.1177/0956797620985832
- Quam, R., Martínez, I., Lorenzo, C., Bonmatí, A., Rosa, M., Jarabo, P., & Arsuaga, J. L. (2012). Studying audition in fossil hominins: A new approach to the evolution of language? In M. K. Jackson (Ed.), Psychology of language (pp. 47–95). Nova Science Publishers.
- Rankin, P. M., & O'Carroll, P. J. (1995). Reality discrimination, reality monitoring and disposition towards hallucination. British Journal of Clinical Psychology, 34(Pt 4), 517–528 https://doi.org/https://doi.org/10.1111/j.2044-8260.1995.tb01486.x
- Stanislaw, H., & Todorov, N. (1999). Calculation of signal detection theory measures. Behavior Research Methods, Instruments, & Computers, 31(1), 137–149. https://doi.org/https://doi.org/10.3758/BF03207704
- Vercammen, A., & Aleman, A. (2010). Semantic expectations can induce false perceptions in hallucination-prone individuals. Schizophrenia Bulletin, 36(1), 151–156. https://doi.org/https://doi.org/10.1093/schbul/sbn063
- Vercammen, A., de Haan, E. H., & Aleman, A. (2008). Hearing a voice in the noise: Auditory hallucinations and speech perception. Psychological Medicine, 38(8), 1177–1184. https://doi.org/https://doi.org/10.1017/S0033291707002437
- Waters, F., Allen, P., Aleman, A., Fernyhough, C., Woodward, T. S., Badcock, J. C., Barkus, E., Johns, L., Varese, F., Menon, M., Vercammen, A., & Larøi, F. (2012). Auditory hallucinations in schizophrenia and nonschizophrenia populations: A review and integrated model of cognitive mechanisms. Schizophrenia Bulletin, 38(4), 683–693. https://doi.org/https://doi.org/10.1093/schbul/sbs045