
ABSTRACT
Introduction
The behavioural phenotype in Turner syndrome (TS) is associated with an uneven cognitive profile and social and executive difficulties. Still, studies in adult populations of TS are scarce, and the interactions between different behavioural domains are unclear. The aim of this study was to examine the cognitive profile in relation to measures of ADHD and ASD in a Swedish sample of 30 adult women with TS.
Methods
Standardized psychological tests and questionnaires were used for behavioural assessments in a sample of adult women with a diagnosis of TS (n = 30). Both frequentist and Bayesian statistics were applied.
Results
The cognitive profile was characterized by a verbal > non-verbal intelligence quotient (IQ) split, and 77% of the sample displayed a split exceeding cut-off for clinical significance. Symptoms on screening measures reaching thresholds for ADHD were reported in two of the 30 participants (7%) and thresholds for autism spectrum disorders (ASD) in one participant (3%). Bayesian statistics gave substantial evidence for no association between the IQ split and symptoms of ADHD/ASD.
Conclusions
These results show that the TS phenotype in adulthood is associated with a clinically significant uneven cognitive profile, and particular impairments in integrative executive functions.
Introduction
Turner syndrome (TS) is one of the most common genetic syndromes with an incidence ranging from 1/1700 to 1/2000 in live female births (Berglund et al., Citation2019; Nielsen & Wohlert, Citation1991). The disorder is caused by a complete or partial loss of one of the two X-chromosomes. Approximately half of the individuals with TS have pure monosomy X (45,X), whereas 15–25% of the karyotypes are mosaic, with one or more additional cell line present together with the 45,X cell line. Mosaic karyotypes might include different combinations of gained and lost sex chromosomes, involving both the X and Y chromosomes, however the most common type of mosaicism is 45,X/46,XX. The remaining ∼25% have structurally altered X-chromosomes in addition to the normal X-chromosome, such as deletions of the short arm of the X-chromosome, ring chromosomes and isochromosomes (Cameron-Pimblett et al., Citation2017; Gravholt et al., Citation2017).
The TS phenotype is heterogeneous and includes a widespread of clinical manifestations. The most common characteristics are short stature and hypergonadotropic hypogonadism (Gravholt et al., Citation2019). Gonadal dysgenesis and variable onset of ovarian dysfunction in TS lead to depletion of sex hormones and thus, primary amenorrhoea and infertility (Ye et al., Citation2020). Despite the variable expressivity in TS, the risk of severe cardiac abnormalities and increased incidence of endocrine, metabolic and autoimmune diseases result in an estimated threefold excess in early mortality compared to the general population (Mortensen et al., Citation2012; Schoemaker et al., Citation2008; Stochholm et al., Citation2006). Studies have shown that mosaicism and other variants of karyotypes can be linked to various pronounced risks for abnormalities or conditions (Bispo et al., Citation2013; Tuke et al., Citation2019). However, it is difficult to compare the characteristics linked to the respective karyotypes, as individuals with mild phenotypes may not even be detected (Tuke et al., Citation2019).
There are also indications that the different karyotypes in TS may affect the phenotype regarding neurodevelopment and cognitive profile. The mosaic karyotype of 45,X/46XX is generally less associated with alterations compared to monosomy 45,X or karyotypes containing unusual types of mosaicism or structural abnormalities (Bispo et al., Citation2013; Tuke et al., Citation2019). For example, some studies indicate that monosomy 45,X may have a more affected cognitive profile compared to mosaic karyotype 45X/46,XX (O’Connor et al., Citation2000; Temple & Carney, Citation1993), while the karyotype containing a ring chromosome appears to be the only one with a significantly increased risk of intellectual disability (Leppig et al., Citation2004).
The cognitive phenotype in TS is characterized by a full-scale intelligence quotient (FSIQ) within the normal range, but the cognitive profile is often uneven with relative strengths in verbal abilities and weaknesses in non-verbal abilities. In standardized IQ tests such as the Wechsler Adult Intelligence Scale (WAIS) (Wechsler, Citation2010), this commonly results in higher verbal IQ (VIQ) than non-verbal IQ (NVIQ), a pattern of results referred to as an IQ split. The term IQ split can be used to express discrepancy between VIQ and NVIQ regardless of direction (Black et al., Citation2009) but in TS, the direction of the discrepancy almost always favours VIQ. Within the cognitive functions encompassed by the term NVIQ, women with TS typically have a disproportionate weakness in visuo-spatial abilities (Hong et al., Citation2009; Hong & Reiss, Citation2014; Temple & Carney, Citation1993).
Although verbal relative to non-verbal IQ split is one of the most commonly reported cognitive alterations in TS, its association with other areas of behavioural impairments remains unclear. IQ split is common in individuals with autism spectrum disorder (ASD), although most frequently in the direction of relatively lower verbal IQ (Johnson et al., Citation2021). Here, reduced social ability has been reported in individuals with IQ split in either direction, although more prominent in the group with high non-verbal combined with low-verbal ability (Black et al., Citation2009). Other studies in ASD have reported that lower VIQ was related to higher levels of ASD symptoms, and that this relation was relatively independent of IQ split or NVIQ (Johnson et al., Citation2021). It is currently not known whether this uneven cognitive profile and social challenges in autism are causally related or co-occurring. For example, visuospatial impairments may lead to face processing alterations which could in turn lead to social difficulties. Alternatively, social difficulties and uneven cognitive profiles may represent different end states of a common process, such as altered brain development.
A recent epidemiological study including a Swedish population-based cohort of 1392 females with TS, reported an increased risk for diagnoses of neurodevelopmental disorders in TS, in comparison to the general female population (Björlin Avdic et al., Citation2021). In studies of children with TS, the prevalence of attention-deficit/hyperactivity disorder (ADHD) has been reported to be around 24% (Green et al., Citation2015; Russell et al., Citation2006), in comparison to 1.8% in girls in the general population (Willcutt, Citation2012). In adult individuals with TS, a large European cross-sectional clinical evaluation study (dsd-LIFE; n = 325, age > 16), reported that 1.7% reached the threshold for a possible ADHD diagnosis based on the Adult ADHD Self-Reporting Rating Scale (ASRS). However, the authors also show that the participants in the cohort reported problems with attention and hyperactivity in 15.8% and 4.9% respectively (de Vries et al., Citation2019). The prevalence of autism spectrum disorders (ASD) has been reported to be up to 3% in children with TS (Creswell & Skuse, Citation1999), in comparison to 0.35% in girls in the general populations (Baird et al., Citation2006). Also, ASD symptoms were assessed in the dsd-LIFE study, and 6.6% of adult women with TS were reported to have Autism Spectrum Quotient (AQ) scores above clinical cut-off (de Vries et al., Citation2019).
Analyses of subtypes of ADHD have shown that the predominantly hyperactive/impulsive subtype is most common in children with TS, relative to girls from the general population for which the combined subtype is most common (Green et al., Citation2015; Russell et al., Citation2006) but it is not known whether this profile of ADHD symptoms is also seen in adult women with TS. In a recent meta-review of children and adolescents with TS, the authors conclude that girls with TS have significant executive impairments, in particular in cognitive flexibility, working memory, planning, problem-solving and inhibitory control (Mauger et al., Citation2018). Still, there are only a few studies investigating ADHD and executive impairments in adult women with TS (de Vries et al., Citation2019; Liedmeier et al., Citation2020).
Impaired social functioning, such as difficulties to establish and maintain relationships with peers, is common in girls and adolescents with TS (McCauley et al., Citation2001), and low self-esteem and less participation in social activities are reported in older adolescence and adulthood (Liedmeier et al., Citation2020). However, even if there is a social withdrawal described in TS, the phenotype is not generally associated with reduced social motivation (Hong et al., Citation2011; Lepage et al., Citation2013). Potential factors that have been proposed to contribute to the social challenges in TS are hearing and visual impairments, which are common features in TS and may be an obstacle to social communication (Hutaff-Lee et al., Citation2019). In addition, visuo-spatial impairments described in women with TS are associated with atypical facial recognition and impaired processing of facial emotional expressions, and thus suggested to contribute to social difficulties in TS (Lawrence et al., Citation2003; Mazzola et al., Citation2006).
The links between cognitive functions and emotional behaviours in TS are known to some extent, and a possible connection between executive dysfunction and social impairments has been discussed (Lepage et al., Citation2013). It has been proposed that increased knowledge in this area is necessary for future development of effective intervention options for TS, still studies on the interactions between behavioural domains are scarce (Hong et al., Citation2009; Hutaff-Lee et al., Citation2019). At least three possible patterns of interactions are plausible. First, elevated ADHD and ASD symptoms and uneven cognitive profiles may be different behavioural expressions of common neurodevelopmental alterations. In this case, positive correlations between these behavioural domains would be expected. Secondly, ADHD or ASD symptoms could be linked to alterations in specific cognitive domains, such as visuospatial or verbal impairments, rather than by the uneven cognitive profile per se. A third possibility is that ADHD and ASD symptoms and uneven cognitive profiles are dissociable areas of impairment in TS, which are not correlated at the individual level. Studies that examine these interrelationships can thus contribute to a better understanding of functional impairments and psychiatric comorbidity of TS.
The aim of the current study was twofold. First, we aimed to replicate previous reports of an uneven cognitive profile and elevated symptoms of ADHD and ASD in a Swedish sample of 30 adult women with TS. Secondly, we examined the relationships between the cognitive profile and measures of ADHD and ASD. For descriptive purposes, the karyotypes from participants were collected.
Material and methods
Participants
The inclusion criteria were a genetically confirmed diagnosis of TS, age >18 years and fluent level of Swedish. Exclusion criteria were acquired brain injuries such as dementia, stroke or brain tumours. The participants were recruited via the Women’s Health Research Unit at Karolinska University Hospital.
Ethics
All participants received oral and written information and gave a written consent before entering the study. The study was approved by the Regional Ethical Review Board in Stockholm (dnr 2014/91, 2018/431-32).
Data collection
The assessments were performed by one clinical psychologist and two trained psychology students at Karolinska University Hospital. During the assessments, the participants were given breaks when needed. The ASRS and the AQ questionnaires were completed by participants at home or during the visit. Information on the specific karyotypes of the participants were retrieved from medical records and clustered into four main groups in order to allow descriptive statistics.
Materials
The Swedish version of WAIS was used to assess general intellectual ability and neuropsychological profiles (Wechsler, Citation2010). The 4th edition, WAIS-IV, is composed of four index scales: Verbal Comprehension Index (VCI), Perceptual Reasoning Index (PRI), Working Memory Index (WMI) and Processing Speed Index (PSI), each of which contributes to derive the FSIQ. The index scales and FSIQ are normally distributed with a mean of 100 and standard deviation (SD) of 15 and the four index scales consist of different core and additional subtests (Wechsler, Citation2010). In the current study, the 10 core subtests were administered. The VCI consists of subtests measuring verbal reasoning and comprehension and was used as an index of VIQ in the current study. The PRI encompasses tests of visuospatial abilities and non-verbal reasoning and was used as a measure of NVIQ. IQ split was calculated as VIQ-NVIQ, so that higher values reflect relative strengths in VIQ. The WMI consists of tests measuring working memory, whereas the PSI measures processing speed in the verbal and visuospatial domains.
The ASRS v.1.1 was used for the assessment of ADHD symptomatology. The scale is the World Health Organization’s 18-item Symptom Checklist of adult ADHD and was created as a screening tool for current ADHD symptoms. Symptoms are rated on a Likert scale; 1–5 (never, rarely, sometimes, often or very often), and the checklist is divided in two parts, Part A consists of 6 questions and Part B of 12 questions. Responses of “often” or “very often” are considered positive in all 18 questions and a response of “sometimes” scores positive in specific questions. Part A (the shorter ASRS self-reported screener) has standardized cut-off scores of ≥4 out of 6 and has been shown to outperform the full scale as a screening tool for ADHD. Part B provides supplementary information on symptoms and makes it possible to compare the two domains of symptoms; inattention and hyperactivity/ impulsivity. The short 6-item version of ASRS predicts a diagnosis of ADHD with a sensitivity of 69%, a specificity of 99.5% and a total classification accuracy of 98% in the general population (Kessler et al., Citation2005, Citation2007). Recent validation of the scale in women in prison, eating disorders, and in different countries (including Sweden), show similar psychometric properties (Brevik et al., Citation2020; Carlucci et al., Citation2017; Konstenius et al., Citation2015). The test-retest reliability has been shown to be high for ASRS (Silverstein et al., Citation2018). In the current study the shorter part A screener and was used to distinguish individuals above the proposed clinical cut-off. The total 18-item scale was used as a measure of continuous ADHD traits in correlational analyses and for comparison with norm data. The norm data were established from a population-based study of >12,000 typical American adult women (Adler et al., Citation2019).
The Adult AQ questionnaire is a self-screening instrument to measure autistic traits in individuals with normal intelligence. The scale consists of 50 items and the results are given as a continuum with scores in the range 0–50 (Baron-Cohen et al., Citation2001). A cut-off score of 26 on the total scale has proven to be useful as a screening measure for ASD (i.e., correctly identifying 83% of patients with ASD, sensitivity 95%, specificity 52%) (Woodbury-Smith et al., Citation2005). In the current study, total AQ scores were used to distinguish individuals above screening criteria cut-off and to examine autistic traits in comparison to norm databased on 1378 typically developed adult women reported in a systematic review by Ruzich et al (Ruzich et al., Citation2015). Initial psychometric evaluations suggested a five-factor structure of the AQ (social skill, attention switching, attention to detail, communication, imagination) (Baron-Cohen et al., Citation2001), but later studies have suggested alternative factor solution (Lau et al., Citation2013). Since norm-data does not exist for specific subscales of the AQ, and its factor structure remains debated, we analysed total AQ scores only. Descriptive statistics of the five-factor subscales are presented in .
Statistical analyses
Descriptive analyses were used to characterize the sample. For comparisons with norm data, one-sample t-tests were performed for the total scores of FSIQ, ASRS and AQ. Cohen’s d was used to calculate effect sizes. To examine strengths and weaknesses on index levels, individual FSIQ and specific index scores were compared and tested for statistical significance using paired samples t-tests. The same analyses were applied to examine the strengths and weaknesses of subscale scores, comparing the scores obtained in each participant’s individual subtest with the participant’s mean average score for all 10 subtests. If paired samples t-tests revealed a significant difference, the index or subtest was deemed either a strength or a weakness. Initial analyses indicated that scores on the PSI and the WAIS-IV subtest Symbol search deviated from the normal distribution (skewness = 1.79, kurtosis = 4.03 and skewness = 1.15 kurtosis = 3.20). All other variables analysed using t-tests were approximately normally distributed, as indicated by skewness and kurtosis values within the +/−3 range. When PSI and Symbol search variables were analysed with non-parametric Wilcoxon tests, results remained unchanged, and parametric tests were therefore used for consistency.
Correlational analyses were conducted to examine relationships between cognitive measures and symptoms of ADHD and ASD. The following cognitive measures were used in the analyses: FSIQ, VIQ (defined as Verbal comprehension index scores, VCI), NVIQ (defined as Perceptual reasoning index scores, PRI) and IQ split (defined as VIQ-NVIQ, i.e., higher values indicate relatively stronger verbal skills). Pearson correlation coefficient was used in these analyses. A power analysis conducted in the R library pwr (Champely et al., Citation2017) showed that the study had 80% power to detect correlations at r = .49 or above and differences from known population means (I.e., effects in one-sample t-tests) at d = 0.52.
Shapiro–Wilk tests of the bivariate residuals in the correlational analyses indicated significant deviations from the normal distributions in the correlations between ASRS and PRI and between AQ and PCI (p < .05), but the results in these tests were unchanged when non-parametric Spearman correlations were used. Deviations from the normal distributions were not found on any of the other variables.
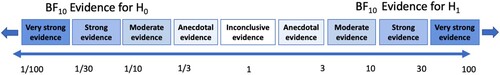
Data were analysed using both conventional frequentist (i.e., null hypothesis testing) and Bayesian statistics further described in . A non-significant result in a traditional statistical analysis based on p-values can never be interpreted as reflecting the degree of support for the null hypothesis, but only as indicating that the null hypothesis could not be rejected and that the results are therefore non-conclusive. In contrast, Bayesian statistics quantify the relative likelihood of the null and the alternative hypothesis and can therefore generate proof for the null hypothesis (Wagenmakers, Citation2007). The main strengths of Bayesian as compared to frequentist statistics, are that it is less vulnerable to type I errors, and that it allows conclusions that the null hypothesis fits the data best. The default settings in SPSS for priors were used for the Bayesian calculations, i.e., uninformative priors were made. As the same statistical assumptions of data distribution apply to Bayesian and frequentist statistics (e.g., normally distributed residuals), no additional assumption checks were made.
Figure 1. The Bayes factors (BF10) quantify the relative probability of the alternative hypothesis vs the null hypothesis (Wagenmakers, Citation2007).
The significance level was set to 5% for all analyses (α = 0.05) and two-tailed p-values are reported. Significance thresholds were adjusted for multiple comparisons using the Bonferroni correction. Analyses were conducted using SPSS version 25, USA, Armonk (IBMCorp Ibm, Citation2017) and JASP (Team, Citation2020). Study data were collected and managed using REDCap electronic data capture tools hosted at Karolinska Institutet (Harris, Citation2019; Harris et al., Citation2009).
Results
Participants
Initially, 31 women were recruited but one of the participants was excluded due to a previous severe medical incident, and the final sample was n = 30. The mean age was 41.1 years (range from 18 to 75 years). The education level in the sample ranged from completed elementary school level, to master’s degree (second-cycle academic degree). For descriptive purposes, available karyotypes from the participants were collected (n = 27). The different karyotypes of the study sample were clustered into four main groups; “monosomy 45,X” (n = 13), “mosaicism 45,X/46,XX” (n = 5), and “other” (n = 9), or “unknown” (no further information of the karyotype than confirmed TS) (n = 3). The group “other” was created to not omit individual karyotypes and consisted of karyotypes with structural abnormalities or mosaicism other than 45,X/46,XX (see ).
Table 1. Descriptive data for the total sample (n = 30) and grouped karyotypes (age, mean scores of AQ, ASRS, WAIS).
Cognitive profiles
The cognitive profile was characterized by a close-to-normal average FSIQ, see . A normative comparison showed a significant difference between the population mean and the TS sample (t(29) = −2.59, p = .015, d = .47), meaning the study sample has on average a lower FSIQ score in comparison to the general population. Further analyses showed that the TS group had lower NVIQ (M = 90.37, SD = 13.96, t(29) = 3.31, p = .002) but higher VIQ ((M = 107.60, SD = 12.57, t(29) = 3.31, p = .002) t(29) = −3.78, p < .00 < .001) than population norms.
Differences between index scales and between index scales and FSIQ are shown in . Analyses of strengths and weaknesses showed elevated scores within VCI and decreased scores within PRI, WMI and PSI. Based on the WAIS-IV manual (Wechsler, Citation2010), a clinically significant discrepancy between the different index scales was defined as an absolute difference between two scales occurring in ≤15% of the normative sample (Wechsler, Citation2010). The percentage of participants that showed a clinically significant discrepancy between verbal IQ (VCI) and any of the other indexes (PRI, WMI and PSI); was 77% (). Higher VCI relative to PRI scores (i.e., an IQ split) were seen in 27/30 individuals (90%), a difference that exceeded the threshold for clinical significance in 57% of cases. There were no significant correlations between FSIQ and IQ split (r(28) = −.087, p = .648), hence the magnitude of IQ split did not differ due to the individual’s FSIQ level.
Figure 2. Percentage of the sample with a verbal > non-verbal IQ split.
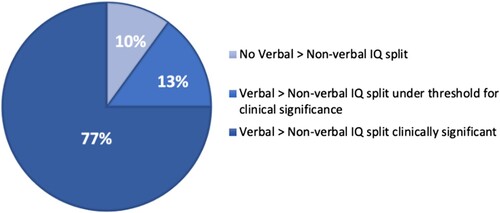
Table 2. Within-subject discrepancies between index scores in WAIS-IV.
Further, analyses of subtests from WAIS-IV revealed that all three VCI subtest scores were relatively high (i.e., Similarities, Vocabulary, Information), all remaining subtests showed relatively low scores, except for Arithmetic and Matrix Reasoning, which showed average scores. The means and SD:s of these discrepancies are shown in .
Table 3. Comparisons between WAIS-IV mean subscale scores and mean values of all 10 subscales.
Symptoms of ADHD and ASD
ADHD
Two of the 30 participants presented with ADHD symptoms over cut-off for clinical significance (7%) on the ASRS-A, and the mean total score of the full 18-items ASRS was 3.07 (SD = 2.95), ranging from 0 to 11, in the sample (). The mean of the current sample was compared to the reported mean of 2.1 (SD = 3.2) in a population-based study of >12 000 typical American adult women (Adler et al., Citation2019). A one-sample t-test showed no significant difference between the mean of the current sample and the population mean (t(29) = −1.80, p = 0.996, d = .32), and the probability of the null hypothesis to occur over the alternative hypothesis was BF10 = 0.81, i.e., the result was inconclusive. When analysing symptom domains of ADHD, 77% of participants had dominating scores in the inattention domain of ASRS (M = 12.23, SD = 4.86), and there was a significant difference in comparison to the scores of the hyperactivity/impulsivity domain ((M = 8.8, SD = 4.9), t(29) = 3.97, p = 0.012).
ASD
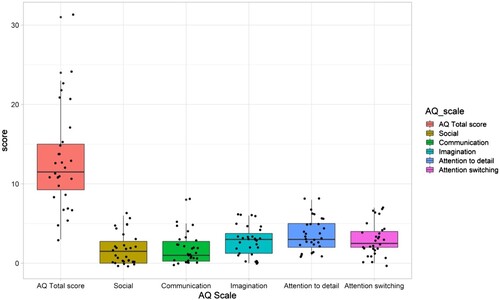
Based on the self-reported AQ results, one of the 30 participants (3%) scored above the screening threshold for likely ASD diagnosis. The average total score for AQ was 13.2 (SD = 6.4), ranging from 3 to 31 (). The mean score of the current sample was compared to the reported population mean of 14.88 (SD ranging from 4.2 to 8.0) (Ruzich et al., Citation2015). One-sample t-test showed no significant difference between the means; t(29) = −1.47, p = >0.99, d = .27. The probability of the null hypothesis to occur over the alternative hypothesis was BF10 = 0.51, i.e., the results were inconclusive. Data from the total AQ and subscales of the tests are shown in . Note that, as no norm data exists from the subscales, no statistical comparisons to the population mean were conducted.
Figure 3. Total AQ scores and results from AQ subscales. Boxes cover the 25–75th percentile. Individual data points are shown by black dots.
Correlation of IQ split and total mean scores of AQ and ASRS
There was no correlation between the verbal > non-verbal IQ split (i.e., VCI/PRI discrepancy), and AQ score (r(28) = .247, p = >0.99), BF10 = 0.33 (i.e., moderate support for the null hypothesis). Similarly, there was no correlation between the VCI/PRI discrepancy and ASRS score (r(28) = .132, p = >0.99), BF10 = 0.17 (i.e., moderate support for the null hypothesis).
Analyses of verbal IQ (VCI) and total scores of AQ (r(28) = .148, p = >0.99) and ASRS (r(28) = .323, p = 0.82) showed no significant correlation, neither did non-verbal IQ (PRI) in relation to total scores of AQ (r(28) = . −0.088, p = >0.99) and ASRS (r(28) = .181, p = >0.99). Finally, there was no correlation between AQ and ASRS scores (r(28) = 0.297, p = >0.99), though with BF10 = 0.50 (i.e., the results were inconclusive). Excluding potential outliers did not change the significance of the results.
Descriptive data related to Karyotype
For descriptive purposes, all available karyotypes from the participants were collected (n = 27), . Due to the small sample size, no statistical test for group comparisons was applicable but data are illustrated in –.
Figure 4. FSIQ and WAIS-IV index scores in the full sample (n = 30) and in the sample clustered grouped by karyotype. Mon. = monosomy 45,X (n = 13), mos. = mosaicism 45,X/46,XX (n = 5), other* (n = 9), unknown (n = 3). Boxes cover the 25–75th percentile. Black lines show medians. Red diamonds show group means. Individual data points are shown by black dots. *The group “other” was created to not omit individual karyotypes and consisted of karyotypes with structural abnormalities or mosaicism other than 45,X/46,XX.
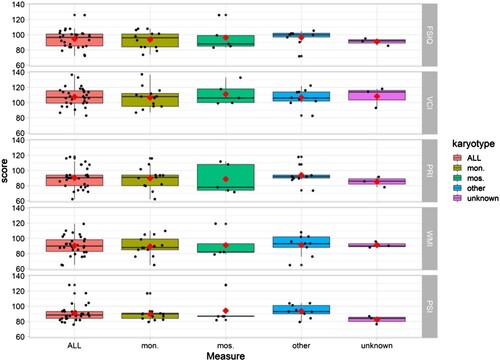
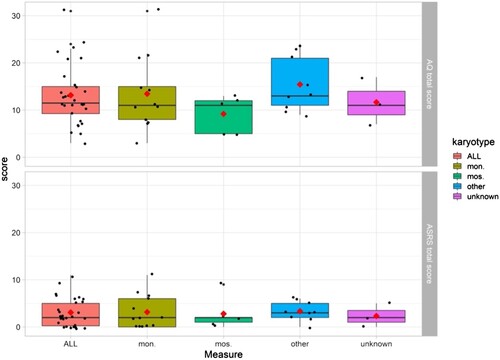
Figure 5. AQ and ASRS scores in the full sample (n = 30) and in the sample clustered grouped by karyotype. Mon. = monosomy 45,X (n = 13), mos. = mosaicism 45,X/46,XX (n = 5), other* (n = 9), unknown (n = 3). Boxes cover the 25–75th percentile. Black lines show medians. Red diamonds show group means. Individual data points are shown by black dots. *The group “other” was created to not omit individual karyotypes and consisted of karyotypes with structural abnormalities or mosaicism other than 45,X/46,XX.
Discussion
The current study contributes to the delineation of the cognitive profile in TS in several ways. It corroborates the cognitive profile of adult women with TS and shows that 77% have clinically significant verbal > non-verbal IQ split. This replicates previous studies from the past decades showing verbal strengths and non-verbal weaknesses associated with TS (Hong et al., Citation2009; Temple & Carney, Citation1993). Some previous studies have examined the prevalence of ADHD and ASD in paediatric samples with TS (Creswell & Skuse, Citation1999; Green et al., Citation2015; Russell et al., Citation2006), but there are only a few studies focusing on ADHD and ASD in adult women with TS (de Vries et al., Citation2019; Liedmeier et al., Citation2020). Here, 2/30 (7%) participants reached the screening cut-off for ADHD, which can be compared to 2.5–3.5 of adult women in the general population (Polyzoi et al., Citation2018; Simon et al., Citation2009).
Although, the ASRS mean score in our sample was not significantly higher than the mean reported in the Adler study based on >12,000 women that we used as norm data (Adler et al., Citation2019), the Bayesian statistics did not give support for neither the alternative, nor the null hypothesis, hence the results were inconclusive. Regarding ASD symptoms, one of the participants (3%) met the screening cut-off for ASD. The average AQ total score in our sample did not differ significantly from mean of norm data (Ruzich et al., Citation2015), and again based on the Bayesian statistics, the results were inconclusive.
Based on the dsd-LIFE cohort, de Vries et al. and Liedmeier et al. respectively describe a partly overlapping sample of 325 and 301 adult women with TS. They used the ASRS and a shorter 10-items version of AQ for the assessment of ADHD and ASD. In comparison to the current study, they reported a relatively low percentage above cut-off for ADHD (1.7%), and a relatively high percentage of ASD (6.6%) (de Vries et al., Citation2019). Further, they made normative comparisons of the mean scores of ASRS and AQ and found it to be significantly elevated in comparison to the general population mean (Liedmeier et al., Citation2020). The divergent results between the current study and the dsd-LIFE studies might be due to methodological differences. In the current study, in-person testing including an IQ-test was done, in comparison to more accessible online-questionnaires in the dsd-LIFE study. The in-person testing of IQ might induce a risk that more intellectually challenged individuals chose to not participate, i.e., a selection bias.
The cognitive profile in the present sample of Turner females is characterized by a FSIQ within the normal range, and the verbal IQ (VIQ) > non-verbal IQ (NVIQ) IQ split is unrelated to FSIQ. When narrowing down the analyses to specific cognitive subtests, the subscales Vocabulary and Similarities showed to be strengths, supporting previous findings on the relatively heightened word comprehension skills associated with TS (Temple & Carney, Citation1993). Within the area of Perceptual Reasoning, one of the three subtests (Block Design) scores were identified as a weakness (i.e., significantly lower than the individuals’ mean score).
Further, the Processing Speed subtest Symbol Search and the Perceptual Reasoning subtest Block design were identified as weaknesses, tasks that require several cognitive domains to function simultaneously, indicating impairments in integrative executive functions. This inference is supported by the self-reported impairments in the inattentive domains in ASRS. Although there are studies showing an increased risk of neurodevelopmental disorders such as ADHD (Green et al., Citation2015; Russell et al., Citation2006) and ASD associated with TS (Björlin Avdic et al., Citation2021; Creswell & Skuse, Citation1999), there is a large variability within the group. Previous studies based on children and adolescents with TS, show a dominance in the hyperactive/impulsive domain of ADHD symptoms (Green et al., Citation2015; Russell et al., Citation2006), whereas our results, based on an adult sample, show dominating difficulties in the domain of inattentive symptoms. These results suggest that there is a shift from more hyperactive/impulsive symptoms in children with TS, to more prominent inattentive symptoms in adults with TS, similar to the development of ADHD symptoms between childhood and adulthood in the general population (Martel et al., Citation2012).
Finally, we examined the associations between cognitive profiles and traits of ADHD and ASD. Bayesian statistics gave substantial evidence for the null hypothesis, that there are indeed no associations between verbal > non-verbal IQ split and ASD/ADHD traits in TS. These results indicate that the impairments studied here are not clustered in the sense that an increase in discrepancy in the cognitive profile also increases the risk of social or executive deficits, as has been shown in samples of individuals with ASD without intellectual disability (i.e., a link between IQ split and social impairments) (Black et al., Citation2009; Johnson et al., Citation2021). However, more studies replicating these findings are needed, and a future research priority should be to identify predictors for the social and executive challenges in TS.
In the current study, self-rated screening instruments were used for the assessment of ADHD and ASD traits. Previous studies show that cognitive impairments, as well as aspects of personality, and emotional comprehension, might be influencing factors when conducting self-screening or assessments, something we could not control for in this study (Austin, Citation2005; Murphy, Citation2011). Younger individuals with TS have shown a tendency to underestimate their own social difficulties in comparison to the ratings of their parents (Hong et al., Citation2011) whilst clinical reports indicate an overestimation of their social skills (Wolstencroft et al., Citation2020). An interesting question for future studies is therefore to directly compare self-ratings of ADHD traits by women with TS to ratings made by family or partners.
Previous studies suggest that the TS phenotype varies with karyotype and is a result of haploinsufficiency of genes on the X-chromosome (Bispo et al., Citation2013) as well as transcriptional and epigenetic factors (Viuff et al., Citation2019). Individuals with TS, caused by 45,X/46,XX mosaicism, generally have a milder phenotype with higher IQ score, and lower incidence of neurodevelopmental impairments compared to women with monosomy 45,X karyotype. In the current study, visual inspection of the data did not indicate that the verbal > non-verbal IQ difference was smaller in the mosaic karyotype than in the monosomy group. However, interpretation and comparison based on karyotype in our study was only done through visual inspection of the data due to the small sample size, and no statistical test was applicable.
The verbal > non-verbal IQ split might have several implications, from adaptive functioning in the individual to clinical guidelines for neuropsychological testing (Wechsler, Citation2010). However, in various disorders including ASD and ADHD, uneven cognitive profiles are common. In individuals with ASD without intellectual disability, a verbal < non-verbal IQ split is common (Black et al., Citation2009; Johnson et al., Citation2021), and in ADHD, significant weaknesses in working memory and information processing are typical (Seidman, Citation2006). Interestingly, when comparing neuropsychological profiles of TS with profiles of other sex aneuploidies with additional X or Y such as the Klinefelter (XXY) and XYY-syndrome, the profiles appear almost reversed. Whilst the cognitive profile in TS is characterized by verbal > non-verbal IQ split, the Klinefelter and XYY-syndrome are typically presenting a verbal < non-verbal IQ split. This suggests that sex aneuploidies have an effect on cognitive abilities, but that the number of sex chromosomes, monosomy or polysomy, have an effect on different strengths and/ or weaknesses in the cognitive profile (Hong & Reiss, Citation2014).
Limitations
In this study, there are some limitations that need to be considered. The results might be limited by the small sample size which also did not allow for statistical comparisons between subgroups based on karyotypes, absence of a control group and a potential selection bias, i.e., that more high-functioning individuals might be more likely to agree to participate in a study like this. Searching study participants including tasks that can be perceived as mentally strenuous, poses the risk of excluding a group of individuals who have previous experience of finding similar tasks challenging, i.e., in line with the well-known concept of “healthy volunteers”.
Further, screening tools such as ASRS and AQ, are per definition effective in detecting symptoms (sensitivity) but have lower specificity. Although validated screening measures were used, we did not compare the results to medical records. We did neither collect information about ongoing medication. An additional limitation is that, due to the lack of national Swedish norm data for the ASRS and AQ, data from English-speaking countries were used. However, as noted by Ruzich et al. (Citation2015), international translations of the AQ tend to show similar distributions of scores as the original version.
Conclusion
In this study, neuropsychological testing was combined with self-reports and Bayesian statistics, to characterize specific behavioural phenotypes in an adult sample of women with TS. Our results resemble previous research on cognitive profiles in TS, with a general intellectual ability within the normal range, and a verbal > non-verbal IQ split, highlighting the percentage of adult women with an IQ split exceeding clinical significance. In contrast to our a priori hypothesis, we show substantial evidence for no association between the verbal > non-verbal IQ split and ADHD/ASD traits in TS.
Author contributions
A.L.H, A.N., C.W. and H.B.A. designed the study. M.V.P., A.L.H. and AN, contributed to patient recruitment and acquisition of data, and C.W., M.H. and M.S. performed the clinical assessments. C.W., J.L.K conducted the statistical analysis, and C.W., H.B.A., A.N. and J.L.K. contributed to the analyses and interpretation of the results. C.W., J.L.K and H.B.A. were the major contributors in writing the manuscript. All authors contributed to the writing of the manuscript, read and approved the final version.
Ethical approval and consent to participate
The Swedish Ethical Review Authority approved the study (main application dnr 2014/91; and amendment: dnr 2018/431-32), which followed the tenets of the Declaration of Helsinki. Written informed consent was obtained from all participants.
Acknowledgements
We would like to thank all participants for their contribution to the study. We also thank Carina Levelind at the Stockholm Turner center for her help with the data collection. Three of the authors of this publication are members of the European Reference Network on Rare Congenital Malformations and Rare Intellectual Disability ERN-ITHACA [EU Framework Partnership Agreement ID: 3HP-HP-FPA ERN-01-2016/739516].
Disclosure statement
No potential conflict of interest was reported by the author(s).
Data availability
The data that support the findings of this study are available from the corresponding author, H.B.A., upon reasonable request.
Additional information
Funding
References
- Adler, L. A., Faraone, S. V., Sarocco, P., Atkins, N., & Khachatryan, A. (2019). Establishing US norms for the Adult ADHD Self-Report Scale (ASRS-v1. 1) and characterising symptom burden among adults with self-reported ADHD. International Journal of Clinical Practice, 73(1), e13260. https://doi.org/10.1111/ijcp.13260
- Austin, E. J. (2005). Personality correlates of the broader autism phenotype as assessed by the Autism Spectrum Quotient (AQ). Personality and Individual Differences, 38(2), 451–460.
- Baird, G., Simonoff, E., Pickles, A., Chandler, S., Loucas, T., Meldrum, D., & Charman, T. (2006). Prevalence of disorders of the autism spectrum in a population cohort of children in South Thames: The Special Needs and Autism Project (SNAP). The Lancet, 368(9531), 210–215. https://doi.org/10.1016/S0140-6736(06)69041-7
- Baron-Cohen, S., Wheelwright, S., Skinner, R., Martin, J., & Clubley, E. (2001). The autism-spectrum quotient (AQ): Evidence from Asperger syndrome/high-functioning autism, males and females, scientists and mathematicians. Journal of Autism and Developmental Disorders, 31(1), 5–17. https://doi.org/10.1023/A:1005653411471
- Berglund, A., Viuff, M. H., Skakkebæk, A., Chang, S., Stochholm, K., & Gravholt, C. H. (2019). Changes in the cohort composition of Turner syndrome and severe non-diagnosis of Klinefelter, 47,XXX and 47,XYY syndrome: A nationwide cohort study. Orphanet Journal of Rare Diseases, 14(1), 16. https://doi.org/10.1186/s13023-018-0976-2
- Bispo, A. V. S., dos Santos, L. O., Buregio-Frota, P., Galdino, M. B., Duarte, A. R., Leal, G. F., Araujo, J., Gomes, B., Soares-Ventura, E. M., Muniz, M. T. C., & Santos, N. (2013). Effect of chromosome constitution variations on the expression of Turner phenotype [Article]. Genetics and Molecular Research, 12(4), 4243–4250. https://doi.org/10.4238/2013.March.13.13
- Björlin Avdic, H., Butwicka, A., Nordenström, A., Almqvist, C., Nordenskjöld, A., Engberg, H., & Frisén, L. (2021). Neurodevelopmental and psychiatric disorders in females with Turner syndrome: A population-based study. Journal of Neurodevelopmental Disorders, 13(1), 51. https://doi.org/10.1186/s11689-021-09399-6
- Black, D. O., Wallace, G. L., Sokoloff, J. L., & Kenworthy, L. (2009). Brief report: IQ split predicts social symptoms and communication abilities in high-functioning children with autism spectrum disorders. Journal of Autism and Developmental Disorders, 39(11), 1613–1619. https://doi.org/10.1007/s10803-009-0795-3
- Brevik, E. J., Lundervold, A. J., Haavik, J., & Posserud, M. B. (2020). Validity and accuracy of the adult attention-deficit/hyperactivity disorder (ADHD) self-report scale (ASRS) and the Wender Utah rating scale (WURS) symptom checklists in discriminating between adults with and without ADHD. Brain and Behavior, 10(6), e01605. https://doi.org/10.1002/brb3.1605
- Cameron-Pimblett, A., La Rosa, C., King, T. F. J., Davies, M. C., & Conway, G. S. (2017). The Turner syndrome life course project: Karyotype-phenotype analyses across the lifespan. Clinical Endocrinology, 87(5), 532–538. https://doi.org/10.1111/cen.13394
- Carlucci, S., Ivanova, I., Bissada, H., & Tasca, G. A. (2017). Validity and reliability of the attention deficit hyperactivity disorder self-report scale (ASRS-v1. 1) in a clinical sample with eating disorders. Eating Behaviors, 26, 148–154. https://doi.org/10.1016/j.eatbeh.2017.03.010
- Champely, S., Ekstrom, C., Dalgaard, P., Gill, J., Weibelzahl, S., Anandkumar, A., Ford, C., Volcic, R., & De Rosario, H. (2017). pwr: Basic functions for power analysis.
- Creswell, C. S., & Skuse, D. H. (1999). Autism in association with Turner syndrome: Genetic implications for male vulnerability to pervasive developmental disorders. Neurocase, 5(6), 511–518. https://doi.org/10.1080/13554799908402746
- de Vries, A. L. C., Roehle, R., Marshall, L., Frisén, L., van de Grift, T. C., Kreukels, B. P. C., Bouvattier, C., Köhler, B., Thyen, U., Nordenström, A., Rapp, M., & Cohen-Kettenis, P. T. (2019). Mental health of a large group of adults with disorders of sex development in Six European countries. Psychosomatic Medicine, 81(7), 629–640. https://doi.org/10.1097/PSY.0000000000000718
- Gravholt, C. H., Andersen, N. H., Conway, G. S., Dekkers, O. M., Geffner, M. E., Klein, K. O., Lin, A. E., Mauras, N., Quigley, C. A., Rubin, K., Sandberg, D. E., Sas, T. C. J., Silberbach, M., Söderström-Anttila, V., Stochholm, K., van Alfen-van derVelden, J. A., Woelfle, J., & Backeljauw, P. F. (2017). Clinical practice guidelines for the care of girls and women with Turner syndrome: Proceedings from the 2016 Cincinnati International Turner Syndrome meeting. European Journal of Endocrinology, 177(3), G1–G70. https://doi.org/10.1530/eje-17-0430
- Gravholt, C. H., Viuff, M. H., Brun, S., Stochholm, K., & Andersen, N. H. (2019). Turner syndrome: Mechanisms and management. Nature Reviews Endocrinology, 15(10), 601–614. https://doi.org/10.1038/s41574-019-0224-4
- Green, T., Bade Shrestha, S., Chromik, L. C., Rutledge, K., Pennington, B. F., Hong, D. S., & Reiss, A. L. (2015). Elucidating X chromosome influences on Attention Deficit Hyperactivity Disorder and executive function. Journal of Psychiatric Research, 68, 217–225. https://doi.org/10.1016/j.jpsychires.2015.06.021
- Harris, J. C. (2019). Behavioral phenotypes in developmental neuropsychiatric disorders: Disrupted epigenetics, microdeletions, sex chromosome aneuploidies, and gestational alcohol toxicity [Editorial Material]. Current Opinion in Psychiatry, 32(2), 51–54. https://doi.org/10.1097/YCO.0000000000000483
- Harris, P. A., Taylor, R., Thielke, R., Payne, J., Gonzalez, N., & Conde, J. G. (2009). Research electronic data capture (REDCap)—a metadata-driven methodology and workflow process for providing translational research informatics support. Journal of Biomedical Informatics, 42(2), 377–381. https://doi.org/10.1016/j.jbi.2008.08.010
- Hong, D., Scaletta Kent, J., & Kesler, S. (2009). Cognitive profile of Turner syndrome. Developmental Disabilities Research Reviews, 15(4), 270–278. https://doi.org/10.1002/ddrr.79. https://onlinelibrary.wiley.com/doi/abs/10.1111j.1469-8749.1993.tb11714.x?sid=nlm%3Apubmed
- Hong, D. S., Dunkin, B., & Reiss, A. L. (2011). Psychosocial functioning and social cognitive processing in girls with Turner syndrome [Article]. Journal of Developmental and Behavioral Pediatrics, 32(7), 512–520. https://doi.org/10.1097/DBP.0b013e3182255301
- Hong, D. S., & Reiss, A. L. (2014). Cognitive and neurological aspects of sex chromosome aneuploidies. The Lancet Neurology, 13(3), 306–318. https://doi.org/10.1016/S1474-4422(13)70302-8
- Hutaff-Lee, C., Bennett, E., Howell, S., & Tartaglia, N. (2019). Clinical developmental, neuropsychological, and social-emotional features of Turner syndrome. American Journal of Medical Genetics Part C-Seminars in Medical Genetics, 181(1), 126–134. https://doi.org/10.1002/ajmg.c.31687
- IBMCorp Ibm, S. (2017). Statistics for Windows, version 25.0. IBM Corp.
- Johnson, C. N., Ramphal, B., Koe, E., Raudales, A., Goldsmith, J., & Margolis, A. E. (2021). Cognitive correlates of autism spectrum disorder symptoms. Autism Research, 14(11), 2405–2411. https://doi.org/10.1002/aur.2577
- Kessler, R. C., Adler, L., Ames, M., Demler, O., Faraone, S., Hiripi, E., Howes, M. J., Jin, R., Secnik, K., & Spencer, T. (2005). The World Health Organization Adult ADHD Self-Report Scale (ASRS): A short screening scale for use in the general population. Psychological Medicine, 35(2), 245–256. https://doi.org/10.1017/S0033291704002892
- Kessler, R. C., Adler, L. A., Gruber, M. J., Sarawate, C. A., Spencer, T., & Van Brunt, D. L. (2007). Validity of the World Health Organization Adult ADHD Self-Report Scale (ASRS) Screener in a representative sample of health plan members. International Journal of Methods in Psychiatric Research, 16(2), 52–65. https://doi.org/10.1002/mpr.208
- Konstenius, M., Larsson, H., Lundholm, L., Philips, B., van de Glind, G., Jayaram-Lindström, N., & Franck, J. (2015). An epidemiological study of ADHD, substance use, and comorbid problems in incarcerated women in Sweden. Journal of Attention Disorders, 19(1), 44–52. https://doi.org/10.1177/1087054712451126
- Lau, W. Y. P., Kelly, A. B., & Peterson, C. C. (2013). Further evidence on the factorial structure of the Autism Spectrum Quotient (AQ) for adults with and without a clinical diagnosis of autism. Journal of Autism and Developmental Disorders, 43(12), 2807–2815. https://doi.org/10.1007/s10803-013-1827-6
- Lawrence, K., Kuntsi, J., Coleman, M., Campbell, R., & Skuse, D. (2003). Face and emotion recognition deficits in Turner syndrome: A possible role for X-linked genes in amygdala development. Neuropsychology, 17(1), 39–49. https://www.ncbi.nlm.nih.gov/pubmed/12597072 https://doi.org/10.1037/0894-4105.17.1.39
- Lepage, J. F., Dunkin, B., Hong, D. S., & Reiss, A. L. (2013). Impact of cognitive profile on social functioning in prepubescent females with Turner syndrome. Child Neuropsychology, 19(2), 161–172. https://doi.org/10.1080/09297049.2011.647900
- Leppig, K. A., Sybert, V. P., Ross, J. L., Cunniff, C., Trejo, T., Raskind, W. H., & Disteche, C. M. (2004). Phenotype and X inactivation in 45,X/46,X,r(X) cases. American Journal of Medical Genetics Part A, 128A(3), 276–284. https://doi.org/10.1002/ajmg.a.30002
- Liedmeier, A., Jendryczko, D., van der Grinten, H. C., Rapp, M., Thyen, U., Pienkowski, C., Hinz, A., & Reisch, N. (2020). Psychosocial well-being and quality of life in women with Turner syndrome. Psychoneuroendocrinology, 113, 104548. https://doi.org/10.1016/j.psyneuen.2019.104548
- Martel, M. M., Von Eye, A., & Nigg, J. (2012). Developmental differences in structure of attention-deficit/hyperactivity disorder (ADHD) between childhood and adulthood. International Journal of Behavioral Development, 36(4), 279–292. https://doi.org/10.1177/0165025412444077
- Mauger, C., Lancelot, C., Roy, A., Coutant, R., Cantisano, N., & Le Gall, D. (2018). Executive functions in children and adolescents with Turner syndrome: A systematic review and meta-analysis. Neuropsychology Review, 28(2), 188–215. https://doi.org/10.1007/s11065-018-9372-x
- Mazzola, F., Seigal, A., MacAskill, A., Corden, B., Lawrence, K., & Skuse, D. H. (2006). Eye tracking and fear recognition deficits in Turner syndrome. Social Neuroscience, 1(3–4), 259–269. https://doi.org/10.1080/17470910600989912
- McCauley, E., Feuillan, P., Kushner, H., & Ross, J. L. (2001). Psychosocial development in adolescents with Turner syndrome. Journal of Developmental & Behavioral Pediatrics, 22(6), 360–365. https://doi.org/10.1097/00004703-200112000-00003
- Mortensen, K. H., Andersen, N. H., & Gravholt, C. H. (2012). Cardiovascular phenotype in Turner syndrome—integrating cardiology, genetics, and endocrinology. Endocrine Reviews, 33(5), 677–714. https://doi.org/10.1210/er.2011-1059
- Murphy, D. (2011). Autism spectrum quotient (AQ) profiles among male patients within high security psychiatric care: Comparison with personality and cognitive functioning. The Journal of Forensic Psychiatry and Psychology, 22(4), 518–534.
- Nielsen, J., & Wohlert, M. (1991). Chromosome abnormalities found among 34,910 newborn children: Results from a 13-year incidence study in Arhus, Denmark. Human Genetics, 87(1), 81–83. https://doi.org/10.1007/BF01213097
- O’Connor, J., Fitzgerald, M., & Hoey, H. (2000). The relationship between karyotype and cognitive functioning in Turner syndrome. Irish Journal of Psychological Medicine, 17(3), 82–85. https://doi.org/10.1017/S0790966700005826
- Polyzoi, M., Ahnemark, E., Medin, E., & Ginsberg, Y. (2018). Estimated prevalence and incidence of diagnosed ADHD and health care utilization in adults in Sweden—a longitudinal population-based register study. Neuropsychiatric disease and treatment, 1149–1161. doi:10.2147/NDT.S155838
- Russell, H. F., Wallis, D., Mazzocco, M. M., Moshang, T., Zackai, E., Zinn, A. R., Ross, J. L., & Muenke, M. (2006). Increased prevalence of ADHD in Turner syndrome with no evidence of imprinting effects. Journal of Pediatric Psychology, 31(9), 945–955. https://doi.org/10.1093/jpepsy/jsj106
- Ruzich, E., Allison, C., Smith, P., Watson, P., Auyeung, B., Ring, H., & Baron-Cohen, S. (2015). Measuring autistic traits in the general population: A systematic review of the Autism-Spectrum Quotient (AQ) in a nonclinical population sample of 6,900 typical adult males and females. Molecular Autism, 6(1), 1–12. https://doi.org/10.1186/2040-2392-6-1
- Schoemaker, M. J., Swerdlow, A. J., Higgins, C. D., Wright, A. F., & Jacobs, P. A. (2008). Mortality in women with Turner syndrome in Great Britain: A national cohort study. The Journal of Clinical Endocrinology & Metabolism, 93(12), 4735–4742. https://doi.org/10.1210/jc.2008-1049
- Seidman, L. J. (2006). Neuropsychological functioning in people with ADHD across the lifespan. Clinical Psychology Review, 26(4), 466–485.
- Silverstein, M. J., Alperin, S., Faraone, S. V., Kessler, R. C., & Adler, L. A. (2018). Test–retest reliability of the adult ADHD Self-Report Scale (ASRS) v1. 1 Screener in non-ADHD controls from a primary care physician practice. Family Practice, 35(3), 336–341. https://doi.org/10.1093/fampra/cmx115
- Simon, V., Czobor, P., Bálint, S., Mészáros, A., & Bitter, I. (2009). Prevalence and correlates of adult attention-deficit hyperactivity disorder: meta-analysis. British Journal of Psychiatry, 194(3), 204–211. https://doi.org/10.1192/bjp.bp.107.048827
- Stochholm, K., Juul, S., Juel, K., Naeraa, R. W., & Højbjerg Gravholt, C. (2006). Prevalence, incidence, diagnostic delay, and mortality in Turner syndrome. The Journal of Clinical Endocrinology & Metabolism, 91(10), 3897–3902. https://doi.org/10.1210/jc.2006-0558
- Team, J. (2020). JASP (Version 0.14. 1). Computer Software.
- Temple, C. M., & Carney, R. A. (1993). Intellectual functioning of children with Turner syndrome: A comparison of behavioural phenotypes. Developmental Medicine & Child Neurology, 35(8), 691–698. https://www.ncbi.nlm.nih.gov/pubmed/7687571 https://doi.org/10.1111/j.1469-8749.1993.tb11714.x
- Tuke, M. A., Ruth, K. S., Wood, A. R., Beaumont, R. N., Tyrrell, J., Jones, S. E., Yaghootkar, H., Turner, C. L. S., Donohoe, M. E., Brooke, A. M., Collinson, M. N., Freathy, R. M., Weedon, M. N., Frayling, T. M., & Murray, A. (2019). Mosaic Turner syndrome shows reduced penetrance in an adult population study. Genetics in Medicine, 21(4), 877–886. https://doi.org/10.1038/s41436-018-0271-6
- Viuff, M., Skakkebæk, A., Nielsen, M. M., Chang, S., & Gravholt, C. H. (2019). Epigenetics and genomics in Turner syndrome. American Journal of Medical Genetics Part C: Seminars in Medical Genetics, 181(1), 68–75. https://doi.org/10.1002/ajmg.c.31683.
- Wagenmakers, E.-J. (2007). A practical solution to the pervasive problems of p values. Psychonomic Bulletin & Review, 14(5), 779–804. https://doi.org/10.3758/BF03194105
- Wechsler, D. (2010). Wechsler Adut Intelligence Scale-Swedish Edition. Pearson Assessment.
- Willcutt, E. G. (2012). The prevalence of DSM-IV attention-deficit/hyperactivity disorder: A meta-analytic review. Neurotherapeutics, 9(3), 490–499. https://doi.org/10.1007/s13311-012-0135-8
- Wolstencroft, J., Mandy, W., & Skuse, D. (2020). Experiences of social interaction in young women with Turner syndrome: A qualitative study [Article]. Child: Care, Health and Development, 46(1), 46–55. https://doi.org/10.1111/cch.12710
- Woodbury-Smith, M. R., Robinson, J., Wheelwright, S., & Baron-Cohen, S. (2005). Screening adults for Asperger syndrome using the AQ: A preliminary study of its diagnostic validity in clinical practice. Journal of Autism and Developmental Disorders, 35(3), 331–335. https://doi.org/10.1007/s10803-005-3300-7
- Ye, M., Yeh, J., Kosteria, I., & Li, L. (2020). Progress in fertility preservation strategies in Turner syndrome. Frontiers in Medicine, 7, 3. https://doi.org/10.3389/fmed.2020.00003.