
Abstract
Background: C14:0, C15:0, C17:0 and trans-C16:1(n-7) are often used as biomarkers for dairy fat intake. Trans-C18:1(n-7) and CLA, two fatty acids which are also present in dairy, have hardly been explored. We investigated whether trans-C18:1(n-7) and CLA can enrich the existing biomarker portfolio.
Methods: Data were obtained from Lifelines (n = 769). Dairy fat intake was determined by FFQ. Fatty acids were measured in fasting plasma triglycerides (TG), phospholipids (PL) and cholesterol esters (CE).
Results: Median (25th–75th percentile) intakes of dairy and dairy fat were 322(209–447) and 12.3(8.4–17.4) g/d respectively. A pilot study showed that trans-C18:1(n-7) and CLA were only detectable in TG and PL. Of the established markers, TG C15:0 was most strongly associated with dairy fat intake (standardized β (std.β) = 0.286, R2 = 0.111). Of the less established markers, TG trans-C18:1(n-7) was most strongly associated with dairy fat intake (Std.β = 0.292, R2 = 0.115), followed by PL CLA (Std.β = 0.272, R2 = 0.103) and PL trans-C18:1(n-7) (Std.β = 0.269, R2 = 0.099). In TG, a combination of C15:0 and trans-C18:1(n-7) performed best (R2 = 0.128). In PL, a combination of C14:0, C15:0, trans-C18:1(n-7) and CLA performed best (R2 = 0.143).
Conclusion: Trans-C18:1(n-7) and CLA can be used as biomarkers of dairy fat intake. Additionally, combining established with less established markers allowed even stronger predictions for dairy fat intake.
Introduction
Dairy consumption is part of the food culture in many countries. Worldwide intake of dairy products is high, particularly in developed countries such as Canada, North America and parts of the European Union. For instance, in the European Union and in the USA, the average per capita milk consumption is 1.01 and 0.91 servings per day respectively (Dougkas et al. Citation2011). While dietary recommendations tend to set an upper limit to certain types of dairy products as a result of the high saturated fat or sodium content, dairy intake is generally considered healthy, particularly because of the numerous essential nutrients it contains, including calcium, proteins, phosphorus, magnesium, and several vitamins and minerals (Haug et al. Citation2007). It has been observed that high dairy intake is associated with a reduced risk for hypertension (Soedamah-Muthu et al. Citation2012). Furthermore, dairy has been suggested to have a positive influence on bone health by increasing bone mineral density (Heaney Citation2009, Sahni et al. Citation2013). There is also increasing evidence that fat from dairy products (as reflected by circulating dairy fat biomarkers) has a positive effect on various cardiovascular risk factors such as BMI, fasting glucose and insulin sensitivity (Smedman et al. Citation1999, Mozaffarian et al. Citation2010, Citation2013). Moreover, prospective studies have reported lower risk of stroke and coronary heart disease with higher levels of circulating dairy fat biomarkers (Warensjo et al. Citation2009, de Oliveira Otto et al. Citation2013). Additionally, high circulating concentrations of dairy fat biomarkers were found to be associated with reduced risk of development of type 2 diabetes as was evidenced in several longitudinal observational studies (Krachler et al. Citation2008, Forouhi et al. Citation2014, Santaren et al. Citation2014, Yakoob et al. Citation2016).
Dairy fat consists of more than 400 different fatty acids (Mansson Citation2008). The fatty acids in dairy fat derive either directly from the animal’s diet, or indirectly from ruminal fermentation. The fatty acid composition of plasma, serum, erythrocytes and adipose tissue are known to partially reflect the fatty acid composition of the diet. Several fatty acids are to a large extent unique for dairy fat intake. They are present in measurable amounts in the circulation and tissue of humans (Smedman et al. Citation1999). Myristic acid (C14:0), pentadecanoic acid (C15:0), heptadecanoic acid (C17:0) and trans-palmitoleic acid (Trans-C16:1(n-7)) are commonly used dairy fat biomarkers (Wolk, et al. Citation2001, Rosell et al. Citation2004, Biong et al. Citation2006, Sun et al. Citation2007, Yakoob et al. Citation2014, Warensjo et al. Citation2015, Lund-Blix et al. Citation2016, Yakoob et al. Citation2016 ). Particularly the odd-chain fatty acids C15:0 and C17:0 (Brevik et al. Citation2005, Biong et al. Citation2006, Sun et al. Citation2007, Yakoob et al. Citation2014, Warensjo et al. Citation2015, Yakoob et al. Citation2016, Lund-Blix et al. Citation2016), and the natural ruminant trans fat trans-C16:1(n-7) are often considered as fatty acids that mainly originate from dairy fat (Sun et al. Citation2007, Yakoob et al. Citation2014, Yakoob et al. Citation2016), because these fatty acids are synthesized by the bacterial flora in the rumen of the animal and cannot be synthesized in the human body (Jenkins et al. Citation2015). Correlations of C15:0, C17:0 and trans-C16:1(n-7) with dairy fat intake are variable. Papers that reported on the correlation between circulating dairy fat biomarkers in plasma and dairy fat intake showed correlations of 0.10–0.53 with C15:0 (Smedman et al. Citation1999, Wolk et al. Citation2001, Rosell et al. Citation2004, Sun et al. Citation2007, Yakoob et al. Citation2014, Warensjo et al. Citation2015, Lund-Blix et al. Citation2016, Yakoob et al. Citation2016), of 0.16–0.36 with C17:0 (Wolk et al. Citation2001, Rosell et al. Citation2004, Sun et al. Citation2007, Yakoob et al. Citation2014, Warensjo et al. Citation2015, Yakoob et al. Citation2016), and of 0.13–0.30 with Trans-C16:1(n-7) (Sun et al. Citation2007, Yakoob et al. Citation2014, Yakoob et al. Citation2016). Despite the specific origin of these fatty acids, the correlations are relatively low and interest in other potential dairy fat biomarkers is therefore growing.
Trans fatty acids which are also thought to mainly originate from rumen derived products are vaccenic acid (trans-C18:1(n-7)) and rumenic acid, a conjugated linoleic acid with the lipid name cis-9, trans-11 conjugated linoleic acid (CLA)). The trans fatty acids are synthesized via microbial fermentation of C18 unsaturated fatty acid in the rumen of the animal (Lock and Bauman Citation2004, Gebauer et al. Citation2011a). They can be found in several ruminant derived foods (Gebauer et al. Citation2006, Sun et al. Citation2007, Thiebaut et al. Citation2009, Gebauer et al. Citation2011b, Aslibekyan et al. Citation2012, de Oliveira Otto et al. Citation2013,Yakoob et al. Citation2014, Yakoob et al. Citation2016). Despite their occurrence in dairy products, vaccenic acid and CLA are hardly explored as potential dairy fat biomarkers. Current studies on the association of trans fats with dairy intake use a cluster of trans-C18:1, which is actually a combination of mainly rumen-derived trans-C18:1(n-7) and industrially (trans-C18:1(n-9) produced trans fats, possibly leading to biased associations ( Yu et al. Citation2012, Zong et al. Citation2014 ). It is therefore of interest to determine the association of dairy fat intake and the genuine rumen derived Trans-C18:1(n-7).
The main objective of this study was to investigate the fatty acids trans-C18:1(n-7) and CLA as potential biomarkers of dairy fat intake and to compare them with more commonly used dairy fat biomarkers. Secondly, we investigated whether a combination of biomarkers provides a better predictor for dairy fat intake compared to single biomarkers. For this we developed and validated a model for the prediction of dairy fat intake in the general population. We used data from the LifeLines Biobank and Cohort Study, a large observational cohort study of initially healthy participants living in the Northern part of the Netherlands.
Clinical significance
Despite their occurrence in dairy products, trans-C18:1(n-7) and CLA are hardly explored as potential dairy fat biomarkers in the general population.
The present study confirmed the commonly used biomarkers C14:0, C15:0, C17:0 and trans-C16:1(n-7). and identified the biomarkers trans-C18:1(n-7) and CLA as additional dairy fat biomarkers. A combination of the commonly used biomarkers with less established biomarkers allowed even stronger predictions for dairy fat intake.
Materials and methods
Study design and subjects
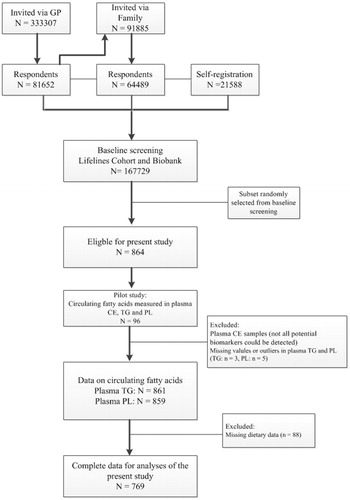
The LifeLines Cohort Study is a large observational population-based cohort study and Biobank that examines the health and health-related behaviours of more than 167,000 persons (Stolk et al. Citation2008). The participants were recruited from the three Northern provinces of the Netherlands between 2006 and 2013. The first group of 25–50 years old participants was recruited via general practitioners. Participants could indicate whether family members were interested as well. In addition, individuals who were interested in the study had the possibility to register via an online self-registration. Individuals with insufficient knowledge of the Dutch language, with severe psychiatric or physical illness, and those with limited life expectancy (<5 years) were excluded from the study. Participants (>18 years old) completed several questionnaires, including topics such as occurrence of diseases, general health, medication use, diet, physical activity and personality. Participants were invited to the Lifelines Research sites for a comprehensive health assessment. A more detailed description of the Lifelines Cohort study can be found elsewhere (Klijs et al. Citation2015, Scholtens et al. Citation2015). For the present study, we used a subset of the cross-sectional data. 864 participants were randomly selected from the Lifelines biobank. Additionally, 776 of the 864 participants had filled in a food frequency questionnaire (FFQ). Cases with missing data on either FFQ or circulating fatty acids were removed before analysis leaving 769 participants in the lifelines cohort with complete data (). All participants provided written consent. The Lifelines Cohort Study was conducted according to the principles of the Declaration of Helsinki and approved by the Medical ethical committee of the University Medical Center Groningen, The Netherlands.
Figure 1. Flow diagram of the participants in the study.
Dietary assessment
To asses dietary intake in the Lifelines Cohort, a 110-item semi-quantitative baseline food frequency questionnaire (FFQ) assessing food items over the previous month was developed and validated by the Wageningen University using the Dutch FFQTOOLTM, in which food items were selected based on the Dutch National Food Consumption Survey of 1997/1998 (Voedingscentrum Citation1998). Seven answers categories were used to assess consumption frequency, ranging from ‘not this month’ to ‘6–7 days a week’. Portion size was estimated by fixed portion sizes (e.g. slices of bread, pieces of fruit) and commonly used household measures (e.g. cups, spoons). Energy and macronutrient intake, including dairy consumption, was estimated from the FFQ data by using the Dutch food composition database of 2011 (NEVO) (Nederlands Voedingsstoffenbestand Citation2011). For this study, ‘total dairy intake’ and ‘total dairy fat intake’ (cheese, milk, buttermilk, yoghurt, sweetened yoghurt drinks, custard, curd cheese, ice cream, whipped cream and porridge) were calculated. Butter was not included in the ‘total dairy intake’ and ‘total dairy fat intake’ calculation.
Clinical measurements
Anthropometric measurements (weight, height, and waist circumference) and blood pressure were measured by well-trained staff. The anthropometric measurements were measured without shoes. Body weight was measured to the nearest 0.1 kg. Height was measured to the nearest 0.5 cm with a stadiometer placing their heels against the rod and the head in Frankfort Plane position. Waist circumference was measured to the nearest 0.5 cm in standing position with a tape measure all around the body, at the level midway between the lower rib margin and the iliac crest. BMI was calculated as weight (kg) divided by height squared (m2). Systolic and diastolic blood pressures were measured 10 times during a period of 10 min, using an automated Dinamap Monitor (GE Healthcare, Freiburg, Germany). The average of the final three readings was used for each blood pressure parameter.
Data on smoking and general health
Information about smoking and general health was collected from the self-administered questionnaire. Subjects were classified as nonsmokers, former smokers or current smokers. Information on history and prevalence of hypertension, hypercholesterolaemia and diabetes type 2 were collected in the same questionnaire.
Biochemical measurements
Blood samples were collected in the fasting state, between 8.00 and 10.00 a.m, and transported on ice to the Central Lifelines Laboratory in the University Medical Center Groningen. Serum levels of total and HDL cholesterol were measured using an enzymatic colorimetric method, triglycerides using a colorimetric UV method, and LDL cholesterol using an enzymatic method, all on a Roche Modular P chemistry analyzer (Roche, Basel, Switzerland). Fasting blood glucose was measured using a hexokinase method. HbA1c was determined in whole blood (EDTA-anticoagulated) by means of turbid metric inhibition immunoassay on a Cobas Integra 800 CTS analyzer (Roche Diagnostics Netherland BV, Almere, The Netherlands). The hs-CRP was determined by nephelometry (BN II system Siemens, Marburg, Germany). Serum creatinine was measured on a Roche Modular P chemistry analyzer (Roche, Basel, Switzerland).
Fatty acid analyses
EDTA-plasma samples were collected at baseline and stored frozen at −80 °C until use for assessment of fatty acid profiles. Analyses of fatty acids were performed in the Department of Laboratory Medicine of the University Medical Center Groningen, The Netherlands using the methodology as described by Hoving et al. (Citation1988). In short, total lipids were extracted by the method of Folch et al., using 6 ml of chloroform-methanol (2:1) and a 200 µl EDTA-plasma sample (Folch et al. Citation1957). After that, a shortened version of the method of Kaluzny et al. was used to isolate plasma cholesterol esters (CE), triglycerides (TG) and phoshpolipids (PL), using aminopropyl SPE columns (Isolute, Biotage) (Kaluzny et al. Citation1985). Fatty acids were transmethylated with methanolic-HCL into fatty acid methyl esters (FAME). The samples were extracted with hexane and eventually redissolved into 100 µl hexane. Internal standards for the quantification of fatty acids in CE (100 µl of a solution of 50.1 mg C17:0/100 ml chloroform-methanol, 2:1 v/v) and TG (100 µl of a solution of 19.9 mg of C19:0/100 ml chloroform-methanol, 2:1 v/v), both obtained from Sigma-Aldrich (Zwijndrecht, The Netherlands), were added before isolation of lipid classes. An internal standard for the quantification of fatty acids in PL (100 µl of a solution of 50.0 mg free fatty acid 19:0/100 ml methanol), obtained from Larodan (Solna, Sweden), was added after isolation of lipid classes. 100 µl Butylated Hydroxytoluene (1 g/100 ml methanol) from Sigma-Aldrich (Zwijndrecht, The Netherlands) was added to prevent fatty acid oxidation.
Aliquots of 2 µl were injected into an Agilent model 6890 gas chromatography equipped with a 200 m × 0.25 mm polar column (CP Select for FAME) and detected with an Agilent 7683 series flame ionization detector. The 200 m polar column is specifically developed to allow for better separation between trans C18:1 fatty acids (Peene Citation2011). FAMEs were identified by comparing retention times with those of known standards (Supelco 37 component FAME mix (Sigma-Aldrich)). Fatty acid compositions were expressed into mol%. Firstly, circulating fatty acid compositions were analyzed in 96 samples to investigate whether the potential dairy fat biomarkers, and especially trans-C18:1(n-7) and CLA, could be detected in the three fractions (plasma CE, TG and PL). Subsequently, we proceeded with analyses in those fractions in which all potential dairy fat biomarkers could be detected. The precision of the potential dairy fat biomarkers was calculated by measuring 10 quality-control samples. Potential dairy fat biomarkers had an average variation coefficient of ≤ 10%. In TG, the CVs for the potential new biomarkers Trans-C18:1(n-7) and CLA were 8.5% and 7.9% respectively, and in PL, the CVs for Trans-C18:1(n-7) and CLA were 9.3% and 9.6% respectively.
Statistical analyses
All analyses were performed using IBM SPSS Statistics, version 22.0 for Windows software (IBM, Armonk, NY, USA) and STATA/MP version 13.1 for Windows software (Statacorp, College Station, Texas, USA). In total, circulating fatty acids in plasma TG and PL were measured in 864 participants, whereof 776 participants had also completed an FFQ. Cases with missing data on either FFQ or circulating fatty acids were removed before analysis leaving 769 participants in the lifelines cohort with complete data. Baseline data are presented for the total population and separately for males and females to check for potential differences between males and females. Data are presented as N (%), mean ± SD or as in case of non-normally distributed data as median (25th–75th percentile). Differences in baseline data between males and females were tested with an independent t-test (continuous data), Mann-Whitney U test (non-normally distributed data) or Chi-square test (categorical data). For the main analyses, we used energy-adjusted total dairy fat intake. Energy-adjusted intakes were generated by adjustment for total energy intake using the residual method (Willett et al. Citation1997). Because men usually have a higher energy and macronutrient intake compared to women, adjustment for energy intake was performed for men and women separately. Energy-adjusted intakes are expressed in grams/day. Linear regression models were used to examine the association between circulating fatty acids and total dairy fat intake. We also examined the association of circulating fatty acids with (semi-) skimmed dairy products, full fat dairy products, fermented dairy products, milk and cheese. As sensitivity analyses, we tested whether removal of outliers for energy intake (participants with energy intakes lower or higher than 3 SDs from the mean value of energy intake) influenced the associations between dairy fat biomarkers and energy-adjusted dairy fat intake. We also tested for potential effect modification of the associations of circulating fatty acid biomarkers with total dairy fat intake by sex. Furthermore, in subsidiary analyses, the associations were adjusted for age, sex, BMI, total meat intake, and the industrialized trans fatty acid trans-C18:1(n-9) (Elaidic acid). Skewed data were transformed before analyses (square root or log-transformed). Multivariate backwards regression analyses were carried out with all potential dairy fat biomarkers in TG, PL and a combination of both to identify the best combination of markers to predict energy-adjusted dairy fat intake in our population (cut-off for removal p < 0.10). We compared the performance of the models against each other by comparing the explained variance (R2). Bland-Altman plots were created to indicate the agreement of observed (FFQ-derived data) compared to the estimated models (based on circulating fatty acids). The mean of the observed and estimated models were plotted against the difference between the observed and estimated models. To be able to compare both models with each other the observed measurement as well as the estimated measurement were standardized before analyses. Validity of the models was evaluated by ranking ability (cross-classification between the observed (FFQ-derived) intake data and the estimated intake data (based on circulating fatty acids)) (Sluik et al. Citation2016). For the ranking ability, both observed (FFQ-derived) intake data and estimated intake data (based on circulating fatty acids) were ranked into quintiles. To validate the models, we repeated the multivariate backwards regression analyses in STATA, by implementing the swboot command which created a table with the number of times each variable is selected after 1000 bootstrap samples (De Boer et al. Citation2012). Variables were included in the bootstrap models when these were present in the majority of the bootstrap attempts (>50%). In secondary analyses, variables were included in the bootstrap models when these were present in >70% of the bootstrap attempts. As additional analyses, we repeated the multivariate backwards regression analyses for unadjusted dairy fat intake (rather than energy-adjusted dairy fat intake which was used for the primary analyses), and also assessed predictive capacity for energy-adjusted dairy intake. All reported probability values are two-tailed, and p ≤ 0.05 was considered statistically significant.
Results
The baseline characteristics of the 769 participants overall and for males and females separately are shown in . The total population had a mean age of 53.0 ± 15.5 years and a BMI of 26.0 ± 4.0 kg/m2. Blood pressure was slightly higher in males (130/77 mmHg) compared to females (123/71 mmHg). Total and HDL cholesterol were higher in females, whereas total triglycerides was higher in males. Energy intake of the population was 1975 ± 624 kcal/d (8274 ± 2613 KJ/d). Of the total intake, 46 En% was derived from carbohydrates, 15 En% from proteins, and 35 En% from fats. The Lifelines dataset confirms that males overall have a higher dietary intake compared to females. Total meat intake of the population was 73.5 g/d, which contributed for 13% to the daily fat intake. Median dairy intake of the population was 322 (209–447) g/d and consisted for 12.8% of cheese, for 35.1% of milk, for 10.0% of yoghurt, and for 42.1% of other milk (based) products. Of the total dairy intake, 34% was from fermented dairy products. Median dairy fat intake of the population was 12.3 (8.4–17.4) g/d. Skimmed dairy products contributed for 2% to total dairy fat intake, while semi-skimmed and full-fat products contributed for 20% and 78% respectively. Median dairy fat intake, rather than median dairy intake overall, was significantly higher in males compared to females (median intakes males: 13.5 (9.0–18.3) g/d vs females: 11.3 (8.0–15.6) g/d; p < 0.001). Males consumed more semi-skimmed and full-fat dairy products, while females consumed more skimmed dairy products.
Table 1. Baseline characteristics of the Lifelines population.
Circulating fatty acids were measured in the first 96 samples (Table S1). Trans-C18:1(n-7) appeared not detectable in plasma CE, since it was below the detection limit. All potential dairy fat biomarkers, including trans-C18:1(n-7) and CLA, were detectable in plasma TG and PL. Since we were especially interested in the potentially less established biomarkers, we decided to further only analyze plasma TG and PL. Data on potential circulating dairy fat biomarkers in plasma TG and PL of all 769 participants are shown in . Dairy fatty acids in plasma TG were higher compared to plasma PL. The quantitatively most abundant dairy fat marker was C14:0 (Total TG: 1.87 mol%, PL: 0.49 mol%), followed by C17:0 and C15:0 in both fractions. Trans-C18:1(n-7) was the highest trans fat in both fractions (TG: 0.10 mol%, PL: 0.09 mol%).
Energy-adjusted dairy fat intake
In the univariate main analyses, all potential dairy fat biomarkers in plasma TG, except C17:0, were associated with energy-adjusted dairy fat intake (, Model 1). The highest associations were found for the commonly used biomarker C15:0 (standardized β (std β) = 0.286, p < 0.001)) and the less established biomarker trans-C18:1(n-7) (std β = 0.292, p < 0.001). All potential dairy fat biomarkers in plasma PL were also moderately associated with energy-adjusted dairy fat intake (, Model 1). Slightly higher, but still moderate associations were found with the less established biomarkers trans-C18:1(n-7) (std β = 0.269, p < 0.001) and CLA (std β = 0.272, p < 0.001) compared to the commonly used biomarkers. The highest associations with more commonly used biomarkers were found for C14:0 (std β = 0.214, p < 0.001) and C15:0 (std β = 0.215, p < 0.001), but these were still moderate. In sensitivity analyses, removal of outliers for energy intake did not materially change the association between dairy fat biomarkers and energy-adjusted dairy fat intake. In multivariate regression analyses, associations between fatty acids in plasma TG and PL with energy-adjusted dairy fat intake remained after adjustments for age, sex, BMI, total meat intake, and the industrial trans fatty acid Trans-C18:1(n-9) (Table S2(A)). The association between the biomarkers and energy-adjusted dairy fat intake did not differ between males and females, except for PL C14:0 (p = 0.03 for interaction, association in males: std β = 0.264, p < 0.001, association in females: std β = 0.173, p < 0.001 (Table S2(B), Model 1).
Table 2. Univariate regression analyses and multivariate models to predict dairy fat with circulating fatty acids in plasma TG, plasma PL and a combination of the two in the Lifelines Cohort.
In plasma TG, multivariate backwards regression analyses identified a combination of C15:0 and trans-C18:1(n-7) as the best combination to predict energy-adjusted dairy fat intake (, Model 3). The explained variance of this combination was 0.128, which was higher than the explained variance of the single markers (TG model: R2 = 0.128 vs C15:0: R2 = 0.111 and trans-C18:1(n-7): R2 = 0.115). In plasma PL, the fatty acids C14:0, C15:0, trans-C18:1(n-7) and CLA were identified as the best combination to predict energy-adjusted dairy fat intake in the general population. This model had an explained variance of 0.143, which is again higher than the explained variance of the single markers (PL model: R2 = 0.143 vs C14:0: R2 = 0.074, C15:0: R2 = 0.075, trans-C18:1(n-7): R2 = 0.099 and CLA: R2 = 0.103). A combination of fatty acids from TG (C15:0, trans-C18:1(n-7), CLA) and PL (C15:0, trans-C16:1(n-7), trans-C18:1(n-7), CLA) explained energy-adjusted dairy fat intake in the general population with an R2 of 0.154. Based on these data, a combination of biomarkers can be seen as a better predictor for energy-adjusted dairy fat intake compared to single biomarkers.
Total dairy intake, total dairy fat intake and dairy product groups
For all, but one, circulating potential dairy fatty acid biomarkers in TG and PL, associations with total dairy fat intake were present and strongest compared to associations with total dairy intake and dairy product groups (Table S3). C17:0 is a single exception, with absence of an association with total dairy fat intake for TG and a stronger association with total dairy intake than with total dairy fat intake for PL. All fatty acid biomarkers, except C17:0 in TG and PL and Trans-C16:1(n-7) in PL were relatively strongly associated with intake of cheese and full fat dairy.
Table 3. Multivariate models to predict dairy fat with circulating fatty acids in plasma TG, plasma PL and a combination of the two in the Lifelines Cohort based on 1000 bootstraps.
Agreement and ranking ability
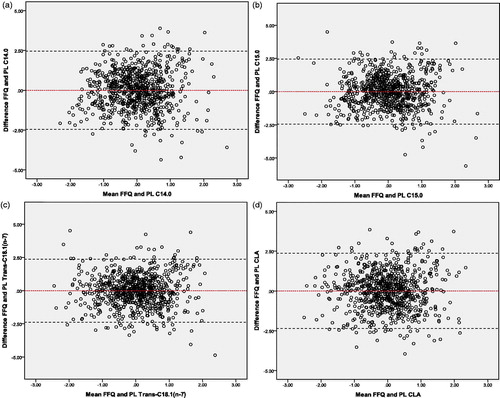
To indicate the agreement between the observed intake (FFQ-derived) and estimated intake (based on circulating fatty acids) Bland-Altman plots were made. Plots were made for the best single markers (from a set of markers) which were found by backward regression analyses ( and ). In addition, validity of the models was evaluated by ranking ability (cross-classification between the observed intake data (FFQ-derived) and the estimated intake data (TG, PL and TG + PL model based on circulating fatty acids)). Both the observed and estimated intake data were ranked into quintiles and compared. For all three estimated models, ≍67% of the participants were classified in the same or adjacent quintile of the observed model, whereas 2–3% of the participants were classified in extreme quintiles. Overall, both methods showed acceptable agreement between the observed and estimated models.
Figure 2. Bland-Altman plots for the agreement between the observed intake (FFQ-derived) and the estimated intake (based on the best circulating fatty acids in plasma TG) for the measurement of dairy fat intake in the general population. Plots of the differences between the observed intake (FFQ-derived) and the estimated intake (based on the best circulating fatty acids in plasma TG) vs the mean of the observed intake (FFQ-derived) and the estimated intake (based on the best circulating fatty acids in plasma TG) method, with (a) representing C15:0 and (b) Trans-C18:1(n-7) as the estimated intake. The red line displays the mean of the difference. The black dotted lines represents the limits of agreement (lower limit: mean - SD*1.96; upper limit: mean + SD*1.96). C15:0: Pentadecanoic acid; FFQ: food frequency questionnaire; SD: standard deviation; TG: triglycerides; Trans-C18:1(n-7): Vaccenic acid.
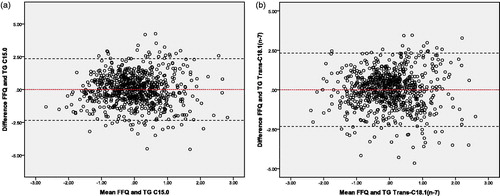
Figure 3. Bland-Altman plots for the agreement between the observed intake (FFQ-derived) and the estimated intake (based on the best circulating fatty acids in plasma PL) for the measurement of dairy fat intake in the general population. Plots of the differences between the observed intake (FFQ-derived) and the estimated intake (based on the best circulating fatty acids in plasma PL) vs the mean of the observed intake (FFQ-derived) and the estimated intake (based on the best circulating fatty acids in plasma PL), with (a) representing C14:0, (b) C15:0, (c) Trans-C18:1(n-7) and (d) CLA as the estimated intake. The red line displays the mean of the difference. The black dotted lines represents the limits of agreement (lower limit: mean - SD*1.96; upper limit: mean + SD*1.96). C14:0: Myristic acid; C15:0: Pentadecanoic acid; CLA: Conjugated Linoleic; FFQ: food frequency questionnaire; PL: phospholipids; SD: standard deviation; Trans-C18:1(n-7): Vaccenic acid.
Internal consistency of the models
To judge the internal consistency of the models, we performed backwards multivariate analyses using a bootstrap selection method (Table S4). In the TG model, C15:0 and trans-C18:1(n-7) were present in more than half of the bootstrap attempts, whereas in the PL model this was the case for C14:0, C15:0, trans-C18:1(n-7) and CLA. When fatty acids from TG and PL were combined, C15:0, trans-C18:1(n-7) and CLA from both plasma TG and PL were found in the majority of the bootstrap attempts. Trans-C16:1(n-7) in plasma PL did not remain in the prediction model. Complete bootstrap models of TG, PL and a combination of the two can be found in . Overall, the internal consistency for the fatty acids in plasma TG and PL was good, with exception for trans-C16:1(n-7) measured in plasma PL.
In secondary analyses, the bootstrap selection method was repeated with selection of fatty acids that were present in more than 70% of the 1000 bootstrap attempts. In the TG model, C15:0 and trans-C18:1(n-7) were again present, whereas the PL model included C15:0, trans-C18:1(n-7) and CLA, but not C14:0. The stricter selection criteria slightly worsened the internal consistency of the PL model. Fatty acids from TG and PL were also combined for these analyses. Interestingly, only the fatty acids trans-C18:1(n-7) and CLA from plasma PL remained in the model.
Additional analyses
As additional analyses, we repeated the multivariate backwards regression analyses for unadjusted dairy fat intake (rather than energy-adjusted dairy fat intake), and also assessed predictive capacity for energy-adjusted total dairy intake (Tables S5 and S6). The associations of the fatty acids with unadjusted dairy fat intake were weaker compared to the associations of the fatty acids with energy-adjusted dairy fat intake. However, C15:0 and trans-C18:1(n-7) remained the best predictive fatty acids in plasma TG, whereas trans-C18:1(n-7) and CLA remained the best predictive fatty acids in plasma PL.
Discussion
The main objective of the current study was to investigate whether the circulating fatty acids trans-C18:1(n-7) and CLA are an addition to the already existing dairy fat biomarkers in the general population. First of all, we found that the less established biomarkers for dairy fat intake were best quantifiable in plasma TG and PL. Additionally, we showed that trans-C18:1(n-7) and CLA, in both plasma TG and PL, were moderately associated with dairy fat intake. In plasma PL, these biomarkers were slightly higher compared to the commonly used biomarkers. Lastly, we developed and validated a model to predict dairy fat intake in the general population. Compared to the single markers, we found that a combination of less established and commonly used biomarkers, including the C15:0, trans-C18:1(n-7) and CLA, showed a slightly higher association with dairy fat intake in the general population.
Significant associations of C15:0 and C17:0 with dairy fat intake were reported in the literature before (Wolk et al. Citation1998, Wolk et al. Citation2001, Brevik et al. Citation2005, Rosell et al. Citation2005, Biong et al. Citation2006, Sun et al. Citation2007, Golley and Hendrie Citation2014, Yakoob et al. Citation2014, Warensjo et al. Citation2015, Albani et al. Citation2016, Lund-Blix et al. Citation2016, Yakoob et al. Citation2016). In the Lifelines Cohort, C15:0 was also associated with dairy fat intake, while there was no consistent independent association of C17:0 with dairy fat intake. Plasma TG C17:0 was not associated with total dairy fat intake. Plasma PL C17:0 was associated with total dairy fat intake, however in backwards regression analyses taking all potential dairy fat biomarkers from plasma PL into account, plasma PL C17:0 did not remain in the PL model. Additionally, the bootstrapping with stepwise backwards algorithm showed that C17:0 remained in the minority of the 1000 bootstrap attempts (TG: 91x, PL: 149x) (Table S4). A Norwegian study with 110 healthy men (age 21–55 years), published in 2005, also found that C15:0 from serum and adipose tissue were significantly correlated with dairy fat intake (both r = 0.28), while this was not the case for C17:0 (serum: r = −0.10, adipose tissue: r = 0.03) (Brevik et al. Citation2005). Overall, C17:0 might not be such a useful marker for dairy fat intake. Instead, in the Lifelines cohort other biomarkers were found to be better predictors of dairy fat intake.
C15:0 and trans-C18:1(n-7) in plasma TG and PL, emerged as the best biomarkers from the set of investigated biomarkers for the prediction of dairy fat intake. Every prediction model in the lifelines cohort included C15:0 as an important marker of dairy fat intake with standardized beta’s for the association with dairy fat intake of 0.29 in plasma TG and 0.22 in plasma PL. These results are in line with the current literature. For instance, in a study with more than 3000 subjects, published in 2016, the correlation for total plasma C15:0 with dairy fat intake was 0.29 (Yakoob et al. Citation2016). In addition, in a study with 279 subjects, published in 2015, the correlation of plasma PL C15:0 with dairy fat intake was 0.32 (Warensjo et al. Citation2015).
This is one of the first studies investigating the association between trans-C18:1(n-7), measured in plasma TG and PL, and dairy fat intake. A single study measured trans-C18:1(n-7) in total plasma and erythrocytes, but did not find a significant correlation (r = 0.06 and r= −0.01 respectively) (Sun et al. Citation2007). Most other studies investigated a cluster of trans-C18:1 fatty acids, which is a combination of the rumen (trans-C18:1(n-7)) and industrial derived (trans-C18:1(n-9)) trans fatty acids, rather than trans-C18:1(n-7) alone (Yu et al. Citation2012, Zong et al. Citation2014). One of these studies is a Chinese study of 2091 adult participants aged 50–70 years, published in 2014, which found an association of 0.37 between the cluster of trans-C18:1 fatty acids assessed in erythrocytes and total dairy consumption (Zong et al. Citation2014). The current study showed a lower, but significant association between the ruminant derived trans fatty acid trans-C18:1(n-7) and dairy fat intake with a standardized beta of 0.29 for TG and of 0.27 for PL.
CLA in plasma PL was also found to be associated with dairy fat intake in the Lifelines population, both as a single marker and in combination with C14:0, C15:0 and trans-C18:1(n-7), while CLA in plasma TG was less strongly associated with dairy fat intake. CLA in plasma TG as a single marker was significantly associated with dairy fat intake (std.β = 0.22), however the association of CLA with dairy fat intake did not remain in the backwards regression model when only plasma TG fatty acids were included. Current papers report mainly on the correlation between dairy fat intake and CLA in adipose tissue. For example, in a study of 3630 Costa-Rican adults, published in 2012, the correlation of CLA with dairy fat intake was 0.24 (Aslibekyan et al. Citation2012). The correlation in adipose tissue is in line with the correlation found with CLA in plasma PL.
In the current cohort, we found that a combination of biomarkers is a slightly better predictor for dairy fat intake in the general population when compared to single markers. C15:0 and trans-C18:1(n-7) were found in all three models and in the bootstrap models. Therefore, a combination of dairy fat biomarkers, particularly models including these two, may be the best combination to predict the dairy fat intake in the general population.
The combined fatty acids assessed in PL provided a slightly better prediction of dairy fat intake than the combined fatty acids in TG (R2 PL: 0.143 vs R2 TG: 0.128). Consistent with this, when the selection criterium for inclusion in the model was set at present in > 70% of the models, it was found that only plasma PL trans-C18:1(n-7) and plasma PL CLA remained in the model, if both TG and PL fatty acids were combined. This suggests that fatty acids in PL are stronger predictors than fatty acids in TG. This might be due to the fact that plasma TG is influenced by recent dietary intake (intake in the last few hours), whereas this is less so for plasma PL (Hodge et al. Citation2007). Recent meals, including large amounts of carbohydrates, can for instance turn on de novo lipogenesis which changes the fatty acid balance in plasma triglycerides and may therefore change the association with dairy fat intake. Researchers of the FORCE consortium, therefore, recommend to measure biomarkers of dietary intake in plasma CE and PL over plasma TG (Hodson et al. Citation2008, Del Gobbo et al. Citation2016, Wu et al. Citation2017). Indeed, most of the biomarker studies are carried out in plasma PL (Smedman et al. Citation1999, Wolk et al. Citation2001, Rosell et al. Citation2005, Biong et al. Citation2006, Warensjo et al. Citation2015, Lund-Blix et al. Citation2016), while only one study reported on biomarkers in serum TG (Biong et al. Citation2006). Importantly, however, one of the most promising markers, i.e. ruminant trans-C18:1(n-7), was only detectable in PL and TG, and not in CE. Furthermore, by measuring the fatty acids in both plasma TG and PL, it was possible to identify differences between both fractions.
Prediction of energy-adjusted dairy fat intake was the primary outcome for this paper. In additional analyses, we repeated the analyses for unadjusted dairy fat intake, and also assessed predictive capacity for energy-adjusted dairy intake. Both C15:0 and trans-C18:1(n-7) in plasma TG and both trans-C18:1(n-7) and CLA in plasma PL were associated with unadjusted dairy fat intake, albeit with slightly lower effect sizes than with energy-adjusted dairy fat intake. The associations between dairy biomarkers and energy-adjusted dairy intake were weaker than for energy-adjusted dairy fat intake. Obviously, dairy fatty acid biomarkers serve best to predict dairy fat intake.
This study has several strong points. Firstly, we are one of the first studies to identify trans-C18:1(n-7) and CLA in both plasma TG and PL as biomarkers of dairy fat intake. Another strength of the present study is its large population size. In total, complete data of 769 participants were used for analyses. Additionally, we were able to measure a large amount of dairy fat biomarkers in both plasma TG and PL in one cohort.
We must acknowledge that the current study has some limitations. First of all, the R-squares of the models for prediction of dairy fat intake were relatively low. This means that the dairy fatty acid biomarkers are not strongly related to the dairy fat intake from the FFQ. However, it cannot be discerned whether the weak associations are intrinsic to the dairy fatty acid biomarkers, or that the FFQ as a reference is not optimal. Concerning the dairy fatty acid biomarkers, it has been shown that some of the fatty acids in plasma are not only influenced by dairy fat intake, but can also be affected by metabolic processes (e.g. trans-C16:1(n-7) can be influenced by β-oxidation of trans-C18:1(n-7)), or by the intake of dietary fibres (e.g. C17:0 can be influenced by inulin), meat and coconut oil (e.g. C14:0) ( Zock et al. Citation1994, Valsta et al. Citation2005, Jaudszus et al. Citation2014, Weitkunat et al. Citation2017). A limitation of this study is that we have no specific data on types of oils and types of meat, which precluded adjustment of these potential confounders. However, we had data on total meat intake. In our cohort adjustment for total meat intake did not alter the association between fatty acid biomarkers and energy-adjusted dairy fat intake (Table S2(A)). Another limitation is that circulating fatty acids as biomarkers for dietary intake were expressed as proportions rather than as absolute concentrations, which makes them relative and therefore dependent on the presence of other major circulating fatty acids. The reason that we report on proportions of dairy fatty acids is to align with existing literature and make results comparable. It should also be noted that the fatty acid composition of dairy fat can vary depending on factors such as cow genetics, forage content, production level, time of lactation, physiological status of the animal and seasonal variation (Jensen Citation2002, Mansson Citation2008, Hanus et al. Citation2018; German and Dillard Citation2006). Nevertheless, fatty acid biomarkers can provide an objective estimation of dairy fat intake, while this is intrinsically not the case with FFQ, which may be subject to under- and over reporting by participants (Kristal et al. Citation2005, Sluik et al. Citation2016). Overall, there is no gold standard for measuring dietary intakes and the FFQ can therefore be seen as the best method so far.
This study is the first observational study investigating commonly used biomarkers in combination with less investigated trans fatty acid biomarkers. A first step towards validation would be performance of similar studies in other populations. Furthermore, as the applied assessment method is labour intensive, the results of this study should first be replicated in other studies to show that incorporation is worthwhile. Concluding, this paper showed associations between circulating dairy fatty acids and dairy fat intake in the general population, which can be seen as a first step towards better measurement techniques for dairy fat intake.
Conclusion
In this study, models were developed and validated for the prediction of dairy fat intake in the general population. The study confirmed the utility of commonly used biomarkers and identified the biomarkers trans-C18:1(n-7) and CLA as potential dairy fat biomarkers, which are one of the best biomarkers to predict dairy fat intake in the Lifelines population. Moreover, a combination of the biomarkers may be even a stronger predictor for dairy fat intake. A first step towards validation would be performance of similar studies in other populations.
Supplemental Material
Download PDF (476.1 KB)Acknowledgements
The authors extend their gratitude to all study participants who took part in the Lifelines Biobank and Cohort study. Furthermore, we would like to thank the staff of the LifeLines cohort Study and Biobank, and the participating general practitioners and pharmacists. We acknowledge the laboratory help of Noura Ahmed, Ingrid Martini, Larissa Loef, Adrian Post and Anne-Margreet Busker (Laboratory Medicine, University Medical Center Groningen, Groningen, The Netherlands).
The manuscript is based on data from the LifeLines Cohort Study. LifeLines adheres to standards for open data availability. The data catalog of LifeLines is publicly accessible on www.LifeLines.net. All international researchers can apply for data at the LifeLines research office ([email protected]). The LifeLines system allows access for reproducibility of the study results.
Disclosure statement
Two authors were funded by FrieslandCampina (I.G.P and S.J.L.B). One coauthor is working as a researcher at FrieslandCampina (C.S.P). None of the other authors have any potential conflict of interest. Any opinions, findings, conclusions or recommendations expressed in the current study are those of the authors and do not necessarily reflect the views of FrieslandCampina.
Additional information
Funding
Related Research Data
References
- Albani, V., et al., 2016. Exploring the association of dairy product intake with the fatty acids C15:0 and C17:0 measured from dried blood spots in a multipopulation cohort: findings from the Food4Me study. Molecular nutrition & food research, 60 (4), 834–845.
- Aslibekyan, S., et al., 2012. Biomarkers of dairy intake and the risk of heart disease. Nutrition, metabolism, and cardiovascular diseases:NMCD, 22 (12), 1039–1045.
- Brevik, A., et al., 2005. Evaluation of the odd fatty acids 15:0 and 17:0 in serum and adipose tissue as markers of intake of milk and dairy fat. European journal of clinical nutrition, 59 (12), 1417–1422.
- Biong, S.A., et al., 2006. Biomarkers for intake of dairy fat and dairy products. European journal of lipid science and technology, 108 (10), 827–834.
- De Boer, R., et al., 2012. The fibrosis marker galectin-3 and outcome in the general population. Journal of internal medicine, 272 (1), 55–64.
- De Oliveira Otto, M.C., et al., 2013. Biomarkers of dairy fatty acids and risk of cardiovascular disease in the multi-ethnic study of atherosclerosis. Journal of the american heart association, 2 (4), e000092.
- Del Gobbo, L.C., et al., 2016. Omega-3 polyunsaturated fatty acid biomarkers and coronary heart disease: pooling project of 19 cohort studies. JAMA internal medicine, 176 (8), 1155–1166.
- Dougkas, A., et al., 2011. Associations between dairy consumption and body weight: a review of the evidence and underlying mechanisms. Nutrition research reviews, 24 (1), 72–95.
- Folch, J., et al., 1957. A simple method for the isolation and purification of total lipids from animal tissues. The journal of biological chemistry, 226 (1), 497–509.
- Forouhi, N.G., et al., 2014. Differences in the prospective association between individual plasma phospholipid saturated fatty acids and incident type 2 diabetes: the EPIC-InterAct case-cohort study. The lancet. diabetes & endocrinology, 2 (10), 810–818.
- Gebauer, S.K., et al., 2011a. Effects of ruminant trans fatty acids on cardiovascular disease and cancer: a comprehensive review of epidemiological, clinical, and mechanistic studies. Advances in nutrition, 2 (4), 332–354.
- Gebauer, S.K., et al., 2011b. Effect of trans fatty acid isomers from ruminant sources on risk factors of cardiovascular disease: study design and rationale. Contemporary clinical trials, 32 (4), 569–576.
- Gebauer, S.K., et al., 2006. N-3 fatty acid dietary recommendations and food sources to achieve essentiality and cardiovascular benefits. The american journal of clinical nutrition, 83 (6), 1526S–1535S.
- German, J.B., and Dillard, C.J., 2006. Composition, structure and absorption of milk lipids: a source of energy, fat-soluble nutrients and bioactive molecules. Critical reviews in food science and nutrition, 46 (1), 57–92.
- Golley, R.K., and Hendrie, G.A., 2014. Evaluation of the relative concentration of serum fatty acids C14:0, C15:0 and C17:0 as markers of children's dairy fat intake. Annals of nutrition and metabolism, 65 (4), 310–316.
- Hanus, O., et al., 2018. Role of fatty acids in milk fat and the influence of selected factors on their variability - A review. Molecules (Basel, Switzerland), 23 (7), 10.
- Haug, A., et al., 2007. Bovine milk in human nutrition-a review. Lipids in health and disease, 6, 25.
- Heaney, R.P., 2009. Dairy and bone health. Journal of the American college of nutrition, 28 (1), 82S–90S.
- Hodge, A.M., et al., 2007. Plasma phospholipid and dietary fatty acids as predictors of type 2 diabetes: interpreting the role of linoleic acid. The American journal of clinical nutrition, 86 (1), 189–197.
- Hodson, L., et al., 2008. Fatty acid composition of adipose tissue and blood in humans and its use as a biomarker of dietary intake. Progress in lipid research, 47 (5), 348–380.
- Hoving, E.B., et al., 1988. Profiling of plasma cholesterol ester and triglyceride fatty acids as their methyl esters by capillary gas chromatography, preceded by a rapid aminopropyl-silica column chromatographic separation of lipid classes. Journal of chromatography, 434 (2), 395–409.
- Jaudszus, A., et al., 2014. Trans palmitoleic acid arises endogenously from dietary vaccenic acid. The American journal of clinical nutrition, 99 (3), 431–435.
- Jenkins, B., et al., 2015. A review of odd-chain fatty acid metabolism and the role of pentadecanoic acid (c15:0) and heptadecanoic acid (c17:0) in health and disease. Molecules (Basel, Switzerland), 20 (2), 2425–2444.
- Jensen, R.G., 2002. The composition of bovine milk lipids: January 1995 to December 2000. Journal of dairy science, 85 (2), 295–360.
- Kaluzny, M.A., et al., 1985. Rapid separation of lipid classes in high yield and purity using bonded phase columns. Journal of lipid research, 26 (1), 135–140.
- Klijs, B., et al., 2015. Representativeness of the LifeLines Cohort Study. PloS one, 10 (9), e0137203.
- Krachler, B., et al., 2008. Fatty acid profile of the erythrocyte membrane preceding development of Type 2 diabetes mellitus. Nutrition, metabolism, and cardiovascular diseases : NMCD, 18 (7), 503–510.
- Kristal, A.R., et al., 2005. Is it time to abandon the food frequency questionnaire? Cancer epidemiology, biomarkers & prevention: a publication of the American association for cancer research, cosponsored by the American society of preventive oncology, 14 (12), 2826–2828.
- Lock, A.L., and Bauman, D.E., 2004. Modifying milk fat composition of dairy cows to enhance fatty acids beneficial to human health. Lipids, 39 (12), 1197–1206.
- Lund-Blix, N.A., et al., 2016. Plasma phospholipid pentadecanoic acid, EPA, and DHA, and the frequency of dairy and fish product intake in young children. Food & nutrition research, 60, 31933.
- Mansson, H.L., 2008. Fatty acids in bovine milk fat. Food & nutrition research, 52 (1), 1821–1823.
- Mozaffarian, D., et al., 2010. Trans-palmitoleic acid, metabolic risk factors, and new-onset diabetes in U.S. adults: a cohort study. Annals of internal medicine, 153 (12), 790–799.
- Mozaffarian, D., et al., 2013. Trans-palmitoleic acid, other dairy fat biomarkers, and incident diabetes: the Multi-Ethnic Study of Atherosclerosis (MESA). The American journal of clinical nutrition, 97 (4), 854–861.
- Nederlands Voedingsstoffenbestand 2011. NEVO-tabel: Nederlands Voedingsstoffenbestand 2011 Den Haag:Voedingscentrum.
- Peene, J., 2011. Seperation of cis-trans FAME isomers. https://www.agilent.com/cs/library/applications/A01892.pdf.Updated 2014. Accessed 28th October, 2018
- Rosell, M., et al., 2005. The relation between alcohol intake and physical activity and the fatty acids 14:0, 15:0 and 17:0 in serum phospholipids and adipose tissue used as markers for dairy fat intake. The British journal of nutrition, 93 (1), 115–121.
- Rosell, M., et al., 2004. Associations between the intake of dairy fat and calcium and abdominal obesity. International journal of obesity, 28 (11), 1427–1434.
- Sahni, S., et al., 2013. Milk and yogurt consumption are linked with higher bone mineral density but not with hip fracture: the Framingham Offspring Study. Archives of osteoporosis, 8, 119-013–0119-2. Epub 2013 Feb 1.
- Santaren, I.D., et al., 2014. Serum pentadecanoic acid (15:0), a short-term marker of dairy food intake, is inversely associated with incident type 2 diabetes and its underlying disorders. The American journal of clinical nutrition, 100 (6), 1532–1540.
- Scholtens, S., et al., 2015. Cohort profile: LifeLines, a three-generation cohort study and biobank. International journal of epidemiology, 44 (4), 1172–1180.
- Sluik, D., et al., 2016. A national FFQ for the Netherlands (the FFQ-NL 1.0): validation of a comprehensive FFQ for adults. The British journal of nutrition, 116 (5), 913–923.
- Smedman, A.E., et al., 1999. Pentadecanoic acid in serum as a marker for intake of milk fat: relations between intake of milk fat and metabolic risk factors. The American journal of clinical nutrition, 69 (1), 22–29.
- Soedamah-Muthu, S.S., et al., 2012. Dairy consumption and incidence of hypertension: a dose-response meta-analysis of prospective cohort studies. Hypertension (Dallas, Texas: 1979), 60 (5), 1131–1137.
- Stolk, R.P., et al., 2008. Universal risk factors for multifactorial diseases: LifeLines: a three-generation population-based study. European journal of epidemiology, 23 (1), 67–74.
- Sun, Q., et al., 2007. Plasma and erythrocyte biomarkers of dairy fat intake and risk of ischemic heart disease. The American journal of clinical nutrition, 86 (4), 929–937.
- Thiebaut, A.C., et al., 2009. Correlation between serum phospholipid fatty acids and dietary intakes assessed a few years earlier. Nutrition and cancer, 61 (4), 500–509.
- Valsta, L.M., et al., 2005. Meat fats in nutrition. Meat science, 70 (3), 525–530.
- Voedingscentrum 1998. Zo eet Nederland: resultaten van de voedselconsumptiepeiling. Voedingscentrum, 1997–1998.
- Warensjo, E., et al., 2015. Relative validation of the dietary intake of fatty acids among adults in the Swedish National Dietary Survey using plasma phospholipid fatty acid composition. Journal of nutritional science, 4, e25.
- Warensjo, E., et al., 2009. Stroke and plasma markers of milk fat intake–a prospective nested case-control study. Nutrition journal, 8, 21-2891–28-21.
- Weitkunat, K., et al., 2017. Odd-chain fatty acids as a biomarker for dietary fiber intake: a novel pathway for endogenous production from propionate. The American journal of clinical nutrition, 105 (6), 1544–1551.
- Willett, W.C., et al., 1997. Adjustment for total energy intake in epidemiologic studies. The American journal of clinical nutrition, 65 (4), 1220S–1228S. discussion 1229S-1231S.
- Wolk, A., et al., 2001. Fatty acid composition of adipose tissue and serum lipids are valid biological markers of dairy fat intake in men. The journal of nutrition, 131 (3), 828–833.
- Wolk, A., et al., 1998. Evaluation of a biological marker of dairy fat intake. The American journal of clinical nutrition, 68 (2), 291–295.
- Wu, J.H.Y., et al., 2017. Omega-6 fatty acid biomarkers and incident type 2 diabetes: pooled analysis of individual-level data for 39 740 adults from 20 prospective cohort studies. The lancet. Diabetes & endocrinology, 5 (12), 965–974.
- Yakoob, M.Y., et al., 2014. Circulating biomarkers of dairy fat and risk of incident stroke in U.S. men and women in 2 large prospective cohorts. The American journal of clinical nutrition, 100 (6), 1437–1447.
- Yakoob, M.Y., et al., 2016. Circulating biomarkers of dairy fat and risk of incident diabetes mellitus among men and women in the United States in two large prospective cohorts. Circulation, 133 (17), 1645–1654.
- Yu, D.X., et al., 2012. Erythrocyte trans-fatty acids, type 2 diabetes and cardiovascular risk factors in middle-aged and older Chinese individuals. Diabetologia, 55 (11), 2954–2962.
- Zock, P.L., et al., 1994. Impact of myristic acid versus palmitic acid on serum lipid and lipoprotein levels in healthy women and men. Arteriosclerosis and thrombosis: a journal of vascular biology, 14 (4), 567–575.
- Zong, G., et al., 2014. Dairy consumption, type 2 diabetes, and changes in cardiometabolic traits: a prospective cohort study of middle-aged and older Chinese in Beijing and Shanghai. Diabetes care, 37 (1), 56–63.