
 ?Mathematical formulae have been encoded as MathML and are displayed in this HTML version using MathJax in order to improve their display. Uncheck the box to turn MathJax off. This feature requires Javascript. Click on a formula to zoom.
Abstract
Background
Cobalt is a dermal sensitizer, and keratinocytes respond to cobalt exposure by releasing proinflammatory mediators, regulating the immune response.
Objective
To determine the effect of cobalt on the inflammasome associated cytokine- and gene expression in cultured human keratinocytes (HaCaT). Cultivation in low- or high calcium conditions model separate differentiation states of keratinocytes in the skin.
Method
HaCaT cells in two different states of differentiation were exposed to cobalt chloride and caspase-1 activity as well as the production of IL-1β, IL-18 and gene expression of IL1B, IL18, NLRP3, CASP1, and PYCARD was quantified.
Results
High cobalt chloride exposure mediated significant increase in caspase-1 activity, cytokine levels, and IL1B and NLRP3 expression with a corresponding regulatory decrease for CASP1 and PYCARD expression. No difference between high- and low calcium culturing conditions modelling differentiation states was detected.
Conclusions
Our data suggest that HaCaT cells respond with inflammmasome associated activity upon cobalt exposure in a concentration-dependent manner. These mechanisms could be of importance for the understanding of the pathophysiology behind allergic sensitization to dermal cobalt exposure.
Introduction
Cobalt is a well-known sensitizer that can cause adverse health effects e.g. allergic contact dermatitis upon direct contact with the skin or by airborne exposure to cobalt particles (Gimenez Camarasa Citation1967, Julander et al. Citation2010, Rui et al. Citation2010). Cobalt has been shown to penetrate the skin and is found both in the nucleus and cytosol of cells in exposed tissue making it readily available for cellular interaction (Larese Filon et al. Citation2004).
Allergic contact dermatitis is induced after skin exposure and penetration of a sensitizing substance and is dependent upon cell-mediated immune function (Grabbe et al. Citation1996, Watanabe et al. Citation2007, Vocanson et al. Citation2009). In the skin, keratinocytes possess immunomodulatory capacity and can detect and respond to danger signals, such as pathogen-associated molecular patterns (PAMPs) and damage-associated molecular patterns (DAMPs), some of which lead to activation of a large multiprotein complex called the inflammasome (Feldmeyer et al. Citation2007, Gross et al. Citation2011, Abderrazak et al. Citation2015, Jo et al. Citation2016). Inflammasome activity is initiated through activation of NOD-like receptors, such as NLRP3, which in turn leads to the composition of the inflammasome complex and further activation of the functional units, the protease caspase-1 (Stutz et al. Citation2009, Lu et al. Citation2014). In turn, caspase-1 will cleave the inactive pro-interleukin-1β (IL-1β) and pro-IL-18 into their biologically active forms (Gu et al. Citation1997, Martinon et al. Citation2002, Agostini et al. Citation2004).
IL-1β is one of the most potent proinflammatory cytokines known, as it regulates the production of other cytokines and modulates several immune cell mechanisms (Latz Citation2010, Gross et al. Citation2011) and IL-18 mediates T-cell maturation and the activation of mast cells and basophiles (Nakanishi et al. Citation2001). Keratinocytes are known to actively participate in immune responses in the skin, making them a key target for investigations into mechanisms of inflammatory skin diseases and to study keratinocyte function in inflammatory skin diseases. Keratinocytes constitutively synthesize pro-IL-1β and pro-IL-18, but only activate and secrete the cytokines under specific conditions involving activation of the inflammasome (Mizutani et al. Citation1991, Nylander-Lundqvist et al. Citation1996, Naik et al. Citation1999, Companjen et al. Citation2000, Feldmeyer et al. Citation2007, Zhu and Kanneganti Citation2017) thus providing a central source of proinflammatory cytokine production in the skin (Kupper et al. Citation1986).
HaCaT cells are often used as proxies for keratinocytes in models investigating the effects of irritants and drugs on the skin. The HaCaT cell line is capable of proliferation and differentiation in vitro, and the cells exhibit the major surface markers found on primary isolated human keratinocytes (Boukamp et al. Citation1988, Albanesi et al. Citation2005, Micallef et al. Citation2009). In vitro models using HaCaT cells have been shown to provide a suitable microenvironment in the study of skin sensitization (Bonifas et al. Citation2010) as they produce a large variety of cytokines, including IL-1β and IL-18 (Grossman et al. Citation1989, Barker Citation1992, Enk and Katz Citation1992, Mee et al. Citation2000, Park et al. Citation2007), and inflammasome-dependent inflammatory responses upon stimulation (Watanabe et al. Citation2007). We have previously shown that HaCaT cells respond to cobalt chloride (CoCl2) exposure with potent proinflammatory activity involving production of IL-6, CCL2, and CXCL8 (Klasson et al. Citation2021). Since CoCl2 has been found to increase IL-1β secretion in HaCaT cells (Yang et al. Citation2011b), and an overexpression of IL-1β mRNA was detected in HaCaT cells after exposure to CoCl2 (Sun et al. Citation2015), we expand on these findings by investigating the effect of CoCl2 on inflammasome activation in HaCaT cells. There is a paucity of knowledge regarding the underlying mechanisms in the cell-mediated immune functions due to cobalt exposure of keratinocytes, and even if the involvement of the inflammasome is implied to be of importance, there is a lack of data in this regard.
By using HaCaT cells as a model for dermal exposure to cobalt, the aim of this study was to describe the cellular response to cobalt in human keratinocytes with regards to activation of the inflammasome and the production and release of inflammasome associated cytokines. Further, gene expression of inflammasome related genes was investigated to understand the underlying mechanisms mediated by cobal exposure.
Materials and methods
Experimental design
HaCaT cells were exposed to different concentrations of CoCl2 for three different lengths of time and inflammasome activity and release of IL-1β and IL-18 was measured. Inflammasome activation was quantified as caspase-1 activity using FLICA 660, a bead-based immunoassay was used to quantify cytokines, and qPCR was used to quantify mRNA in the CoCl2 exposed cells. To investigate the cellular response to CoCl2 in low versus high differentiation of the HaCaT cells, calcium was used to stimulate differentiation of the cells.
Cell culture and cobalt exposure
HaCaT cells (Cell Lines Service GmbH, Eppelheim, Germany) were maintained in Dulbecco’s modified Eagle’s medium (DMEM) with 4.5 g/L glucose, supplemented with 10% foetal bovine serum (FBS), gentamicin (10 mg/mL), and L-glutamine (4 mM) (all from Thermo Fisher Scientific Inc., Waltham MA.), at 37 °C and 5% CO2. The cells were passaged with trypsin-EDTA (0.25%) phenol red (Thermo Fisher Scientific Inc.), when reaching approximately 70% confluency in T-75 flasks. The cell culture was regularly tested for mycoplasma contamination using the MycoAlert™ Mycoplasma Detection Kit according to the manufacturer’s instructions (Lonza, Basel, Switzerland). Cells were cultured in DMEM containing 1.8 mM calcium to induce differentiation or kept in medium containing 0.15 mM calcium for the undifferentiated phenotype for seven days prior to experiment. For experiments, cells were seeded in 24 or 48-well plates at day six of differentiation and allowed to attach for 24 hours before the start of the experiment. CoCl2 0.1 M solution (Sigma-Aldrich St. Louis, MI), was diluted to desired concentrations in DMEM and used for exposure of the HaCaT cells. For measurements of IL-1β and IL-18, the HaCaT cells were exposed to 100 µM, 500 μM or 1 mM CoCl2 in medium for 30 minutes, 24 hours, and 48 hours. For caspase-1 activity assay, cells were exposed to 500 µM and 1 mM CoCl2 for 24 hours. Gene expression quantification was performed with 500 µM and 1 mM and the exposure time was 24 and 48 hours.
Measurement of cytokines
Cells were seeded in 24-well plates at a density of 4 × 10⁵ cells/well in a volume of 500 µL and experiments were performed five consecutive times with three technical replicates for each concentration and time point according to figure specification. Following CoCl2 exposure, supernatants were collected, the three supernatants from technical replicates were pooled, and centrifuged for five minutes at 300 × g, aliqouted and stored at −80 °C. Cytokine secretion from exposed HaCaT cells was measured using LEGENDplex Human Inflammation Panel, (BioLegend, San Diego, CA), according to the manufacturer’s instructions. Analyses was performed using the flow cytometer BD Accuri 6.0 (Becton Dickinson and Company, Franklin Lakes, NJ).
Caspase-1 assay (FLICA)
Measurements of caspase-1 activation were performed using a FLICA 660 caspase-1 assay from Immuno Chemistry Technologies, LCC, Bloomington, MN. Upon termination of the 24 hours CoCl2 exposure, DMEM was removed and FLICA 660 diluted in DMEM added using the manufacturer’s instructions. Collection of cells for analysis with the flow cytometer was done by trypsination of the cells for one minute and careful detachment of the cells from the wells using a cell scraper. Analysis was performed using the flow cytometer BD Accuri 6.0 (Becton Dickinson). Experiments were performed three consecutive times.
Gene expression analysis
Gene expression in HaCaT-cells exposed to CoCl2, was measured using qPCR. The cells were seeded in 48-well plates at a density of 1 × 10⁵ cells/well in 200 µL medium at day six and incubated 24 hours to allow attachment before start of exposure.
After 24 or 48 hours CoCl2 exposure, the supernatant was removed and cells carefully washed with PBS. Cells were lysed in RLT buffer and total RNA was extracted using a RNeasy Mini Kit (Qiagen, Hilden, Germany) according to the manufacturer’s instructions. RNA quality was determined with a 2100 Bionalyzer (Agilent, Santa Clara, CA) and quantified using a NanoDrop 2000 (Thermo Fisher Scientific Inc.). cDNA was synthesized in an 80 μL reaction containing 1.2 µg RNA, using a High Capacity cDNA Reverse Transcription Kit (Applied Biosystems, CA,) in a LifePro Thermal Cycler (Bioer, Hangzhou, China). Real-time PCR was performed in a Quantstudio 7 Flex Real-Time PCR system (Applied Biosystems). A sample of 1 μL cDNA was added to TaqMan Fast Universal PCR Master Mix (Applied Biosystems) and TaqMan Gene Expression Assays (Applied Biosystems), according to the manufacturer’s instructions to achieve a final reaction volume of 10 μL. As a negative control for cross contamination, water was included in every run. Six random samples were included as no reverse transcriptase control (NRT) in every run to assess the amount of gDNA contamination. Pipetting of samples and reaction mixtures into a 384-well plate was performed by a PIRO Pipetting Robot (Dornier, Lindau, Germany). The PCR protocol started with an initial denaturation phase at 95 °C for 20 seconds, followed by 40 amplification cycles at 95 °C for 1 s and 60 °C for 20. TBP and PPIB was determined by using the NormFinder R package (MOMA, Aarhus University Hospital, Denmark) as reference genes for normalization among a total of four candidate reference genes. For cDNA quantification, a six-point serially four-fold diluted calibration curve was developed from peripheral blood mononuclear cells stimulated by 1 μg/mL lipopolysaccharide and cultured with buffy-coat. The RNA of treated peripheral blood mononuclear cells was extracted from 1 × 10⁷ cells per reaction using a QIAamp RNA Blood Mini Kit (Qiagen). cDNA reverse transcription was conducted according to the same procedure as sample cDNA synthesis.
All samples were amplified in duplicate and the mean quantity values were obtained for further data analysis. An acceptable coefficient of variation (CV) between duplicates was set to <15%. Water was used as negative control. All data were collected via QuantStudio™ Real-Time PCR software (Applied Biosystems). TBP and PPIB was determined by using the NormFinder R package (MOMA) as reference gene for normalization.
For cDNA quantification, a six-point serially four-fold diluted calibration curve was developed from peripheral blood mononuclear cells stimulated by 1 μg/mL lipopolysaccharide and cultured with buffy-coat. The RNA of treated peripheral blood mononuclear cells was extracted from 1 × 10⁷ cells per reaction using a QIAamp RNA Mini Kit (Qiagen). cDNA revers transcription was conducted according to the same procedure as sample cDNA synthesis.
Statistical methods
Secretion for IL-1β and IL-18 from HaCaT cells exposed to CoCl2 is presented in . Each point represents concentrations from one biological experiment (three pooled technical replicates) and the median value, including exposure time, concentration, and high and low calcium. Gene expression is presented in for IL1B and IL18, NLRP3, CASP1, and PYCARD mRNA. Each point represents the normalized value of the gene expression and is based on exposure time, CoCl2 concentration, and high and low calcium. ANOVA was used to validate whether there are differences between the controls and respective test parameters in the experimental set up. The lowest exposure cobalt concentration, lowest exposure time, and low calcium concentration are set as the reference category in the analysis. The results of the ANOVA analysis are presented as logarithmic mean value and 95% confidence intervals.
Figure 1. (A) IL-1β secretion by HaCaT cells after exposure to cobalt chloride concentrations 0, 100, 500 µM and 1 mM. Exposure time is 30 minutes (control), 24 hours, and 48 hours. Calcium incubation of HaCaT cells (high: 1.8 mM and low: 0.15 mM) calcium concentrations are shown. (B) IL-18 secretion production by HaCaT-cells after CoCl2 exposure 0, 100, 500 µM and 1 mM, at time points 30 minutes, 24 hours, and 48 hours. Results of high (1.8 mM) and low (0.15 mM) calcium culturing conditions are shown.
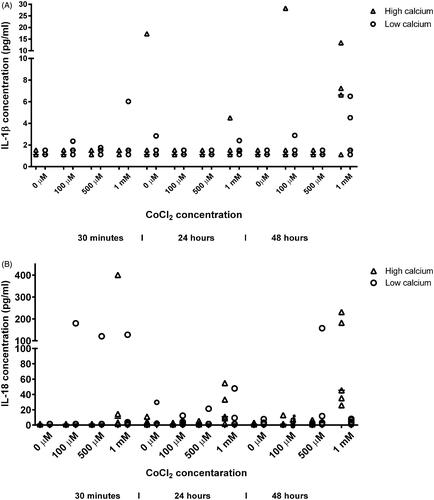
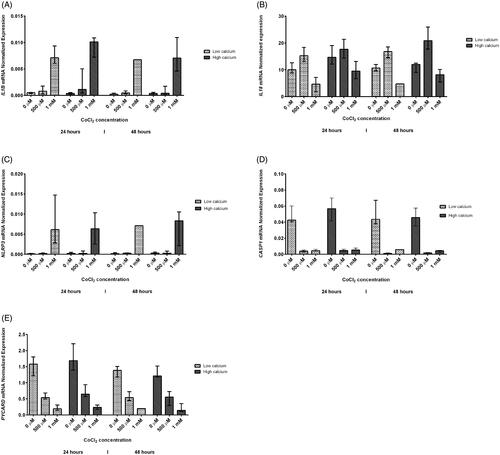
Figure 2. Gene expression in HaCaT cells after CoCl2 exposure of 0, 500 µM and 1 mM for 24 hours and 48 hours, respectively. High (1.8 mM) and low (0.15 mM) calcium culturing conditions are shown. Results are presented as the normalized gene expression for each of IL1B (A), IL18 (B), NLRP3 (C), CASP1 (D), and PYCARD (E). Results are shown as median value and range (min-max).
The caspase-1 activity analyses, presented in , using FLICA 660, are expressed in percentage as fluorescence signal of the activated caspase-1 in exposed cells compared to unexposed cells (the gating strategy is shown in ); high and low calcium growth conditions are included. Results are shown as mean value and standard deviation and is analysed using a paired t-test.
Figure 3. Caspase-1 activity in HaCaT cells determined with FLICA staining, analysed by flow cytometry. The cells were exposed to 500 µM and 1 mM CoCl2, respectively, for 24 hours under high and low calcium incubation. The results are expressed in percentage as fluorescence signal of the activated caspase-1 in exposed cells, compared to unexposed, and shown as mean value and standard deviation (*p ≤ 0.05, **p ≤ 0.005).
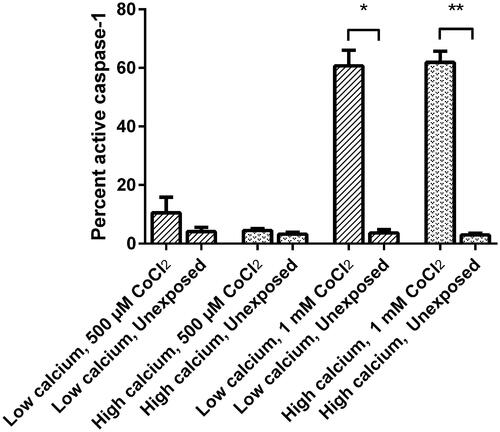
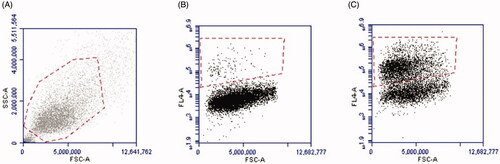
Figure 4. Caspase-1 activity in HaCaT cells determined by flow cytometry. Gating strategy for the cell population (A). By moving forward with the same population, gating strategy is shown using unstimulated (0 µg) stained cells (B), and the gating of FLICA positive cells (C).
To further describe the effect of CoCl2 exposure time, concentration, and differentiation status of the cells, on the HaCaT cells’ production of cytokines, caspase-1 activity, and mRNA, a linear mixed model was developed. The design of the experiment with repeated measurements and the use of the mixed model made it possible to take into account within- and between tests variability.
The data were log-transformed since the distribution of cytokines, mRNA, and caspase-1 activity was skewed. The estimates (β) of the fixed effects from the model allowed us to identify factors affecting production of cytokines, mRNA, and caspase-1 activity.
The equation of the final mixed model for cytokines analysed using immunoanalysis and mRNA analysed using qPCR is:
Y = ln(X); X and Y are the measured and log-transformed cytokine concentrations or gene expression, respectively
µ = the overall average for each of IL-1β, IL-18 concentration, or IL1B mRNA, IL18 mRNA, NLRP3 mRNA, PYCARD mRNA, and CASP1 mRNA expression on the log-scale
β1= the fixed effect of the exposure time (30 min reference and, 24 and 48 hours for cytokines, and 24 hours reference and 48 hours for gene expression)
β2= cobalt chloride concentration (0 µM reference, 100 µM, 500 µM, and 1 mM for cytokines and 0 µM reference, 500 µM, and 1 mM for mRNA respectively)
β3= high and low calcium incubation (1.8 mM and 0.15 mM respectively)
ε = residual
The equation of the final mixed model for caspase-1 activity analysed using FLICA 660 is:
Y = ln(X); X and Y are the measured and log-transformed caspase-1 activity
µ = the overall average for caspase-1 activity on the log-scale
β1= the fixed effect of the exposure groups (unexposed group, reference and exposed group)
β2= cobalt chloride concentration (0 µM reference, 500 µM, and 1 mM respectively)
β3= high and low calcium incubation (1.8 mM and 0.15 mM respectively)
ε = residual
The reference category in the mixed model is the lowest exposure cobalt concentration, lowest exposure time, lowest exposure group, and low calcium concentration. The results of the analysis are presented as antilogarithmic β-values (odds ratio, OR) and 95% confidence intervals (CI) providing the quantitative difference for a certain variable compared to a reference group rather than only reporting if there is a difference or not. Two outliers representing accidental situations in immunoassays were excluded from the analyses.
The statistical significance threshold was <0.05 for all statistical analyses. The graphs were constructed using GraphPad Prism 5.03 software (GraphPad Software, San Diego, CA). Immunoassay analyses, gene expression, and caspase-1 activity analyses were performed using Kolmorogov-Smirnov, IBM SPSS Statistics 25 (Chicago, IL). Caspase-1 activity analyses were also performed using GraphPad Prism 5.03 software (GraphPad Software).
Results
Immunoassays, IL-1β, and IL-18
HaCaT cells exposed to CoCl2 concentrations of 0, 100, and 500 µM or 1 mM for 30 minutes (control), 24, and 48 hours () showed a significant increase for the IL-18 production mean (pg/mL) () at the highest exposure level of cobalt (2.23, 95% CI 1.54–2.93). A linear mixed model was applied to illustrate the relationship between the different cobalt concentrations, exposure times, and high and low calcium incubation of HaCaT cells (). Significant increase in both IL-1β and IL-18 production was detected when HaCaT cells were exposed to 1 mM cobalt (OR 1.80, 95% CI 1.06–3.07 and OR 6.23, 95% CI 3.04–12.77), but not for 100 µM or 500 µM. The exposure time showed no effect on the cytokine levels of IL-1β and IL-18. No difference was detected when comparing high calcium levels, i.e. representing more differentiated cells with low calcium levels, i.e. representing less differentiated cells.
Table 1. ANOVA analyses for dose- and time trends for IL-1β and IL-18 secretion from the HaCaT cellsa,b.
Table 2. Linear regression mixed model analyses for dose- and time trends for IL-1β and IL-18 secretion from the HaCaT cellsa,b.
Caspase -1 activity
The gating strategy to determine the activated cells during flow cytometry analysis is shown in . FLICA 660 was used to measure the caspase-1 activity in HaCaT cells exposed for 24 hours and to 500 µM or 1 mM CoCl2. A significant increase in caspase-1 activity was detected in cells stimulated with 1 mM CoCl2 (). Further, exposure of HaCaT cells to 1 mM CoCl2 showed a significant increase in caspase-1 activation compared to the unexposed cells when analysed by using the mixed model (OR 5.96; 95% CI 3.07–11.56), and the high exposure group (1 mM) showed a statistically significant increase of caspase-1 activity compared to the 500 µm (OR 2.81; CI 1.45–2.45). No significant difference was seen in the response between high and low calcium growth conditions ().
Table 3. Linear regression mixed model analyses for caspase-1 activation in HaCaT cells, dose trends, high (1.8 mM) and low (0.15 mM) calcium incubationa,b.
Gene expression of inflammatory cytokines
Gene expression in HaCaT cells was measured after exposure to CoCl2 concentrations of 0, 500 µM, and 1 mM for 24 and 48 hours, respectively (). Significant difference in gene expression () was seen when the controls were compared to respective test parameter at 500 µM for IL1B, IL18, CASP1 and PYCARD (–7.32, 95% CI −7.66–(–6.98), 2.87, 95% CI 2.80–2.94, −6.03, 95% CI −6.33–(–5.73) and −0.55, 95% CI −0.65–(–0.46)). Difference was also seen at 1 mM for IL1B, IL18, NLRP3, CASP1, and PYCARD (–4.87, 95% CI −5.00–(–4.74), 1.88, 95% CI 1.64–2.11, −5.06, 95% CI −5.34–(–4.78), −5.36, 95% CI −5.51–(–5.22) and −1.60, 95% CI −1.78–(–1.42)). Time was only significant for IL1B (–7.27, 95% CI −7.75–(–6.80)) and calcium concentration only for IL18 (2.57, 95% CI 2.43–2.71). When applying the mixed model for the gene expressions (), IL1B mRNA displayed a statistically significant exposure response in regard to increasing CoCl2 concentrations (OR = 1.80, CI = 1.33–2.42; OR = 19.46, CI = 13.98–27.09), and time (OR = 0.67, CI = 0.52–0.87). NLRP3 mRNA showed a significant increase for CoCl2 concentration 1 mM (OR = 33.03, CI = 12.58–86.70). Significantly decreased CASP1 mRNA and PYCARD mRNA levels was noted for both the high exposures (500 µM and 1 mM) and the longest exposure time (48 hours). IL18 mRNA was not significantly affected by time or CoCl2 concentration. When comparing high and low calcium incubation conditions for the HaCaT cells, no difference was found.
Table 4. ANOVA analyses showing dose- and time relationships for gene expression of IL1B, IL18, NLRP3, CASP1 and PYCARD at high (1.8 mM) and low (0.15 mM) calcium incubation of HaCaT cells exposed to CoCl2a,b.
Table 5. Linear regression mixed model analyses showing dose- and time relationships for gene expression of IL1B, IL18, NLRP3, CASP1, and PYCARD at high (1.8 mM) and low (0.15 mM) calcium incubation of HaCaT cells exposed to CoCl2a,b.
Discussion
In this study, we provide evidence that exposure to CoCl2 induce inflammasome activation in human keratinocytes in a concentration- and time-dependent manner. The detected levels of IL-1β from kerationocytes are significantly increased but at low concentrations. However, IL-1β is one of the body’s most potent inflammatory cytokines as it regulates many functions of the immune system, small amounts are needed for a potent inflammatory response, and small changes in IL-1β levels may cause severe inflammation of clinical relevance (Verma et al. Citation2008, Blomgran et al. Citation2012). On the other hand, IL-1β levels will decrease with increasing extracellular calcium concentration during keratinocyte differentiation of neonatal foreskin keratinocytes (Bigler et al. Citation1992), and in the present study calcium was used as a differentiation factor, which may explain the low IL-1β levels detected.
In our study, the IL-1β levels were significantly increased at the highest CoCl2 concentration tested, i.e. 1 mM, a finding that was reinforced by the IL1B mRNA levels which also increased with increasing CoCl2 concentration only to decrease over time. This concurrence and time kinetic is supported by reports showing increase in IL-1β levels after 500 µM CoCl2 exposure of HaCaT cells for 24 hours (Yang et al. Citation2011a, Citation2011b) and initial increase in IL1B mRNA following CoCl2 exposure after 6 hours, peaking at 24 hours, and with decreased levels of IL1B mRNA at 48 hours (Sun et al. Citation2015). These results are in agreement with the role of the IL-1β protein mediation of an acute inflammatory response. IL-1β but also IL-18, is found to be of importance in processes during the initiation phase in hypersensitivity reactions, i.e. during migration of the cells and for antigen presentation in the skin (Grabbe et al. Citation1996, Okamoto et al. Citation1999, Chang et al. Citation2000, Kalina et al. Citation2000, Kampfer et al. Citation2000, Wang et al. Citation2002). Further, the NLRP3 inflammasome has been suggested to be of importance during the sensitization phase of contact hypersensitivity (Sutterwala et al. Citation2006), as well as during the early phase of elicitation phase, which is characterized by increased vessel permeability and local edoema. This phase peaks about eight hours after antigen exposure and is mediated by IL-1β (Watanabe et al. Citation2007).
To describe the underlying effectors of findings, gene expression of inflammasome-related components was investigated, and a dose- and time-dependent relationship for CoCl2 exposure on HaCaT cells was found for CASP1 and PYCARD, while for NLRP3 only the dose affected the production. Further, increased caspase-1 activity was found in cells stimulated by 1 mM CoCl2 for 24 hours, representing the plausible inflammasome involvement in the sensitization phase of contact hypersensitivity. Evidence indicates that the NLRP3 inflammasome acts as a key regulator in the innate immunity of contact hypersensitivity (Watanabe et al. Citation2007). In our model, the mRNA levels of CASP1 and PYCARD (encoding ASC) in HaCaT cells decreased by time of exposure and by CoCl2 concentration. NLRP3 mRNA, on the other hand, increased after exposure to CoCl2. Caspase-1 activity per se was stimulated by CoCl2. These data show that HaCaT cells react to CoCl2 exposure by down-regulating the production of CASP1 mRNA and PYCARD mRNA, while still producing NLRP3 mRNA. This same pattern of inflammasome regulation on the transcriptome level has previously been shown in human immune cells (Idosa et al. Citation2019). Moreover, CoCl2 has been found to increase the mRNA levels of the inflammasome components NPRP3 and IL1B as well as PYCARD/ASC in free fatty acid-primed liver cells (Hernández et al. Citation2020). These cells also activated caspase-1, and this activation was also detected in unprimed cells, i.e. in cells not pre-exposed to free fatty acids. In addition, cobalt ions have been found to directly bind to and activate the TLR4 receptor in keratinocytes via the NFκB signalling pathway in a similar manner as is known for, e.g. LPS exerted through TLR4 for priming of the NLRP3 inflammasome (Raghavan et al. Citation2012). Despite downregulation of certain mRNA pools, there was, however, no slowdown in caspase-1 activity or IL-1β production over the course of the experiment. Whether this is a negative feedback mechanism that will eventually lead to decreased IL-1β production, or an outcome of sufficiently expressed levels of inflammasome components to mount a proper inflammatory response despite down-regulated mRNA levels of CASP1 and PYCARD, is not possible to clarify by our study but needs to be examined in future studies. It has however been suggested that negative regulation of the inflammasome is essential for damage control in the host (Jo et al. Citation2016). Thus, it is possible that caspase-1 could be down-regulated in order to control the inflammatory response in the skin. In such a scenario, where CASP1/caspase-1 is not replaced, caspase-1 is consumed in the activation process of IL-1β and IL-18. This could indicate that the inflammasome is burned out and there will be no prolonged infiltration activity to the site of CoCl2 exposure, resulting in a moribund inflammation due to down-regulation of the inflammasome. In this regard it is also important to consider possible clinical aspect of long-term exposure to cobalt. Hedbrandt et al. found a decrease in caspase-1 activity in monocytes ex vivo in workers exposed to high levels of quartz, and suggest that this could be an indication that high-exposed workers would have a pre-activated inflammasome less responsive to additional stimuli (Hedbrant et al. Citation2020). Future studies need to investigate if a numbed inflammasome is also present in cells of individuals exposed to cobalt, as such information is of value for understanding the underlying mechanisms in cobalt-mediated clinical impact due to long-term and/or high exposure.
Taken together, our data concur with previous studies showing CoCl2-induced increase in mRNA as well as secretion of mature IL-1β in HaCaT cells (Yang et al. Citation2011b, Sun et al. Citation2015), but more importantly, provide information for a role of the caspase-1/inflammasome axis in this process as well as the participation of IL-18. Our model of combining cytokine secretion with caspase-1 activity and mRNA expression highlight the complexity of inflammasome regulation, involving both its priming and its activation and points to the fact that cobalt acts as a primer as well as an activator of caspase-1/inflammasome signalling. By using our model of calcium as an inducer of differentiation for the HaCaT cells, we can conclude that the cobalt effect on inflammasome related outcomes is not dependent on the differentiation status of the keratinocytes.
Clinical significance of the present study
Both air exposure from use of the cobalt containing products and direct contact may lead to adverse health effects. Even if occupational exposure to cobalt e.g. in the hard metal manufacturing industry is the most described risk environment, health issues resulting from exposure is found also in the general population. Cobalt is ever present in our lives by being a metal used in many applications, for example aircraft engine parts, tools, dental and other implants, jewellery, leather, colours, batteries, and lithium-ion batteries that have increased exponentially during the last decade. Whereas certain main exposure sources can be controlled through regulations, the mechanisms causing cobalt related health issues need be described in order to facilitate clinical intervention. Cobalt skin exposure can lead to skin allergies (Gimenez Camarasa Citation1967, Wahlberg and Boman Citation1978, Dooms-Goossens et al. Citation1986) and approximately 4.5% of patch tested patients with eczema were shown to be allergic to cobalt (Fall et al. Citation2015). As inflammatory mediators associated with NLRP3 inflammasome activity play important roles in allergic dermatitis, it is of relevance to understand the mecahanisms during the inflammation in the skin leading to the onset of the allergy. Our findings shows that the exposure dose rather than the time of exposure affects the sensitization in skin due to cobalt and these findings can help shed new light on the NLRP3 inflammasome in skin allergy which could pose a promising target for the treatment of allergic dermatitis.
Conclusions
We demonstrated that exposure of HaCaT cells to CoCl2 activates the NLRP3 inflammasome and leads to production and release of the pro-inflammatory cytokines IL-1β and IL-18. CoCl2 regulated the inflammasome by acting both as a primer (induced mRNA) and an activator (induced caspase-1 activity and cytokine production). The production of inflammasome components was dose- and time-dependent in a manner that indicate a negative feedback mechanism that might balance endured CoCl2 exposure. This is in accordance with the fact that IL-1β and IL-18 are known to play a role in the early phases of hypersensitivity reactions, and also contribute to differentiation and infiltration of immune cells. We conclude that CoCl2 does indeed lead to inflammatory activation of HaCaT cells, involving the activation of the inflammasome, and to production of proinflammatory cytokines in a dose-dependent manner. These findings can be important for an understanding of allergic sensitization.
Acknowledgements
The cells used in this study were the immortalized human keratinocyte cell line HaCaT, an appreciated contribution from Drs. Anita Koskela von Sydow and Mikael Ivarsson (Örebro University, Sweden).
Disclosure statement
No potential conflict of interest was reported by the author(s).
Data availability statement
All data are within the manuscript.
Additional information
Funding
References
- Abderrazak, A., et al., 2015. NLRP3 inflammasome: from a danger signal sensor to a regulatory node of oxidative stress and inflammatory diseases. Redox biology, 4, 296–307.
- Agostini, L., et al., 2004. NALP3 forms an IL-1beta-processing inflammasome with increased activity in Muckle-Wells autoinflammatory disorder. Immunity, 20 (3), 319–325.
- Albanesi, C., et al., 2005. Keratinocytes in inflammatory skin diseases. Current drug targets. Inflammation and allergy, 4 (3), 329–334.
- Barker, J.N., 1992. Role of keratinocytes in allergic contact dermatitis. Contact dermatitis, 26 (3), 145–148.
- Bigler, C.F., et al., 1992. Interleukin-1 receptor antagonist production by human keratinocytes. The journal of investigative dermatology, 98 (1), 38–44.
- Blomgran, R., et al., 2012. Common genetic variations in the NALP3 inflammasome are associated with delayed apoptosis of human neutrophils. PLoS one., 7 (3), e31326.
- Bonifas, J., et al., 2010. Evaluation of cytochrome P450 1 (CYP1) and N-acetyltransferase 1 (NAT1) activities in HaCaT cells: implications for the development of in vitro techniques for predictive testing of contact sensitizers. Toxicology in vitro, 24 (3), 973–980.
- Boukamp, P., et al., 1988. Normal keratinization in a spontaneously immortalized aneuploid human keratinocyte cell line. The journal of cell biology, 106 (3), 761–771.
- Chang, J.T., et al., 2000. The costimulatory effect of IL-18 on the induction of antigen-specific IFN-gamma production by resting T cells is IL-12 dependent and is mediated by up-regulation of the IL-12 receptor beta2 subunit. European journal of immunology, 30 (4), 1113–1119.
- Companjen, A.R., et al., 2000. Human keratinocytes are major producers of IL-18: predominant expression of the unprocessed form. European cytokine network, 11 (3), 383–390.
- Dooms-Goossens, A.E., et al., 1986. Contact dermatitis caused by airborne agents: a review and case reports. Journal of the American academy of dermatology, 15 (1), 1–10.
- Enk, A.H., and Katz, S.I., 1992. Early molecular events in the induction phase of contact sensitivity. Proceedings of the national academy of sciences of the United States of America, 89 (4), 1398–1402.
- Fall, S., et al., 2015. Contact allergy trends in Sweden – a retrospective comparison of patch test data from 1992, 2000, and 2009. Contact dermatitis, 72 (5), 297–304.
- Feldmeyer, L., et al., 2007. The inflammasome mediates UVB-induced activation and secretion of interleukin-1beta by keratinocytes. Current biology, 17 (13), 1140–1145.
- Gimenez Camarasa, J.M., 1967. Cobalt contact dermatitis. Acta derm venereol, 47, 287–292.
- Grabbe, S., et al., 1996. Dissection of antigenic and irritative effects of epicutaneously applied haptens in mice. Evidence that not the antigenic component but nonspecific proinflammatory effects of haptens determine the concentration-dependent elicitation of allergic contact dermatitis. The journal of clinical investigation, 98 (5), 1158–1164.
- Gross, O., et al., 2011. The inflammasome: an integrated view. Immunological reviews, 243 (1), 136–151.
- Grossman, R.M., et al., 1989. Interleukin 6 is expressed in high levels in psoriatic skin and stimulates proliferation of cultured human keratinocytes. Proceedings of the national academy of sciences of the United States of America, 86 (16), 6367–6371.
- Gu, Y., et al., 1997. Activation of interferon-gamma inducing factor mediated by interleukin-1beta converting enzyme. Science, 275 (5297), 206–209.
- Hedbrant, A., et al., 2020. Quartz Dust Exposure Affects NLRP3 Inflammasome Activation and Plasma Levels of IL-18 and IL-1Ra in Iron Foundry Workers. Mediators of inflammation, 2020, 8490908.
- Hernández, A., et al., 2020. Chemical hypoxia induces pro-inflammatory signals in fat-laden hepatocytes and contributes to cellular crosstalk with Kupffer cells through extracellular vesicles. Biochimica et biophysica acta. Molecular basis of disease, 1866 (6), 165753.
- Idosa, B.A., et al., 2019. Neisseria meningitidis-induced caspase-1 activation in human innate immune cells is LOS-dependent. Journal of immunology research, 2019, 6193186.
- Jo, E.K., et al., 2016. Molecular mechanisms regulating NLRP3 inflammasome activation. Cellular & molecular immunology, 13 (2), 148–159.
- Julander, A., et al., 2010. Skin deposition of nickel, cobalt, and chromium in production of gas turbines and space propulsion components. The annals of occupational hygiene, 54 (3), 340–350.
- Kalina, U., et al., 2000. IL-18 activates STAT3 in the natural killer cell line 92, augments cytotoxic activity, and mediates IFN-gamma production by the stress kinase p38 and by the extracellular regulated kinases p44erk-1 and p42erk-21. Journal of immunology, 165 (3), 1307–1313.
- Kampfer, H., et al., 2000. Regulation of interleukin-18 (IL-18) expression in keratinocytes (HaCaT): implications for early wound healing. European cytokine network, 11 (4), 626–633.
- Klasson, M., et al., 2021. Dose- and time-dependent changes in viability and IL-6, CXCL8 and CCL2 production by HaCaT-cells exposed to cobalt. Effects of high and low calcium growth conditions. PLoS one, 16 (6), e0252159.
- Kupper, T.S., et al., 1986. Human keratinocytes contain mRNA indistinguishable from monocyte interleukin 1 alpha and beta mRNA. Keratinocyte epidermal cell-derived thymocyte-activating factor is identical to interleukin 1. The journal of experimental medicine, 164 (6), 2095–2100.
- Larese Filon, F., et al., 2004. In vitro percutaneous absorption of cobalt. International archives of occupational and environmental health, 77 (2), 85–89.
- Latz, E., 2010. The inflammasomes: mechanisms of activation and function. Current opinion in immunology, 22 (1), 28–33.
- Lu, A., et al., 2014. Unified polymerization mechanism for the assembly of ASC-dependent inflammasomes. Cell, 156 (6), 1193–1206.
- Martinon, F., Burns, K., and Tschopp, J., 2002. The inflammasome: a molecular platform triggering activation of inflammatory caspases and processing of proIL-beta. Molecular cell, 10 (2), 417–426.
- Mee, J.B., Alam, Y., and Groves, R.W., 2000. Human keratinocytes constitutively produce but do not process interleukin-18. The british journal of dermatology, 143 (2), 330–336.
- Micallef, L., et al., 2009. Effects of extracellular calcium on the growth-differentiation switch in immortalized keratinocyte HaCaT cells compared with normal human keratinocytes. Experimental dermatology, 18 (2), 143–151.
- Mizutani, H., Black, R., and Kupper, T.S., 1991. Human keratinocytes produce but do not process pro-interleukin-1 (IL-1) beta. Different strategies of IL-1 production and processing in monocytes and keratinocytes. The journal of clinical investigation, 87 (3), 1066–1071.
- Naik, S.M., et al., 1999. Human keratinocytes constitutively express interleukin-18 and secrete biologically active interleukin-18 after treatment with pro-inflammatory mediators and dinitrochlorobenzene. The journal of investigative dermatology, 113 (5), 766–772.
- Nakanishi, K., et al., 2001. Interleukin-18 is a unique cytokine that stimulates both Th1 and Th2 responses depending on its cytokine milieu. Cytokine & growth factor reviews, 12 (1), 53–72.
- Nylander-Lundqvist, E., Bäck, O., and Egelrud, T., 1996. IL-1 beta activation in human epidermis. Journal of immunology, 157 (4), 1699–1704.
- Okamoto, I., et al., 1999. Development of CD8+ effector T cells is differentially regulated by IL-18 and IL-12. Journal of immunology, 162 (6), 3202–3211.
- Park, H.J., et al., 2007. Adrenocorticotropin hormone stimulates interleukin-18 expression in human HaCaT keratinocytes. The journal of investigative dermatology, 127 (5), 1210–1216.
- Raghavan, B., et al., 2012. Metal allergens nickel and cobalt facilitate TLR4 homodimerization independently of MD2. EMBO reports, 13 (12), 1109–1115.
- Rui, F., et al., 2010. Nickel, cobalt and chromate sensitization and occupation. Contact dermatitis, 62 (4), 225–231.
- Stutz, A., Golenbock, D.T., and Latz, E., 2009. Inflammasomes: too big to miss. The journal of clinical investigation, 119 (12), 3502–3511.
- Sun, Z., et al., 2015. Fucosterol protects cobalt chloride induced inflammation by the inhibition of hypoxia-inducible factor through PI3K/Akt pathway. International immunopharmacology, 29 (2), 642–647.
- Sutterwala, F.S., et al., 2006. Critical role for NALP3/CIAS1/Cryopyrin in innate and adaptive immunity through its regulation of caspase-1. Immunity, 24 (3), 317–327.
- Wahlberg, J.E., and Boman, A., 1978. Sensitization and testing of guinea pigs with cobalt chloride. Contact dermatitis, 4 (3), 128–132.
- Wang, B., et al., 2002. Contribution of Langerhans cell-derived IL-18 to contact hypersensitivity. Journal of immunology, 168 (7), 3303–3308.
- Watanabe, H., et al., 2007. Activation of the IL-1beta-processing inflammasome is involved in contact hypersensitivity. The journal of investigative dermatology, 127 (8), 1956–1963.
- Verma, D., et al., 2008. Gene polymorphisms in the NALP3 inflammasome are associated with interleukin-1 production and severe inflammation: relation to common inflammatory diseases? Arthritis and rheumatism, 58 (3), 888–894.
- Vocanson, M., et al., 2009. Effector and regulatory mechanisms in allergic contact dermatitis. Allergy, 64 (12), 1699–1714.
- Yang, C., et al., 2011a. Oxidative stress mediates chemical hypoxia-induced injury and inflammation by activating NF-kappab-COX-2 pathway in HaCaT cells. Molecules and cells, 31 (6), 531–538.
- Yang, C., et al., 2011b. Hydrogen sulfide protects against chemical hypoxia-induced cytotoxicity and inflammation in HaCaT cells through inhibition of ROS/NF-kappaB/COX-2 pathway. PLoS one, 6 (7), e21971.
- Zhu, Q., and Kanneganti, T.D., 2017. Cutting edge: distinct regulatory mechanisms control proinflammatory cytokines IL-18 and IL-1β. Journal of immunology, 198 (11), 4210–4215.