
Abstract
Introduction
Liquid biopsies are promising diagnostic tools for glioma. In this quantitative systematic review, we investigate whether the detection of intermediate filaments (IF) in body fluids can be used as a tool for glioma diagnosis and prognosis.
Materials and methods
We included all studies in which IF-levels were determined in patients with glioma and healthy controls. Of the 28 identified eligible studies, 12 focussed on levels of GFAP in serum (sGFAP) and were included for metadata analysis.
Results
In all studies combined, 62.7% of all grade-IV patients had detectable levels of sGFAP compared to 12.7% of healthy controls. sGFAP did not surpass the limit of detection in lower-grade patients or healthy controls, but sGFAP was significantly elevated in grade-IV glioma (0.12 ng/mL (0.06 − 0.18), P < 0.001) and showed an average median difference of 0.15 ng/mL (0.04 − 0.25, P < 0.01) compared to healthy controls. sGFAP levels were linked to tumour volume, but not to patient outcome.
Conclusion
The presence of sGFAP is indicative of grade-IV glioma, but additional studies are necessary to fully determine the usefulness of GFAP in body fluids as a tool for grade-IV glioma diagnosis and follow-up.
Clinical significance
This systematic review and meta-analysis show that GFAP in serum is linked to grade-IV glioma.
The high heterogeneity between studies and relatively low sensitivity makes applicability of sGFAP as a biomarker, however, currently uncertain.
Additional studies are necessary to investigate whether sGFAP can be used for the diagnosis or follow-up of specific subgroups of grade-IV patients.
Introduction
Gliomas are tumours that arise from the glial cells in the brain (Louis et al. Citation2016). Glioma can occur in different malignancy grades with increasing malignancy: that is, grade I = pilocytic astrocytoma, grade II = astrocytoma and oligodendroglioma, grade III = anaplastic astrocytoma and oligodendrocytoma, and grade IV = glioblastoma multiforme (GBM). This grading is based on various histopathological features (Louis et al. Citation2016). GBM is the most common primary malignant brain tumour, and the most severe of all gliomas. Due to its rapid progressive, heterogeneous nature, and diffuse spread in the brain, current treatment, consisting of chemotherapy, radiotherapy and/or surgery, is unsuccessful in eradicating GBM (Aldape et al. Citation2019). This results in a five-year survival rate of 6.8% (Ostrom et al. Citation2019).
Tissue biopsies are widely used in the diagnosis of brain tumours. However, the procedure is highly invasive and potentially hazardous. In addition to the risk of neurological dysfunction, post-operative oedema and haemorrhage result in a mortality rate for biopsies of 0.5% to 3.5% (Yong and Lonser Citation2013). Furthermore, there is a notable inter- and intra-observer variability for histopathology of glioma biopsies (Mittler et al. Citation1996). Patients cannot undergo the invasive procedure repeatedly for longitudinal sampling due to the high risk. This complicates treatment monitoring in glioma patients, since neuro-imaging does not always provide proper correlation with treatment response (Neagu et al. Citation2015). Liquid biopsies can be a more objective, less invasive, and quicker diagnostic tool for glioma diagnosis or follow-up. It could aid in early detection of the tumour and possibly enable regular follow-up over time, allowing the monitoring of tumour progression and therapy response.
Emerging biomarkers in various types of cancer are intermediate filaments (IFs), which are cytoskeletal proteins (Sharma et al. Citation2019). The composition of the IF network varies greatly across various cell types. IFs play a role in many different cellular processes, from regulating the deformability and mechanical strength of the cell to various essential cellular mechanisms such as transmembrane transport and intracellular signalling (Etienne-Manneville Citation2018). In addition, IFs are involved in facilitating cell motility and migration, depending on the context, cell type, and type of IF (Chung et al. Citation2013, De Pascalis et al. Citation2018). These functional characteristics of IFs are of interest considering the malignancy of glioma (Skalli et al. Citation2013, van Bodegraven et al. Citation2019a, Hohmann Dehghani Citation2019). Glial fibrillary acid protein (GFAP) is an IF which is co-expressed with nestin and vimentin and is mainly present in the astrocytes and neural stem cells in the brain (Hol and Pekny Citation2015).
Because of the diverse roles of GFAP, its level in serum has been assessed for a variety of brain diseases (Messing and Brenner Citation2020). More specifically, GFAP is a novel biomarker for traumatic brain injury (TBI) (Shemilt et al. Citation2019) and a commercial test has recently been approved for use in the clinic by the U.S. Food and Drug Administration (The U.S. Food and Drug Administration Citation2018). While there is no consistent correlation between GFAP expression in tissue and glioma malignancy (reviewed in van Bodegraven et al. Citation2019a), we observed that the ratio between two splice variants of GFAP, GFAPα and δ, is correlated to glioma grade (Stassen et al. Citation2017). The release of GFAP by tumour cells and its diffusion to blood serum or other body fluids may, however, differ between tumour grades as a result of higher cell death/proliferation and blood-brain permeability in tumours of higher grades. Serum or other body fluid GFAP levels might thus be of use in the clinical practice of neuro-oncology, for example as a diagnostic help in the case of doubtful MRI images or to monitor treatment effect in glioma patients. A prerequisite to this end is to assess the level of intermediate filaments in the body fluids of glioma patients compared to healthy controls.
Materials and methods
Systematic review
Collection of all biomedical literature on measurements of IFs in body fluids (serum, cerebral spinal fluid [CSF], urine, saliva) of glioma patients was systematically performed according to the Preferred Reporting Items for Systematic Reviews and Meta-Analyses (PRISMA) guidelines (Moher et al. Citation2009). The PubMed database was screened on April 12th 2020 for publications on IFs, glioma, and body fluids using a search string with Medical Subject Headings (MeSH) and Title/Abstract filters as listed in Table S1. The same search string was used again on March 24th 2021. All articles were independently assessed by two researchers (DMF and JVA) via the online web-tool Rayyan (Qatar Computing Research Institute) (Ouzzani et al. Citation2016). Reviews were also examined to identify additional relevant studies.
Table 1. An overview of studies quantifying GFAP protein levels in serum of grade IV patients and controls.a
Primary outcomes of interest included the number of patients with detectable IF levels in serum, CSF and/or other body fluids, and mean or median levels of IFs in the serum, CSF and/or other body fluids of primary, non-treated glioma patients separated per glioma malignancy grade, as documented by the World Health Organisation (Louis et al. Citation2016). Detectable levels were defined as values that surpassed the lower limit of detection (LLOD) as specified by the authors of the paper (Table S3). Prespecified inclusion criteria resulted in the selection of all studies of patients with non-treated glioma (WHO Grade I, II, III, and IV) that reported on the appropriate outcome data. Exclusion criteria were: patient age <18 years, case reports, animal studies, non-English reports, articles not available in full text, in vitro studies, and studies that did not provide comparative data on outcomes of interest or otherwise did not meet inclusion criteria.
Data extraction
Data on primary glioma patients in which IF levels in body fluids were determined, were used. Data for any outcome of interest was extracted from the text of included studies. When the outcome measures were not reported in the text, the data points were extracted from the graphs using https://automeris.io/WebPlotDigitizer (Rohatgi Citation2020).
Meta-analysis and judgement of bias and applicability
The extracted data on GFAP protein levels in serum (sGFAP) of glioma patients separated by grade and in controls were further used for a meta-analysis. The ‘quantile estimation’ model by McGrath et al. (McGrath et al. Citation2020) was applied in RStudio (version 1.2.5042) (R Foundation for Statistical Computing, Vienna) (R Core Team Citation2013) and the outcome was subsequently applied in the metaphor package (Viechtbauer Citation2010). In brief, the sampling variance of effect sizes was estimated for all studies and meta-analysed using the inversed variance method and the random-effects model. The outcome measure was the average estimate of the median for sGFAP levels within glioma grades or controls and the average estimate of the difference of the median for sGFAP level differences between glioma grades and/or controls. Significance was defined as P ≤ 0.05 with a 95% confidence interval and was determined for each estimated median either to be significantly different than zero or significantly different between groups. Heterogeneity was assessed with the tau2 statistic (estimated variance of true effects) and the I2 statistic (percentage of variation across studies) with the aforementioned metaphor package. Robustness of results was judged with the QUADAS-2 tool, which consists of four domains concerning risk of bias and applicability to which a label of ‘low risk’, ‘high risk’, or ‘unknown’ was assigned for every included study by DMF and JVA (Whiting et al. Citation2011). Disagreement between the two investigators or lack of information resulted in an ‘unknown’ assessment. The funnel plot of the results and subsequent regression test for funnel plot asymmetry were generated using the metaphor package for RStudio (Viechtbauer Citation2010). Forest plots of sensitivity and specificity and SROC curves were plotted with the Mada package for RStudio (Doebler and Holling Citation2015). Graphics were made with the ggplot2 package for RStudio and the Seaborn package in Jupyter notebook (Python) (Wickham Citation2016, Waskom et al. Citation2020).
Results
Systematic search
The search strategy resulted in 849 publications that were scanned on title and abstract by two researchers, independently. The 39 remaining studies that matched our inclusion criteria were evaluated in detail and 28 studies reporting on IF levels in body fluids of glioma patients were identified. Since only two out of 28 studies focussed on IF proteins other than GFAP (Ludwig et al. Citation2009, Husain et al. Citation2012), we decided to focus the systematic review on outcome measures regarding GFAP in body fluids of glioma patients ().
Figure 1. Preferred Reporting Items for Systematic Reviews and Meta-Analyses (PRISMA) diagram of included studies.
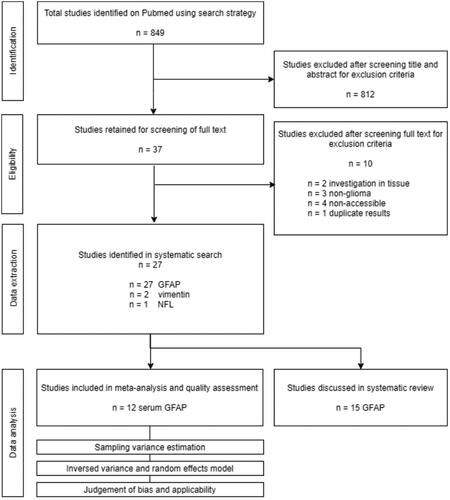
The majority of the identified studies reported on soluble GFAP protein levels in serum of glioma patients of different grades. The studies reporting on this outcome-measure were used for a meta-analysis. Other reported measures identified during the systematic search were on soluble GFAP levels in CSF, on numbers of GFAP positive tumour cells, immune cells, and extracellular vesicles, and on auto-antibodies against GFAP. The results of the studies not included in the meta-analysis are discussed per category.
Meta-analysis on GFAP levels in serum of glioma patients
Sixteen studies investigated the baseline levels of soluble serum GFAP (sGFAP) protein in the serum of glioma patients before treatment intervention, using antibody-based immunoassays. The reported outcome measures of twelve of these studies were used for a meta-analysis on sGFAP levels in different glioma grades and control group (). The remaining four studies categorised the patients differently by combining grade I/II and grade III/IV patients (Brommeland et al. Citation2007, Shih et al. Citation2017, Hepner et al. Citation2019; Urbanavičiūtė et al. Citation2020) and were therefore not included in the meta-analysis, but will be discussed separately. The details on the control populations used in every study included in the meta-analysis are listed in Table S2.
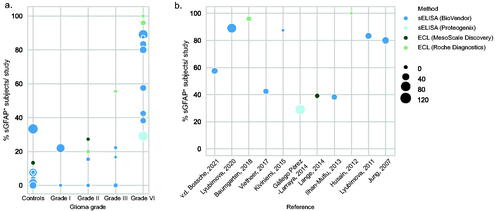
First, we meta-analysed data on the percentage of subjects with detectable levels of GFAP in their serum in glioma patient and control groups, as reported by the twelve studies. Within the individual studies, a subject was considered positive for sGFAP (sGFAP+) when the levels of sGFAP exceeded the lower limit of detection (LLOD) of the assay used, as determined by the authors and specified in Table S3. When combining all studies, the percentage of patients with detectable levels of sGFAP is 62.7% in grade IV glioma, in comparison to 12.7%, 17.2%, 10.7% and 15.1% in controls, grade-I, grade-II and grade-III patients, respectively ( and Table S4). The percentage sGFAP+ grade-IV patients showed large variation across studies, ranging from 29.1% (Gállego Pérez-Larraya et al. Citation2014) to 100% ((Husain et al. Citation2012), ), although the latter study only included nine patients. sGFAP levels were detected using either the ElectroChemiLuminescence (ECL) technology from Roche (Husain et al. Citation2012, Baumgarten et al. Citation2018) or MesoScale Discovery (Lange et al. Citation2014), or the sandwich enzyme-linked sorbent assay (sELISA) from Biovendor (Jung et al. Citation2007, Ilhan-Mutlu et al. Citation2013, Kiviniemi et al. Citation2015, Vietheer et al. Citation2017, Lyubimova et al. Citation2020, Citation2011, van den Bossche et al. Citation2021)/Proteogenix (Gállego Pérez-Larraya et al. Citation2014). The single study that used the latter technique was also the study that reported the lowest percentage of sGFAP+ grade-IV patients. No large differences were, however, observed in percentage of sGFAP+ subjects between studies that used the ECL methods versus the sELISA method from Biovendor. Most studies, regardless of the assay, used a LLOD within the range between 0.01 to 0.05 ng/mL to define a serum sample positive or negative for GFAP, with the exception of four studies (Table S3; Lange et al. Citation2014, van den Bossche et al. Citation2021).
Figure 2. (a) A graphic overview of percentage of subjects with detectable levels of serum measured by different studies, grouped by glioma grade. (b) A graphic overview of percentage of grade-IV patients positive for serum GFAP as measured by the individual studies. Size of the dot represents the number of grade-IV patients included. Colours correspond to the method utilized in the study. Abbreviations: ECL: electrochemiluminescence; sELISA: sandwich Enzyme-Linked Immunosorbent Assay.
Next, we investigated the concentrations of soluble GFAP in the serum of glioma patients and controls by meta-analysing the mean/median sGFAP values reported by the different studies (, Table S5). When the mean/median sGFAP levels were not reported, we extracted individual datapoints from the graphs to calculate the median sGFAP concentration for that study (Lange et al. Citation2014; van den Bossche et al. Citation2021). Assuming that GFAP is normally not present in serum, we first tested within the separate groups whether the basal sGFAP levels were significantly different from zero. The average estimated median of sGFAP levels were not significantly different from zero in healthy controls and grade I–III patients (0.00 ng/mL (0.00 − 0.00), ); however, a significant elevation was found in patients with glioma grade IV (0.12 ng/mL (0.06 − 0.18), P < 0.001, ). Next, we determined the estimated median differences of sGFAP levels between the different groups by only including studies where sGFAP levels were directly compared. When directly comparing the sGFAP levels of grade-IV patients to the levels of sGFAP in controls, an average median difference of 0.15 ng/mL (0.04 − 0.25, P < 0.01) was found (). This significant difference was also apparent when comparing sGFAP of grade-IV patients to grade III (0.10 ng/mL (0.02 − 0.19), P < 0.05), grade II (0.09 ng/mL (0.01 − 0.17), P < 0.05), and grade I (0.19 ng/mL (0.03 − 0.35), P < 0.05) (Figures S4–S6). However, no significant difference in sGFAP levels were found when comparing grade III to grade II, to grade I, or to controls (Figures S7–S10). Some studies compared the sGFAP levels of glioma patients to patients with brain metastases. Since our search did not focus on this patient group, we summarized these findings in Table S4 but did not include the brain metastasis group in the quantitative analysis.
Figure 3. (a) A forest plot of average estimated median (p < 0.0001) GFAP levels in serum of grade-IV patients, measured with sELISA or ECL, as meta-analysed with inverse variance and a random-effects model. Heterogeneity measures: tau2 = 0.0077; I2 = 93.33%. Squares indicate the observed outcome from individual studies and horizontal lines indicate its 95% confidence interval. The size of the square corresponds to the relative weight assigned in the pooled analysis using the random-effects model. The diamond at the bottom of the figure indicates the pooled median with 95% CI. (b) A forest plot of average estimated median difference (p < 0.0001) of sGFAP levels between grade-IV patients and the control group as meta-analysed with inverse variance and a random-effects model. Heterogeneity measures: tau2 = 0.0132; I2 = 84.73%. Squares indicate the median difference between grade-IV patients and controls from individual studies and horizontal lines indicate its 95% confidence interval. The size of the square corresponds to the relative weight assigned in the pooled analysis using the random-effects model. The diamond at the bottom of the figure indicates the pooled median difference with 95% CI.
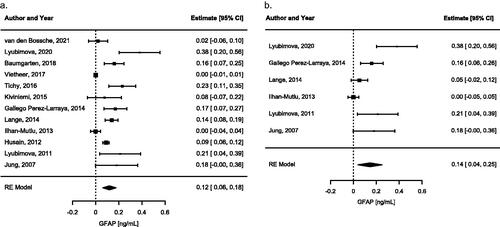
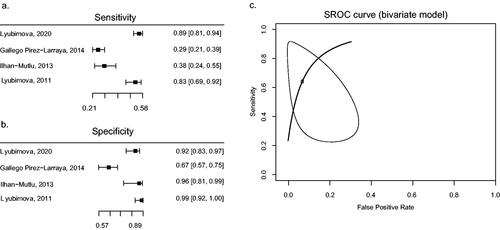
Figure 4. Forest plots of calculated sensitivity (a) and specificity (b) based on reported numbers of grade-IV glioma and controls. Only studies with similar thresholds are shown. SROC curve (c) has been fitted using the bivariate model of Reitsma et al. as a linear mixed model with known variances of the random effects (Reitsma et al. Citation2005). An AUC of 0.885 was calculated.
Judgement of bias and applicability
Quality assessment of meta-analysed papers by the QUADAS-2 tool revealed that all studies were at risk of bias to some degree, mostly due to a lack of information about whether the results were interpreted without knowledge about the reference standard and vice versa (Table S6). Furthermore, not all controls were age- and sex-matched (Table S2). The funnel plot of the analysis showed qualitatively moderate asymmetry and thus moderate publication bias, which was further strengthened by the significant regression test for funnel plot asymmetry (Figure S11).
Sensitivity and specificity analysis
Following the results of our meta-analysis, we conducted sensitivity and specificity analyses to determine the validity of sGFAP as a biomarker for grade-IV glioma (). The estimated sensitivity was between 29% and 89% for sGFAP levels for grade-IV glioma compared to controls, while the specificity was relatively high (varying between 67% and 99%). SROC analysis showed an AUC of 0.885 but showed a wide range of variety () (Mandrekar Citation2010). This analysis was limited due to a small study sample.
Additional analyses of sGFAP
In addition to the studies included in the meta-analysis, four additional studies reported on sGFAP measurements in glioma using different conditions or groups. Brommeland and colleagues investigated the baseline levels of sGFAP in grade-III and grade-IV glioma combined and detected sGFAP in 16 out of 31 patients, with a mean of 239 ng/L (range 30 − 1210 ng/L). The authors described a tendency towards lower GFAP concentrations in grade III (87.5 ng/L) in comparison to grade IV (262 ng/L) patients, but information about the range of these measurements is lacking (Brommeland et al. Citation2007). Both Shih et al. and Urbanaviciute et al. compared sGFAP levels in grade I/II patients and grade III/IV patients combined. Both studies did not find a significant difference in sGFAP levels between the high- and low grade groups (Shih et al. Citation2017, Urbanavičiūtė et al. Citation2020) or between glioma patients and controls (Urbanavičiūtė et al. Citation2020). In the study by Shih and colleagues the mean level of sGFAP was even higher in the low grade glioma group (n = 54, 0.281 ± 0.522 ng/L) compared to the high-grade group (n = 20, 0.145 ± 0.354 ng/L) (Shih et al. Citation2017). Hepner and colleagues divided central nervous system (CNS) tumour patients into progressive- and stable disease groups, with high- and low-grade gliomas but also other CNS tumours included in both categories. Higher levels of sGFAP were measured in both progressive- and stable disease groups in comparison to control samples (Hepner et al. Citation2019).
sGFAP association with patient outcome, treatment response and tumour characteristics
In addition to baseline sGFAP measurements, many studies investigated whether sGFAP levels correlate with patient outcome, treatment response and/or tumour characteristics, as summarised in . A clear correlation between sGFAP levels and overall survival (OS) and progression free survival (PFS) is lacking. Some studies report no association between sGFAP levels and OS or PFS (Gállego Pérez-Larraya et al. Citation2014, Shih et al. Citation2017, Vietheer et al. Citation2017). However, detection or an increase of sGFAP has also been linked to a less favourable outcome (Kiviniemi et al. Citation2015, Lyubimova et al. Citation2020), as well as a (trend towards) more (Ilhan-Mutlu et al. Citation2013, Urbanavičiūtė et al. Citation2020) favourable outcome of grade-IV glioma patients. Of the studies that investigated treatment response, Baumgarten et al., Kiviniemi et al. and Husain et al. showed a significant increase of sGFAP in grade IV patients in the week after surgery (Husain et al. Citation2012, Kiviniemi et al. Citation2015, Baumgarten et al. Citation2018). However, Vietheer et al. showed decreased sGFAP levels in grade IV glioma patients 6-12 weeks after the surgery (Vietheer et al. Citation2017). There is thus a contrast between short-term effects and long-term effects of treatment of grade-IV glioma on sGFAP levels.
Table 2. Overview of survival analyses and other correlations.a
sGFAP levels appear to be affected by the growth dynamics of the tumour, as studies showed that sGFAP correlates to tumour volume (Jung et al. Citation2007, Gállego Pérez-Larraya et al. Citation2014, Kiviniemi et al. Citation2015, Tichy et al. Citation2016, Lyubimova et al. Citation2020), necrotic tumour volume (Kiviniemi et al. Citation2015), number of necrotic cells (Jung et al. Citation2007), and to the Ki67 proliferative index (Kiviniemi et al. Citation2015). A correlation between tumour volume and sGFAP levels was however not confirmed by others (Ilhan-Mutlu et al. Citation2013, Vietheer et al. Citation2017). The relation between tumour tissue GFAP expression and sGFAP levels is not clear, with one study describing higher levels of intratumoral GFAP in the patients with the highest sGFAP levels (Tichy et al. Citation2016), and two studies finding no correlation between the two measures (Jung et al. Citation2007, Kiviniemi et al. Citation2015).
The WHO glioma classification of 2016 includes IDH-1 genotyping, in which an IDH-1 mutation in the tumour tissue is associated with a better prognosis (Verhaak et al. Citation2010, Louis et al. Citation2016). In this meta-analysis, three reports incorporated this classification. Both Kiviniemi et al. and Vietheer et al. measured higher sGFAP levels in glioma grade-IV patients with IDH-1 wild-type (IDHwt) status, compared to glioma grade IV with a IDH-1 mutation (IDHmut) (Kiviniemi et al. Citation2015, Vietheer et al. Citation2017). Urbanaviciute et al. however did not detect differences between the IDHwt and IDHmut groups (Urbanavičiūtė et al. Citation2020). At last, Tichy and colleagues found higher rates of MGMT promotor methylation in patients with high sGFAP levels, but this correlation was not found by Kiviniemi et al (Kiviniemi et al. Citation2015, Tichy et al. Citation2016). Further molecular characterisation of the sGFAP-positive and sGFAP-negative populations remains an important topic for further research.
GFAP protein levels in CSF of glioma patients
Three studies measured the levels of soluble GFAP in CSF (cGFAP) of glioma patients. Using radioimmunoassays, Syzmas et al. showed that the levels of cGFAP were elevated (range 4 − 50 μg/mL) in five patients with gliomas (of which 2 were grade-IV glioma). In this study, no cGFAP levels above 3 μg/mL were detected in the non-glial tumour control group (Szymaś et al. Citation1986). Hayakawa et al. analysed the CSF of 12 grade-IV glioma patients using a similar technique and detected cGFAP levels above 25 ng/mL in eight patients, with cGFAP levels even reaching values above 500 ng/mL in three samples. Elevated cGFAP levels were detected in two out of 10 astrocytoma patients and in none of the two oligodendroglioma patients or eight controls (Hayakawa et al. Citation1980). Both studies noted a large increase in cGFAP levels within the first days after surgery, followed by a gradual decrease (Hayakawa et al. Citation1980, Szymaś et al. Citation1986). Recently, GFAP was also detected in a proteomic screen on CSF samples of glioma patient. Although the overall abundance of the GFAP protein was low, in a small subset of patients the levels surpassed the threshold based on maximum levels measured in control samples. Interestingly, the cGFAP high patients had large, enhancing tumours with direct contact to the ventricles, indicating that tumour location plays a role in cGFAP levels. However, this MRI pattern was also observed in patients with low cGFAP levels. Since the calculated sensitivity levels of cGFAP as a marker for grade IV were low (25.45%), Schmid et al concluded that cGFAP does not appear to be a stable marker for all grade-IV patients, nevertheless it may be clinically relevant for follow-up studies in patients with high levels (Schmid et al. Citation2021).
GFAP protein in extracellular vesicles and circulating cells
Previous studies have not only focussed on soluble GFAP levels in serum and CSF of glioma patients, but also on the presence of GFAP in extracellular vesicles (EVs) and circulating cells, as summarised in . EVs are membrane vesicles that are secreted by cells, including tumour cells, and contain proteins, RNAs and lipids. Larger EVs in the range of 100 to 1000 nm are termed microparticles, whereas vesicles smaller than 100 nm can be referred to as exosomes (Kao and Papoutsakis Citation2019). Blood samples of grade-IV patients contained higher numbers of both GFAP positive microparticles and exosomes in comparison to control samples (Sartori et al. Citation2013, Galbo et al. Citation2017, Lewis et al. Citation2019), or higher levels of GFAP within EVs (Lewis et al. Citation2019). In addition to baseline differences, the number GFAP+ microparticles increase upon surgical resection and show the highest numbers seven months after surgery (Sartori et al. Citation2013). Two of the three studies did not use permeabilization steps in their sample preparation, indicating that the identified GFAP is expressed on the surface of the EVs and can potentially also be picked up by the sELISA and ECL studies described in the earlier meta-analysis. With exception of a single grade-III patient that was included in the exosome study (Galbo et al. Citation2017), GFAP+ EV levels have not been measured in grade II/III; therefore, no conclusions can be drawn about the specificity of increased GFAP+ EV levels for grade-IV glioma.
Table 3. Overview of GFAP measurements in extracellular vesicles and cells.
In addition to EVs, also cells in the circulation of glioma patients are more frequently GFAP positive. Müller and colleagues detected GFAP+ non-haematopoietic (CD45-) cells in 20.6% of blood samples of grade-IV glioma patients, whereas only a single blood sample contained GFAP positive cells in their control population. The authors found no significant difference between patients with primary and recurrent GBM tumours, nor was the presence of GFAP-positive cells linked to overall survival. GFAP-positive cells were, however, more frequently present in blood samples of patients with EGFR gene amplifications (Müller et al. Citation2014). A recent study performed by van den Bossche and colleagues found that the percentage of GFAP-positive CD16+ monocytes are indicative of brain tumours. Increased populations of these cells were found in blood samples of diffuse astrocytomas, oligodendrogliomas, grade-IV gliomas and metastasis patients. The levels of GFAP+ monocytes were directly compared to soluble sGFAP levels, but no correlation was found. Within grade IV patients, abundance of GFAP carrying monocytes correlated to tumour volume and was associated with shorter OS. The authors conclude that levels of GFAP+ CD16+ monocytes cannot be used to distinguish between different glioma grades but have high sensitivity to detect brain lesions in general (van den Bossche et al. Citation2021).
GFAP auto-antibodies and miscellaneous measurements
In addition to GFAP protein measurements in body fluids, also GFAP auto-antibodies have been a focus of research. Ludwig et al. performed a serum auto-antibody screen against a peptide library and GFAP was identified as an informative antigen to discriminate between serum of grade IV gliomas and that of controls (Ludwig et al. Citation2009). Auto-antibodies against GFAP were also identified in a two-dimensional western blot screen performed by Wei and colleagues, where antibodies against GFAP were detected in 5 out 20 patients. Upon further validation within a larger patient population using ELISA, the authors found a significant correlation between tumour grade and GFAP autoantibody levels. GFAP auto-antibodies were significantly elevated in grade-III and grade-IV sera respective of control samples and correlated with tumour volume (Wei et al. Citation2013). Two additional studies on GFAP auto-antibodies showed mixed results. Koszewicz et al. failed to detect GFAP auto-antibodies in a group of 15 grade-IV patients but did detect GFAP reactivity in one of the eight grade II/III glioma patients (Koszewicz et al. Citation2016). Ruutiainen et al. on the other hand did detect elevated GFAP auto-antibodies in both CSF and serum of patients with brain tumours in comparison to the control group (Ruutiainen et al. Citation1981).
Discussion
In this systematic review, we investigated whether GFAP in body fluids can be used as a marker for (high grade) glioma. The majority of the identified studies reported on GFAP protein levels in serum (). In all antibody-based immunoassay studies combined, 62.7% of all grade-IV glioma patients had detectable levels of GFAP in serum, with a median basal level of 0.12 ng/mL (0.06 − 0.18), compared to 12.7% of healthy controls with a median basal level of 0.00 ng/mL (0.00 − 0.00) (). Overall, higher sGFAP is associated with grade-IV glioma and not with lower grades (), and a similar trend is observed for soluble GFAP in CSF. The sGFAP level is not clearly related to patient prognosis of grade-IV patients, but there is evidence for a correlation to tumour volume (). In addition to soluble GFAP levels in body fluids, multiple studies link grade-IV glioma to increased levels of GFAP positive cells, EVs, and auto-antibodies against GFAP (Sartori et al. Citation2013, Müller et al. Citation2014, Galbo et al. Citation2017, Lewis et al. Citation2019, van den Bossche et al. Citation2021).
Quality assessment of meta-analysed papers showed that almost all studies were risk for bias, mostly because authors did not state whether the sGFAP results were interpreted without knowledge of the results of the reference standard, and vice versa (Table S6). It is however unlikely that the histopathological diagnosis of glioma samples was determined with prior knowledge about the level of sGFAP. However, whenever this was not explicitly stated, we had to give an ‘unclear’ assessment. It was difficult to obtain evidence for sGFAP levels in lower-grade glioma. This is probably due to the fact that lower-grade glioma has a lower prevalence in the population.
The funnel plot of sGFAP in grade-IV glioma showed several studies outside of the 95% C.I., which revealed the high heterogeneity we have encountered between studies (Figure S11). One source of heterogeneity could be the different commercial kits that were used to determine the sGFAP levels. Also the fact that studies use different LLODs to determine sGFAP positive and negative samples is a likely source of heterogeneity and a limitation of the meta-analysis. Although most studies used LLODs within a similar range, not every study explicitly stated how the LLOD was determined and whether values below the LLOD were defined as 0 or were taken along as originally measured (Table S3). Other factors likely to contribute to the variability between studies are the heterogeneity of the patient population, the relatively small number of patients included in each study, and the small number of studies in general. The limited number of studies is also reflected in the sensitivity and specificity outcomes. Although the high specificity indicates that an elevation of sGFAP discriminates grade-IV patients from other glioma patients and controls, the sensitivity is limited. In addition, the wide range of the SROC curve () highlights that more studies are needed to conclusively determine sensitivity and specificity. For example, both Ilhan-Mutlu et al. and Vietheer et al. showed a zero median sGFAP level in grade-IV glioma patients, illustrating the large variability in sGFAP levels within the group of GBM patients (). Further investigation into sGFAP positive and negative subgroups of GBM patients is needed to determine the diagnostic value of sGFAP. So far, only three studies determined sGFAP in subgroups of patients classified according to WHO 2016 (Kiviniemi et al. Citation2015, Vietheer et al. Citation2017, Urbanavičiūtė et al. Citation2020), and two of these studies showed that higher sGFAP levels are mainly associated with IDHwt tumours (Kiviniemi et al. Citation2015, Vietheer et al. Citation2017). Integration of additional genetic markers into sGFAP analysis may link the presence of sGFAP to specific molecular subgroups of GBM patients.
Although our meta-analysis shows that the presence of sGFAP is linked to grade-IV glioma, the fact that not all grade-IV patients have sGFAP and that sGFAP is occasionally detected in controls without malignancies makes the usefulness of sGFAP as a biomarker currently uncertain. Large prospective studies will have to determine the sensitivity and specificity of this tool. One clinical challenge in which the utility of sGFAP has not been tested yet, is in the differentiation between high-grade and low-grade non-enhancing tumours. The lack of contrast enhancement, associated with preservation of blood–brain barrier (BBB) integrity, is typically associated with low-grade tumours. Nevertheless, in 30–40% of the cases non-enhancing gliomas are in fact grade-IV tumours, which can lead to an underestimation of the aggressiveness of the tumour and delay in proper diagnosis and treatment (Hu et al. Citation2020). When sGFAP levels are elevated in grade IV irrespective of BBB permeability, sGFAP has the potential to help in the diagnosis of these hidden grade-IV cases. An additional focus should be to monitor sGFAP levels within the sGFAP-positive group over the progression of the disease and in response to different treatment regimes. This may help in determining whether sGFAP levels can be used to monitor therapeutic response or can contribute to the distinction between progression and pseudo-progression.
GFAP is regulated by alternative splicing (Middeldorp and Hol Citation2011) and the ratio between tissue expression levels of two splice variants, GFAPα and δ, correlates to glioma grade (Stassen et al. Citation2017, van Bodegraven et al. Citation2019b). An interesting future strategy is to measure the different GFAP isoforms in serum of grade-IV glioma patients. The binding site of the anti-GFAP antibodies used to detect sGFAP could not be retrieved for all studies, but in the most widely used sELISA kit from BioVendor, the antibody is raised against an epitope in the coil 2B of the rod region of GFAP (AA 312-340) and therefore will pick up several different GFAP isoforms, including GFAPα and GFAPδ. Although measurements of the isoforms separately will not aid in improving the sensitivity issue of sGFAP as a biomarker, measurements of the GFAP isoforms in serum may help in predicting progression-free and overall survival.
Additional studies identified during this systematic review show that not only soluble GFAP levels are altered in grade-IV patients, but also the levels of GFAP-positive EVs and cells (). Since GFAP is a cytosolic protein, the fact that two studies detected GFAP on the surface of exosomes and microparticles is surprising. Surface expression of an IF protein is however not unique for GFAP, as surface vimentin has gained recent attention in respect to circulating gastric cancer cells (Liu et al. Citation2020), and viral infections (Ramos et al. Citation2020). EVs play an important role in tumour cell communication and progression (Becker et al. Citation2016), therefore further investigation into the source and function of GFAP-positive EVs is an interesting focus of research. Since the studies focussing on GFAP in EVs did not include lower-grade glioma patients, it is unknown whether GFAP-positive EVs are specific for grade-IV patients or all glioma patients. In the case of GFAP positive monocytes, however, increased levels were not associated with any specific glioma grade but were rather a sign of brain damage in general (van den Bossche et al. Citation2021).
This systematic review was initially set-up to investigate the presence of all IF proteins in body fluids of glioma patients, but apart from studies on GFAP, studies on other IFs in body fluids of glioma patients are scarce. Heppner et al. measured the levels of serum neurofilament light (NFl) in patients with progressive and stable brain tumours and found increased levels of NFl levels in patients with progressive CNS tumours (Hepner et al. Citation2019). In addition, Ludwig et al. identified auto-antibodies against vimentin in the serum of glioma patients of different grades (Ludwig et al. Citation2009). At last, vimentin was one of the upregulated proteins identified during a proteomic screen on CSF samples of grade-IV glioma patients (Schmid et al. Citation2021). Particularly IF proteins vimentin and nestin are interesting targets to further test as glioma biomarkers, as expression levels of these proteins negatively correlate with progression-free and overall survival in glioma (Wu et al. Citation2015, Lin et al. Citation2016, Lv et al. Citation2017, Zhao et al. Citation2018).
To conclude, this systematic review and meta-analysis shows that the presence of sGFAP is indicative of grade-IV glioma, but the relative low sensitivity currently limits the usefulness as a biomarker for initial diagnosis. Additional studies are needed to determine the whether sGFAP can be detected in high-grade gliomas without contrast enhancements, whether sGFAP monitoring is relevant during disease progression, and to determine the potential of GFAP isoforms and other IF proteins in body fluids as biomarkers for (the follow-up of) grade IV glioma.
ibmk_a_2006313_sm8798.docx
Download MS Word (3.6 MB)ibmk_a_2006313_sm8795.docx
Download MS Word (33.2 KB)Acknowledgments
All authors reviewed and approved the manuscript before submission. We would like to thank Isabel Retel Helmrich for her valuable feedback concerning the data analysis. We would like to acknowledge the KWF for funding.
Disclosure statement
The authors declare no conflict of interest. The funders had no role in the design of the study; in the collection, analyses, or interpretation of data; in the writing of the manuscript, or in the decision to publish the results.
Data availability statement
The data supporting this systematic review and meta-analysis are from previously reported studies and datasets, which have been cited. The processed data are available from the corresponding author E.M.H. upon reasonable request.
Additional information
Funding
References
- Aldape, K., et al., 2019. Statement brain tumours. Nature reviews clinical oncology, 16 (8), 509–520.
- Baumgarten, P., et al., 2018. Pre- and early postoperative GFAP serum levels in glioma and brain metastases. Journal of neuro-oncology, 139 (3), 541–546.
- Becker, A., et al., 2016. Extracellular vesicles in cancer: cell-to-cell mediators of metastasis. Cancer cell, 30 (6), 836–848.
- Bodegraven, E. J. v., et al., 2019a. GFAP Alternative splicing regulates glioma cell-ECM interaction in a DUSP4-dependent manner. FASEB journal : official publication of the federation of american societies for experimental biology, 33 (11), 12941–12959.
- Bodegraven, E. J. v., et al., 2019b. Importance of GFAP isoform-specific analyses in astrocytoma. Glia, 67 (8), 1417–1433.
- Bossche, W. B. L. v d., TiMaScan Research Group., et al., 2021. Monocytes carrying GFAP detect glioma, brain metastasis and ischaemic stroke, and predict glioblastoma survival. Brain communications, 3 (1), fcaa215.
- van den Bossche, W.B.L., et al., 2021. Monocytes Carrying GFAP Detect Glioma, Brain Metastasis and Ischaemic Stroke, and Predict Glioblastoma Survival. Brain communications, 3 (1), 1–12.
- Brommeland, T., et al., 2007. Serum levels of glial fibrillary acidic protein correlate to tumour volume of high-grade gliomas. Acta neurologica scandinavica, 116 (6), 380–384.
- Chung, B-m., Rotty, J.D., and Coulombe, P.A., 2013. Networking galore: intermediate filaments and cell migration. Current opinion in cell biology, 25 (5), 600–612.
- Doebler, Philipp, and Heinz Holling. 2015. “Meta-Analysis of Diagnostic Accuracy with Mada.” 2015. https://cran.r-project.org/package=mada.
- Etienne-Manneville, S., 2018. Cytoplasmic intermediate filaments in cell biology. Annual review of cell and developmental biology, 34 (1), 1–28. annurev-cellbio-100617-062534.
- Galbo, P.M., et al., 2017. Circulating CD9+/GFAP+/survivin + exosomes in malignant glioma patients following survivin vaccination. Oncotarget, 8 (70), 114722–114735.
- Gállego Pérez-Larraya, J., et al., 2014. Diagnostic and prognostic value of preoperative combined GFAP, IGFBP-2, and YKL-40 plasma levels in patients with glioblastoma. Cancer, 120 (24), 3972–3980.
- Hayakawa, T., et al., 1980. Levels of astroprotein (an astrocyte-specific cerebroprotein) in cerebrospinal fluid of patients with brain tumors. an attempt at immunochemical diagnosis of gliomas. Journal of neurosurgery, 52 (2), 229–233. https://www.ncbi.nlm.nih.gov/pubmed/7351563.
- Hepner, A., et al., 2019. Serum neurofilament light, glial fibrillary acidic protein and tau are possible serum biomarkers for activity of brain metastases and gliomas. World journal of oncology, 10 (4-5), 169–175.
- Hohmann Dehghani, 2019. The cytoskeleton—a complex interacting meshwork. Cells, 8 (4), 362.
- Hol, E.M., and Pekny, M., 2015. Glial fibrillary acidic protein (gfap) and the astrocyte intermediate filament system in diseases of the central nervous system. Current opinion in cell biology, 32, 121–130.
- Hu, L.S., et al., 2020. Imaging of intratumoral heterogeneity in high-grade glioma. Cancer letters, 477, 97–106.
- Husain, H., et al., 2012. Pre- and post-operative plasma glial fibrillary acidic protein levels in patients with newly diagnosed gliomas. Journal of neuro-oncology, 109 (1), 123–127. https://www.ncbi.nlm.nih.gov/pubmed/22492246.
- Ilhan-Mutlu, A., et al., 2013. Exploratory investigation of eight circulating plasma markers in brain tumor patients. Neurosurgical review, 36 (1), 45–56.
- Jung, C.S., et al., 2007. Serum GFAP is a diagnostic marker for glioblastoma multiforme. Brain, 130 (12), 3336–3341.
- Kao, C.-Y., and Papoutsakis, E.T., 2019. Extracellular vesicles: exosomes, microparticles, their parts, and their targets to enable their biomanufacturing and clinical applications. Current opinion in biotechnology, 60, 89–98.
- Kiviniemi, A., et al., 2015. Serum levels of GFAP and EGFR in primary and recurrent high-grade gliomas: correlation to tumor volume, molecular markers, and progression-free survival. Journal of neuro-oncology, 124 (2), 237–245.
- Koszewicz, M., et al., 2016. Is peripheral paraneoplastic neurological syndrome possible in primary brain tumors? Brain and behavior, 6 (6), e00465. https://www.ncbi.nlm.nih.gov/pubmed/27186442.
- Lange, R.P., et al., 2014. Evaluation of eight plasma proteins as candidate blood-based biomarkers for malignant gliomas. Cancer investigation, 32 (8), 423–429.
- Lewis, J., et al., 2019. A pilot proof-of-principle analysis demonstrating dielectrophoresis (dep) as a glioblastoma biomarker platform. Scientific reports, 9 (1), 1–10.
- Lin, L., et al., 2016. Analysis of expression and prognostic significance of vimentin and the response to temozolomide in glioma patients. Tumour biology: the journal of the international society for oncodevelopmental biology and medicine, 37 (11), 15333–15339.
- Liu, M., et al., 2020. Prognostic significance of PD-L1 expression on cell-surface vimentin-positive circulating tumor cells in gastric cancer patients. Molecular oncology, 14 (4), 865–881.
- Louis, D.N., et al., 2016. The 2016 world health organization classification of tumors of the central nervous system: a summary. Acta neuropathologica, 131 (6), 803–820.
- Ludwig, N., et al., 2009. Improving seroreactivity-based detection of glioma. Neoplasia ( neoplasia.), 11 (12), 1383–1389. https://www.ncbi.nlm.nih.gov/pubmed/20019846.
- Lv, D., et al., 2017. Nestin expression is associated with poor clinicopathological features and prognosis in glioma patients: an association study and meta-analysis. Molecular neurobiology, 54 (1), 727–735.
- Lyubimova, N.V., et al., 2011. Neurospecific proteins in the serum of patients with brain tumors. Bulletin of experimental biology and medicine, 150 (6), 732–734.
- Lyubimova, N.V., et al., 2020. Glial fibrillary acidic protein in the diagnosis and prognosis of malignant glial tumors. Bulletin of experimental biology and medicine, 168 (4), 503–506.
- Mandrekar, J.N., 2010. Receiver operating characteristic curve in diagnostic test assessment. Journal of thoracic oncology: official publication of the international association for the study of lung cancer, 5 (9), 1315–1316.
- Mittler, M.A., Walters, B.C., and Stopa, E.G., 1996. Observer reliability in histological grading of astrocytoma stereotactic biopsies. Journal of neurosurgery, 85 (6), 1091–1094.
- McGrath, S., et al., 2020. Meta-analysis of the difference of medians. Biometrical journal. Biometrische zeitschrift, 62 (1), 69–98.
- Messing, A., and Brenner, M., 2020. GFAP at 50. ASN neuro, 12, 1759091420949680.
- Middeldorp, J., and Hol, E.M., 2011. GFAP in health and disease. Progress in neurobiology, 93 (3), 421–443.
- Moher, D., et al., PRISMA Group. 2009. Preferred reporting items for systematic reviews and meta-analyses: the PRISMA statement. BMJ (clinical research ed.), 339, b2535.
- Müller, C., et al., 2014. Cancer: hematogenous dissemination of glioblastoma multiforme. Science translational medicine, 6 (247), 1–10.
- Neagu, M.R., et al., 2015. How treatment monitoring is influencing treatment decisions in glioblastomas. Current treatment options in neurology, 17 (4), 343.
- Ostrom, Q.T., et al., 2019. CBTRUS statistical report: primary brain and other central nervous system tumors diagnosed in the United States. Journal of neuro oncology 21, 1–100.
- Ouzzani, M., et al., 2016. Rayyan-a web and mobile app for systematic reviews. Systematic reviews, 5 (1), 210.
- De Pascalis, C., et al., 2018. Intermediate filaments control collective migration by restricting traction forces and sustaining cell–cell contacts. Journal of cell biology, 217 (9), 3031–3044. jcb.201801162.
- R Core Team. 2013. “R: A Language and Environment for Statistical Computing.” Vienna, Austria: R Foundation for Statistical Computing. http://www.r-project.org/.
- Ramos, I., et al., 2020. Vimentin as a multifaceted player and potential therapeutic target in viral infections. International journal of molecular sciences, 21 (13), 4675.
- Reitsma, J.B., et al., 2005. Bivariate analysis of sensitivity and specificity produces informative summary measures in diagnostic reviews. Journal of clinical epidemiology, 58 (10), 982–990.
- Rohatgi, A. 2020. “WebPlotDigitizer.” Pacifica, California, USA. https://automeris.io/WebPlotDigitizer.
- Ruutiainen, J., et al., 1981. Measurement of glial fibrillary acidic protein (GFAP) and anti-GFAP antibodies by solid-phase radioimmunoassays. Acta Neurol Scand, 63 (5), 297–305. https://doi.org/https://doi.org/10.1111/j.1600-0404.1981.tb00783.x.
- Sartori, M.T., et al., 2013. Circulating microparticles of glial origin and tissue factor bearing in high-grade glioma: a potential prothrombotic role. Thrombosis and haemostasis, 110 (2), 378–385.
- Schmid, D., et al., 2021. Diagnostic biomarkers from proteomic characterization of cerebrospinal fluid in patients with brain malignancies. Journal of neurochemistry, 158 (2), 522–538.
- Sharma, P., et al., 2019. Intermediate filaments as effectors of cancer development and metastasis: a focus on keratins, vimentin, and nestin. Cells, 8 (5), 497.
- Shemilt, M., et al., 2019. Prognostic value of glial fibrillary acidic protein in patients with moderate and severe traumatic brain injury: a systematic review and meta-analysis. Critical care medicine, 47 (6), e522–29.
- Shih, C.C., et al., 2017. Pretreatment serum lactate level as a prognostic biomarker in patients undergoing supratentorial primary brain tumor resection. Oncotarget, 8 (38), 63715–63723.
- Skalli, O., et al., 2013. Astrocytoma grade IV (glioblastoma multiforme) displays 3 subtypes with unique expression profiles of intermediate filament proteins. Human pathology, 44 (10), 2081–2088.
- Stassen, O.M.J.A., et al., 2017. GFAPδ/GFAPα ratio directs astrocytoma gene expression towards a more malignant profile. Oncotarget, 8 (50), 88104–88121.
- Szymaś, J., Morkowski, S., and Tokarz, F., 1986. Determination of the glial fibrillary acidic protein in human cerebrospinal fluid and in cyst fluid of brain tumors. Acta neurochirurgica, 83 (3-4), 144–150. https://www.ncbi.nlm.nih.gov/pubmed/3812039.
- The U.S. Food and Drug Administration 2018. “FDA Authorizes Marketing of First Blood Test to Aid in the Evaluation of Concussion in Adults.” 2018. https://www.fda.gov/news-events/press-announcements/fda-authorizes-marketing-first-blood-test-aid-evaluation-concussion-adults.
- Tichy, J., et al., 2016. Prospective evaluation of serum glial fibrillary acidic protein (GFAP) as a diagnostic marker for glioblastoma. Journal of neuro-oncology, 126 (2), 361–369.
- Urbanavičiūtė, R., Skauminas, K., and Skiriutė, D., 2020. The evaluation of AREG, MMP-2, CHI3L1, GFAP, and OPN serum combined value in astrocytic glioma patients’ diagnosis and prognosis. Brain sciences, 10 (11), 872.
- Verhaak, R.G.W., et al., Cancer Genome Atlas Research Network. 2010. Integrated genomic analysis identifies clinically relevant subtypes of glioblastoma characterized by abnormalities in PDGFRA, IDH1, EGFR, and NF1. Cancer cell, 17 (1), 98–110.
- Viechtbauer, W., 2010. Conducting meta-analyses in R with the metafor package. Journal of statistical software, 36 (3), 1–48.
- Vietheer, J.-M., et al., 2017. Serum concentrations of glial fibrillary acidic protein (GFAP) do not indicate tumor recurrence in patients with glioblastoma. Journal of neuro-oncology, 135 (1), 193–199.
- Waskom, M., et al., 2020. Mwaskom/Seaborn: V0.11.1. Zenodo, 2020. https://doi.org/http://doi.org/10.5281/zenodo.4379347.
- Wei, P., et al., 2013. Serum GFAP autoantibody as an ELISA-detectable glioma marker. Tumour biology : the journal of the international society for oncodevelopmental biology and medicine, 34 (4), 2283–2292. https://www.ncbi.nlm.nih.gov/pubmed/23589055.
- Whiting, P.F., et al., QUADAS-2 Group. 2011. QUADAS-2: a revised tool for the quality assessment of diagnostic accuracy studies. Annals of internal medicine, 155 (8), 529–536.
- Wickham, H., 2016. Ggplot2: elegant graphics for data analysis. Springer-Verlag, New York. https://ggplot2.tidyverse.org.
- Wu, B.C., et al., 2015. Do relevant markers of cancer stem cells CD133 and nestin indicate a poor prognosis in glioma patients? A systematic review and meta-analysis. Journal of experimental and clinical cancer research, 34 (1), 1–12.
- Yong, R.L., and Lonser, R.R., 2013. Safety of closed brain biopsy: population-based studies weigh in. World neurosurgery, 79(1), 53–54.
- Zhao, J., et al., 2018. High expression of vimentin is associated with progression and a poor outcome in glioblastoma. Applied immunohistochemistry and molecular morphology, 26 (5), 337–344.