
ABSTRACT
Climate change is disrupting the fundamental conditions of human life and exacerbating existing inequity by placing further burdens on communities that are already vulnerable. Risk exposure varies by where people live and work. In this article, we examine the spatial overlap of the compound risks of COVID-19 and extreme heat in New York City. We assess the relationship between socio-demographic and natural, built and social environmental characteristics, and the spatial correspondence of COVID-19 daily case rates across three pandemic waves. We use these data to create a compound risk index combining heat, COVID-19, density and social vulnerability. Our findings demonstrate that the compound risk of COVID-19 and heat are public health and equity challenges. Heat and COVID-19 exposure are influenced by natural, built, and social environmental factors, including access to mitigation infrastructure. Socio-demographic characteristics are significant indicators of COVID-19 and heat exposure and of where compound vulnerability exists. Using GIS mapping, we illustrate how COVID-19 risk geographies change across the three waves of the pandemic and the particular impact of vaccinations before the onset of the third wave. We, then, use our compound risk index to assess heat interventions undertaken by the City, identify neighborhoods of both adequate and inadequate coverage and provide recommendations for future interventions.
1. Introduction
Climate change and the COVID-19 pandemic are disrupting the fundamental conditions of human life and exacerbating existing inequities by placing further burdens on communities that are already vulnerable. Some are better positioned and resourced to adapt to or avoid the worst impacts of climate change, while others find their homes becoming uninhabitable, their livelihoods vanishing and their health and security threatened (Islam and Winkel Citation2017; King and Harrington Citation2018; Oppenheimer et al. Citation2022). The overlapping nature and multiplicity of risks associated with climate change are captured in the concept of “riskscapes”, a term that calls attention to interactions among risks, or potential dangers and harms, such as exposure to natural environmental harms like extreme heat and flooding, built and social environmental risks such as inadequate or crowded housing and social risk, such as lack of access to social support and economic opportunity (Neisser and Müller-Mahn Citation2017; Davies et al. Citation2020). Vulnerable neighbourhoods are disproportionately exposed to elevated risks and cumulative impact across several dimensions of human life and the biophysical environment (Liévanos Citation2020; Renn Citation2008).
Exposure to risk varies by where people live, work and the multiplicity of other contexts in which they engage in social interaction. Too often, however, these risks have been studied in isolation. For example, heightened environmental exposure is studied separately from elevated exposure to crime, elevated exposure to health risks is studied without concern for heightened economic risks and so forth (Müller-Mahn, Everts, and Stephan Citation2018). Studying riskscapes enables an understanding of the origins, interdependencies and spillovers between risk clusters that operate on multiple spatial scales from the local to the global as well as the factors that sustain risk (Beck Citation2012; Renn Citation2008). For example, the COVID-19 crisis has had substantial interwoven health, economic, political and social implications as well as simultaneous interactions with the changing climate. Responding to climate change and COVID-19 requires a consideration of the complexities, nuances and place-specificities of riskscapes.
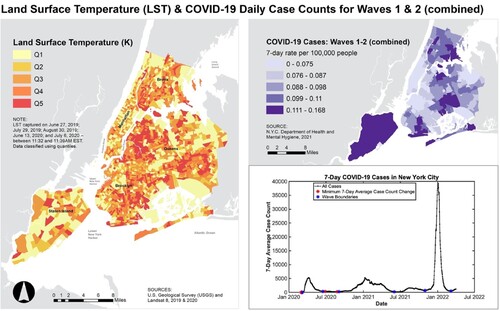
In this paper, we explore the combined factors that are spatially associated with both high temperature and COVID-19, two major stresses on New York City (NYC) neighbourhoods, as well as the interventions that the NYC government has undertaken to respond to them. Our analysis is spatial and seeks to identify places of highest risk and show the ways multiple hazards impact general social vulnerabilities which are also tied to place. Specifically, social, environmental and built structural factors interact and overlap in specific places. shows a map of NYC land surface temperature (LST) averaged across June, July and August 2019 and 2020 as captured by Landsat 8; first and second COVID-19 waves mapped; and the daily cases counts of COVID-19 from February 2020 to February 2022.
Figure 1. New York City land surface temperature (LST) and COVID-19 mapped for combined Waves 1 and 2, and graph of COVID-19 case counts showing Waves 1, 2 and 3 from February 2020 to February 2022. COVID-19 waves are defined as the periods between days with no change in 7-day case counts.
We focus our analysis on geographies of exposure and interventions to identify riskscapes that incorporate diverse viewpoints on the threats of loss across NYC (Davies et al. Citation2020; Morello-Frosch and Shenassa Citation2006). Our study seeks to determine whether the neighbourhoods most impacted by COVID-19 are also more exposed to the compound risks of high levels of extreme heatFootnote1 and whether interventions have targeted the most vulnerable neighbourhoods. In recognising the roles that both physical and social factors play in shaping risk (Davies et al. Citation2020; Locke et al. Citation2021; Nayak et al. Citation2019; Ortiz et al. Citation2022), we assess the relationships between a range of environmental, built and social infrastructure and socio-demographic characteristics and the spatial correspondence of heat and COVID-19 case rates across three waves of the pandemic – spanning 2020–2022.
We use these data to create a compound risk index that combines heat, COVID-19, density and social vulnerability from factor analysis of natural environment characteristics, built and social environmental characteristics and social factors. We then use this compound risk index to assess heat interventions undertaken by NYC and examine areas where existing policies provide adequate coverage as well as areas of shortfall. The compound risk index could be used by NYC policymakers to inform efforts to reduce exposure to both heat and COVID-19 in the most vulnerable neighbourhoods. The results could also provide insight into other cities and broader geographies.
The article proceeds in five sections. In Section 2, we provide background on heat and COVID-19 exposure in NYC and describe physical and social factors such as urban density, ethnicity and access to greenspace and cooling centres that influence compound risk. In Section 3, we present the datasets and methods used to conduct our analysis. In Section 4, we discuss key findings of the factor and regression analysis and the efficacy of city-wide interventions. Finally, in Section 5 we review key conclusions and make recommendations for improving policy and future research.
2. Heat exposure, COVID-19, physical and social factors and interventions
2.1. Heat exposure and COVID-19 in New York City
Between the summers of 2010–2018, there were on average 100 heat-exacerbated deaths in New York City, disproportionately impacting vulnerable communities like the elderly, those with health conditions and those in low-income, Black and Brown communities (Kaiser Family Foundation Citation2022; NYC Environmental Health Citation2021). Studies increasingly show the impacts of climate change and extreme weather events like heat waves disproportionately affect low-income populations, the elderly, children and ethnic minorities (Patz et al. Citation2000; Reckien et al. Citation2018). Currently, the government of NYC estimates heat vulnerability based on a study by Madrigano et al. (Citation2015), from which it developed a heat vulnerability index (HVI) using measures including land surface temperature (LST), green space, access to home air conditioning and the percentage of residents who are low-income or non-Latinx Black (NYC Environmental Health Citation2021). Our index has been inspired by the HVI index created by Madrigano et al. and the City. We seek to provide a complementary index utilising a geographic assessment of risk built from spatial correlation. For the heat data, we have also utilised a LST dataset that sampled Landsat data from all days during summers 2019 and 2020 that passed quality control, rather than just a single day. However, LST data from all summer days were used instead of only from the hottest day, or an extreme heat event, to capture possible variation in LST spatial distribution between hot days. In addition, we include spatially-associated risk factors related to the social and built environment, such as density, which provide a deeper understanding of the areas most exposed to heat. Finally, we further evaluate the role of interventions, making our index a complementary tool for policy decision making.
Climate change is expected to increase the frequency and intensity of both extreme heat waves and non-extreme hot days, contributing to higher heat-related morbidity and mortality; climate change projections show communities in the Northeastern USA, low-income populations, the elderly and children will be among groups the most vulnerable to these health effects (Madrigano et al. Citation2015; McGeehin and Mirabelli Citation2001; O’Neill and Ebi Citation2009; Patz et al. Citation2000; Reckien et al. Citation2018; Rosenzweig et al. Citation2009). Specifically in NYC, climate change is projected to increase summer heat-related premature mortality by an estimated 70% by the 2050s compared to the 1990s, even with acclimatisation efforts like cooling shelters and heat alerts (Knowlton et al. Citation2007). The NYC Panel on Climate Change found that increasing temperatures and heat waves and coastal storms and flooding are the principal climate hazards posing health risks to NYC and the surrounding region (Kinney et al. Citation2015), while a CDC report based on data between 2000 and 2011 estimated that 447 heat-related emergency department visits, 152 hospital admissions and 13 deaths occurred annually in NYC (CDC Citation2013). Previous studies have shown that NYC heat-related mortality, like that related to COVID-19, disproportionately impacts neighbourhoods that are predominantly low-income and communities of colour (Kinney et al. Citation2015; Madrigano et al. Citation2015; NYC Council Citationn.d.; NYC Department of Health Citationn.d.; NYC Environmental Health Citation2021; Rosenthal et al. Citation2014). The NYC Council Heat and Cooling Equity map (NYC Council Citationn.d.) shows that residents in the Brownsville, Jamaica, Rockaways, East Tremont and Mott Haven/Hunts Point neighbourhoods experience the highest levels of extreme heat, high comorbidity and relatively less access to air conditioning.
High temperature, especially accompanied by low humidity, has been correlated with increased daily cases and deaths of COVID-19 (Bock et al. Citation2021; Meo et al. Citation2020a, Citation2020b; Ortiz et al. Citation2022; Wilhelmi et al. Citation2021). Ortiz et al. (Citation2022) created a multi-hazard risk framework to map areas in which urban heat island (UHI) extremes, social vulnerability and COVID-19 infection rates overlapped in NYC, finding several multi-hazard risk hot spots in which high social vulnerability, COVID-19 cases and temperatures coincided. Wilhelmi et al. (Citation2021) found that millions of people in the USA had difficulty responding to or coping with extreme heat due to direct or indirect effects of COVID-19, and the groups most vulnerable to this compound risk included low-income people, women, the unemployed and racial and ethnic minorities. Moreover, Bock et al. (Citation2021) demonstrate how COVID-19 in NYC compounded the risk of heat-related health impacts as people were forced to isolate at home and how inequitable access to cooling centres, air conditioning and green space compounded social vulnerabilities by making low-income minority populations the most vulnerable.
Heat adaptation strategies used in the USA prior to the pandemic, such as heat warnings or cooling centres, were either diminished by stay-at-home orders or compounded the risk of COVID-19 exposure and were thus ineffective in protecting populations from heat-related health impacts (Bose-O’Reilly et al. Citation2021; Jin and Sanders Citation2022; Martinez et al. Citation2020). This risk is exacerbated by unequal access to air conditioning systems or poor housing quality, which burdens low-income and minority populations, who, if leaving their homes to visit cooling centres, are at higher risk for COVID-19 exposure (Boateng et al. Citation2021; Martinez et al. Citation2020). The growing research demonstrates the compound risks of heat and COVID-19 and the lack of adequate protection against both for many citizens, across the USA but particularly in NYC, reinforcing the need for additional analysis that facilitates targeted interventions by identifying which NYC neighbourhoods are most vulnerable.
2.2. Natural environment and access to green space
The natural and built environments do not generate risks in isolation. Rather, risks are generated through use and access to different features of these environments. For example, a number of studies demonstrate that disadvantaged communities have the least access to green space like trees and parks, partially resulting from systemic disinvestment in minority, low-income areas (Locke et al. Citation2021; Mitchell and Chakraborty Citation2018; Wilson Citation2020). Hoffman et al. (Citation2020) found that formerly redlined areas in the USA show consistently higher temperatures partially due to a lack of trees and green space, while Locke et al. (Citation2021) mapped historically redlined areas to the lowest percentage of tree canopy cover. These effects are systematic and embedded through years of discriminatory policies that draw investment away from these neighbourhoods.
2.3. Role of density
The social conditions of built infrastructure are also significant to understanding risk and vulnerability. For example, city density has been linked with COVID-19 infection and mortality rates (Davies et al. Citation2020; Dong et al. Citation2020). In particular, severe rental overcrowding, exacerbated by evictions during the pandemic, was documented as causing higher COVID-19 infection rates, compounding the disproportionate impacts of COVID-19 on lower-income populations and people of colour (Benfer et al. Citation2021). Harlem (Citation2020) finds that severe overcrowding is one of the factors leading to extremely high COVID-19 cases in Queens, NYC alongside lower educational status and less access to healthcare. Dasgupta (Citation2020) also demonstrates that in the USA, high-density housing structures and crowded housing units were at higher risk for turning into COVID-19 infection hotspots. In our study, we integrate analysis of density, but further qualify density into different types, mixed density and rental overcrowding. From a risk standpoint, Midtown, Manhattan, which has very dense built infrastructure consisting of mostly high-rise elevator buildings, is not the same as Corona, Queens, which has less dense physical infrastructure mostly characterised by detached single-family housing and low-rise walk-up buildings, but very high rental crowding. These factors correlate with differential heat and COVID-19 impact.
2.4. Systemic inequities
Disproportionate health impacts from urban heat island (UHI) are compounded by social patterns and a (lack of) social capital like social community networks, social norms and cultural behaviours, demonstrating the compound risk of heat and social vulnerability (Guardaro, Hondula, and Redman Citation2022; Rydin et al. Citation2012, Guardaro et al. Citation2022). Social determinants of health like income, education and race/ethnicity, among other socio-demographic and -economic factors, significantly influence temporal and regional variations in health, including vulnerability to climate change impacts like heat (Arthurson and Baum Citation2015; Gu et al. Citation2020). Consistently, those exposed to the highest land surface temperatures (LST) and who experience the most heat-related hospital visits are “disadvantaged communities” as defined by New York State’s (NYS) Climate Act and approved by the NYS Climate Justice Working Group, and comprised of low-income, minority residents with high exposure to environmental hazards and/or living in formerly redlined neighbourhoods (Bill S6599 Citation2019; Hoffman, Shandas, and Pendleton Citation2020; Li et al. Citation2022; Mitchell and Chakraborty Citation2018; New York State Citation2021; Wilson Citation2020). Moreover, Wallace and Wallace (Citation1990) demonstrate a connection between health disparities and the deliberate withdrawal of City services from African American and Latino communities during the 1970s, particularly in the Bronx. These patterns of historic disinvestment still impact healthcare access for those communities today. Bolitho and Miller (Citation2017) propose a social vulnerability approach rather than a risk management approach to reducing the impacts of extreme heat given the underlying social causes of certain populations’ chronic, long-term vulnerability to heat from factors like lack of housing quality and lack of access to green space. Guardaro et al. (Citation2022) similarly utilise a social capital approach to identifying urban heat indicators, finding that social factors like trust and reciprocity, personal relationships and community engagement impact communities’ levels of resilience to urban heat.
Numerous studies have illuminated the socioeconomic disparities and inequalities of COVID-19 infection and mortality rates (Dasgupta Citation2020; Kaiser Family Foundation Citation2022; Karaye and Horney Citation2020; Nayak et al. Citation2020; Wilhelmi et al. Citation2021). Dasgupta (Citation2020) found that USA counties with a higher percentage of racial and ethnic minority residents were at higher risk for COVID-19 morbidity and mortality. Specifically, Black, Hispanic and American Indian and Native Alaskan people experience a disproportionate number of COVID-19 cases and deaths and are at least twice as likely as White individuals to die of COVID-19 (Kaiser Family Foundation Citation2022). Karaye and Horney (Citation2020) also found social vulnerability indicators like minority status and language, household composition and transportation, and housing and disability impact access to adequate medical care and nutrition, are predictors for COVID-19 case counts in the USA including disproportionate rates of COVID-19 infection and mortality in morbidity. Overall, studies highlight the ways existing systemic inequities exacerbate the disproportionate burden of COVID-19 on low-income, minority communities (Gaynor and Wilson Citation2020; Wilhelmi et al. Citation2021).
2.5. Interventions
Urban green infrastructure is a critical strategy for addressing urban heat and can deliver co-benefits for physical and mental health (Aram et al. Citation2019; Lai et al. Citation2019; Norton et al. Citation2015). Urban parks and trees are particularly effective green infrastructure interventions for urban cooling, and larger parks have the highest effect in both cooling intensity (effect on surrounding areas) and cooling distance (range of cooling beyond the park area) (Aram et al. Citation2019; Feyisa, Dons, and Meilby Citation2014; Zölch et al. Citation2016). Moreover, parks have a higher cooling effect on urban heat island in dense areas if they have higher canopy cover; more dense, complex and diverse vegetation; and a higher number of water bodies (Aram et al. Citation2019; Feyisa, Dons, and Meilby Citation2014; Xu et al. Citation2017). Cooling centres can also help mitigate heat risk impact, though access to cooling centres can also be limited for more vulnerable populations based on lack of transportation proximity, disability and lack of risk awareness (Nayak et al. Citation2019).
Context and community-based planning interventions targeted towards disadvantaged communities experiencing the highest heat risk can promote more equitable distribution of green space and cooling centres, supporting increased cooling effects for the most vulnerable populations (Groulx et al. Citation2021; Nayak et al. Citation2019; Norton et al. Citation2015; Ruiz-Luna et al. Citation2019). In time, risks, inadequate income, poor quality housing, lack of public facilities and lack of access to green space compound. Studies have, for example, demonstrated that the lack of access to quantity and quality of green spaces links to low-income, high-vulnerability residents feeling hotter in the summer, a “heat injustice” that could be corrected with more targeted allocation of green space and cooling facilities to more vulnerable areas (Burbidge et al. Citation2022; Mitchell and Chakraborty Citation2018).
3. Methods
3.1. Data
To understand the compound riskscape at the neighbourhood scale across NYC, we analysed spatial associations of the built environment, proximity to and typology of parks and socio-economic data with heat exposure (surface temperature) and COVID-19 cases. Across the data, which are drawn from multiple sources, census tract is the common unit of analysis. In addition, even though we are pursuing spatial rather than temporal correlation, we sought to maintain comparable time-spans of data proximate to the 2020–2022 COVID-19 pandemic. For census tracts, we rely on the 5-year 2014–2018 estimates from the American Community Survey (ACS). Census tracts have undoubtedly experienced some transition since the data were collected; however, we rely on the fact that factors such as racial composition, education and income level tend to be relatively stable over time.
Our results are consistent with the communities documented as “disadvantaged communities” according to the criteria proposed by the NYS Climate Justice Working Group created “to ensure that frontline and otherwise underserved and disproportionately burdened communities benefit from the state’s historic transition to cleaner, greener sources of energy, reduced pollution and cleaner air, and economic opportunities” (New York State Citation2021). Nevertheless, the data compared are by no means meant to reveal causal trends, but rather the spatial correspondence of proximate risk factors. Similarly, with our factor and regression analysis, we do not seek to provide a causal or predictive model, but rather seek to identify spatial trends in the relationships between heat-exposure and COVID case rates, as well as an understanding of the attributes of the places with the highest risk. The full list of the 30 variables used in this analysis is provided in Appendix 1.
We use Landsat data to assess heat but evaluate LST on all days during the summers of 2019 and 2020 that satisfy a quality control. Our heat assessment focuses on satellite data and purely on heat exposure potential, which we conceptualise as the potential to experience high temperatures in the city, particularly during summer months. We augment these data with attributes of the natural and built environment, incorporating measures for vegetation cover and building density as well as social environmental factors such as density type (rental crowding or mixed residential and commercial density, see Supplementary Table 2 for additional detail) and access to parks and green space and public cooling facilities. We assess vulnerability spatially, from correlates of census tracts, and include socio-demographic measures from census data including education, income and race. After examining physical, built and social correlates of heat exposure, we combine this assessment with correlation analysis of the spatial distribution of COVID-19 across the three prominent waves from 2020 to 2022.
3.1.1. Heat
Land surface temperature (LST) from the summer months (June, July and August) of 2019 and 2020 was used as a proxy for heat during the COVID-19 pandemic, which is a function of air temperature and humidity. While the exact relationship between heat and surface temperature is complex, higher surface temperatures generally correlate with higher heat, so LST is often used to understand urban heat at the city scale (Ho et al. Citation2016; Krüger Citation2017; Unger et al. Citation2010). Census tract mean summer daytime surface temperature was calculated from Landsat 8 TIRS provisional surface temperature images of NYC for 27 June 2019, 29 July 2019, 30 August 2019, 13 June 2020 and 6 July 2020 (Cook Citation2014; Cook et al. Citation2014). These dates were selected as they are the only Landsat 8 images of NYC for the summers of 2019 and 2020 with less than 10% cloud cover and no striping, which causes data loss. All Landsat scenes of New York City were captured at a 30-meter resolution between 11:32 and 11:39 AM Eastern Standard Time from Landsat 8 path 13 and row 32 and were obtained from the US Geological Survey’s EarthExplorer website (US Geological Survey Citationn.d.).
Quality assessment was performed by removing all pixels that contained clouds, and thus abnormally low surface temperature data, based on the Landsat 8 pixel quality assessment file (PIXELQA) (U.S. Landsat Collection 1 (C1) Analysis Ready Data (ARD) Data Format Control Book (DFCB) 2019). If any part of a census tract was missing data for a certain day, no mean surface temperature was calculated for that census tract for that day to avoid bias from capturing only a part of the census tract.
3.1.2. COVID-19
NYC was one of the original “hotspots” for the coronavirus pandemic in the United States, experiencing some of the highest case rates in the world. In early March 2020, the presence of the COVID-19 virus exponentially increased in NYC, with case rates rising to a 7-day averageFootnote2 of 5,921 confirmed cases per day on 6 April 2020 (NYC Department of Health and Mental Hygiene Citation2021). The second wave began on 2 September 2021 and lasted until 3 June 2021, reaching a maximum on 8 January 2021 with 5246 confirmed cases (NYC Department of Health and Mental Hygiene Citation2021). The pandemic continued into Spring 2022 with a subsequent Omicron wave occurring between 31 October 2021 and 8 March 2022.
As seen in , case rates have varied significantly across the three waves. However, it is important to note that many factors changed as the pandemic (including predominant strains of the virus) and public health responses evolved. The first COVID-19 wave was a summer wave, making the correspondence of heat and COVID-19 risk more prominent. The second wave can be characterised by standardised mask and social distancing mandates, increased testing and vaccination roll-out. See for a further assessment of the COVID-19 waves, City intervention and associated start and end dates.
Table 1. Timeline of COVID-19 waves and interventions in New York City.
For these reasons, we assess spatial correlates of COVID-19 and corresponding physical and social factors across the three waves independently. We assume relative spatial consistency of viral conditions within each wave (strain predominance is at least city wide) in order to understand relative spatial variations in case counts within each wave to assess the relative risk or vulnerability of geographies within the city. We combine Waves 1 and 2 for some analyses because they occurred before the major intervention of vaccination.
COVID-19 case rates during three waves of COVID-19 peaks were used as a proxy for COVID-19 exposure. The boundaries of the waves were defined as the days on which the number of 7-day cases did not change. Only confirmed positive cases were used, defined by NYC Health as a positive result from a molecular test, such as a PCR test (NYC Department of Health and Mental Hygiene Citation2021). COVID-19 data was accessed through the NYC Department of Health and Mental Hygiene’s online data repository on 15 August 2021. These data are collected and organised geographically based on patients’ home addresses aggregated to MODZCTA geography, which are modified versions of the NYC ZIP Code Tabulation Areas (NYC Department of Health and Mental Hygiene Citation2021). Data include NYC residents and internationals who are being treated in NYC.
The COVID-19 data were disaggregated to the census tract geography, as shown in Supplementary Figure 1. We used the derived case rate (case count divided by the estimated 2018 ACS census tract population) as the basis of our analysis so that the data were normalised by population. Using case rates rather than death rates avoids accounting for co-morbidities, which can be influenced by many factors beyond COVID-19 and the environment in which a person lives. We focused on confirmed cases rather than deaths because we were interested in the community characteristics that make an individual exposed to the virus in the first place. Using death counts would have restricted the data too narrowly to individuals who were fatally exposed to the virus and experienced some combination of individual factors, such as underlying health conditions or access to medical care. The disaggregation process distributes the MODZCTA COVID data evenly throughout the census tracts that lie within it, according to the Census Tract’s estimated population. This means that different census tracts belonging to a single MODZCTA should have the same COVID case rates but different case counts depending on the varying census tract populations. A limitation of this process is that census tract estimates may not accurately represent the prevalence of COVID cases across neighbouring tracts, since certain areas of a MODZCTA may have experienced a higher rate of infection for a number of reasons unrelated to the geography’s population density. However, the disaggregation process was reviewed with the NYC Department of Health and Mental Hygiene and was perceived as an acceptable option that allows for statistical processing at a more granular level.
3.1.3. Heat vulnerability, green space and built environment variables
Heat vulnerability variables include neighbourhood microclimate (tree canopy, greenery, impervious land cover and open space access) from the 2017 NYC Light Detection and Ranging (LiDAR) data capture and NYC Planimetrics; and vegetation quality (NDVI and NDMI), derived from Landsat 8 imagery (See Supplementary Material for further information). Planimetric mapping is the capture and digitisation of visible geographic features from aerial photography, traditionally mapped in two dimensions. The most recent NYC Planimetrics data, created by NYC DoITT in 2016, were used to provide further detail on land use. These data capture imagery from the 2014 New York Statewide Flyover, which covered Manhattan on 24 June 2014 and the Bronx, Brooklyn, Queens and Staten Island between 1 April and 25 April 2014, at a 6-inch resolution (NYC DoITT Citation2019).
3.1.4. Social variables
We used US Census American Community Survey (ACS) data to assess demographic, socioeconomic and housing factors and their impact on risk. We include age, poverty, race, housing conditions and air conditioning (AC) availability from the latest ACS survey available at the time of the research. The ACS sample compiles data according to census tract for the 5-year period 2014–2018. Exploratory factor analysis revealed that the most significant variables associated with heat and COVID-19 risk are education, income (median household income), access to health care (percent of residents in a census tract without health insurance), access to social infrastructure (percent of residents in the census tract experiencing language isolation) and race (percent of census tracts that are comprised of Black and African American residents and percent of census tracts comprised of Hispanic residents). We retained these variables in our analysis (For further comparison of how our data compare with other Social Vulnerability Indices, please see Appendix 2).
3.1.5. Analysis methods
We used exploratory Principal Component Analysis (PCA) and Factor Analysis (FA) to assess the relationships between natural environment, built and social environment and social factors (See supplementary material for additional detail). Our analysis yielded seven significant factor groups: Vegetation Density, Impervious Surface, Distance to Green Space, Rental Overcrowding, Mixed Density, Public Cooling Distance and Social Vulnerability. For example, Vegetation Density gives an indication of how dense vegetation is as measured by NDMI and NDVI data (for a full listing of the composition of scaled variables see Supplementary Table 2). We ran exploratory factor analysis of the scaled variables and combined LST (proxy for heat), COVID-19 Wave 1 and Wave 2 case counts, Rental Crowding and Social Vulnerability into a combined Heat and COVID-19 Vulnerability Index. We combined Waves 1 and 2 because they were before the major intervention of vaccinations, which affected the data in Wave 3. The significance of these factors was assessed with the covariance and Chronbach’s alpha and the standardised variables of each factor were combined into scaled variables for use with regression analysis. The composition and significance test results for all of the scaled variables derived from the factor analysis are shown in Appendix 1.
We then conducted a series of regression analyses to assess the relationships between these factors and heat and COVID-19 across three waves. Since our LST Heat variable follows a normal linear distribution, we used Ordinary Least Squares (OLS) Regression analysis to examine the relationship between LST and Built and Social Factors. We then used Multivariate Multiple Regression (MMR) analysis to model the relationship between the natural and built environment, density and systemic inequity variables. We also used MMR to analyse the relationship between COVID-19 case counts across the three waves and physical, built and social environmental variables and social explanatory variables.
Finally, the results were mapped in ArcGIS to develop visual representations of the compound riskscape. The maps represent each variable in quintile segments, with the first quintile representing the lowest effect and the 5th quintile representing the highest effect. To conduct the neighbourhood analysis, we focused on the corresponding NYC neighbourhoods that are defined by the NYC government ().
3.1.6. Interactions with stakeholders
We consulted with City stakeholders from the Mayor’s Office of Resiliency, the Department of Health and Mental Hygiene, the Department of City Planning, the Department of Transportation and the Department of Parks and Recreation throughout the research process. Based on these discussions, we explored how the interventions conducted in the summer of 2020 – Cool Streets and Open Streets – related to the compound riskscape (See Section 4.3).
4. Results and discussion
4.1. Ordinary Least Squares (OLS) regression for heat
Ordinary Least Squares (OLS) regression analysis of LST and natural, built and social environmental and social factors is shown in . Vegetation Density is the most significant determinant of areas that are cooler in the city, which is consistent with the literature on urban heat impact. Results demonstrate that LST has a significant inverse correlation with areas of higher density. Since variables are standardised scales, the coefficients are difficult to interpret. For example, the 0.57 coefficient for vegetation, statistically significant at the 99% confidence interval, suggests that a one-unit increase in the Vegetation Density (a scaled variable where one unit is equivalent to a change of 1 on a scale of −1.5–4.1 with a standard deviation of 0.96) corresponds with a 0.57 unit decrease in LST (with one unit representing a degree Celsius change in average temperature readings across the 6 hottest days in the summers of 2019 and 2020). In contrast, a one-unit increase in the Impervious Surface variable (which is a scaled variable from 0 to 1.6 with standard deviation of 0.71) correlates with a 0.08 unit decrease in heat (significant to the 95% confidence interval).
Table 2. Ordinary least squares regression of LST heat and built and social factors.
To make these results easier to interpret and compare across independent variables, we also report standardised coefficients such that each variable (dependent and independent) is standardised to have a mean of 0 and a standard deviation of 1. For example, reading from the third column in (OLS regression of heat and other variables), a 1 standard deviation increase in Vegetation Density leads to a 0.42 standard deviation decrease in temperature.
Heat relationships cannot be understood based on physical parameters alone. For this reason, we have classified density into two types: rental overcrowding (combination of total crowding weighted with rental overcrowding) and mixed density (combination of population density, percent 1–2 family buildings, percent mixed residential and commercial and percent multi-family elevator buildings; See Supplementary Table 2). Areas of rental crowding correspond with hotter areas in the city. Areas with mixed density correspond with relatively cooler areas in the city. Here, one can understand why Midtown Manhattan with its tall buildings, high impervious surfaces with greater shading and predominantly mixed commercial and residential density is not one of the hottest areas in the city (Nath, Ni-Meister, and Özdoğan Citation2021) (see ). In contrast, Corona and North Corona, Queens and East Williamsburg, Brooklyn, with relatively higher vegetation density and lower impervious surface, but with less shading and high rental overcrowding, are also some of the hotter areas in the city. Similarly, social vulnerability (as measured by income, education, language isolation and lack of health insurance) is a correlate of heat, with areas having higher social vulnerability also being hotter in the summer.
4.1.1. Multiple multivariate regression analysis: understanding the relationship between heat and the built environment
To further understand the interrelationship between Heat, Vegetation, Density and Impervious Surface and Built/Social Environmental Factors and Social Factors, we conducted a multiple multivariate regression analysis (). Model results are illustrated in the maps below.
Table 3. Multiple multivariate regression analysis of heat, vegetation density and impervious surface.
Here, we can see some changes to the Heat effects, particularly with respect to Distance to Green Space. Without controlling for vegetation density and impervious surface, distance to green space is a highly significant predictor of heat. Census tracts that are further from green space (parks and other open recreation areas) are hotter. This is consistent with findings from the literature. For Vegetation Density, areas with Mixed Density have less dense vegetation.
In contrast, areas that are further from Public Cooling Infrastructure have more vegetation density, suggesting that as shown in , Public Cooling is concentrated in denser urban areas. Areas with more Impervious Surface, such as Manhattan, have more mixed density and are closer to public cooling infrastructure. These areas generally have fewer socially vulnerable, Black and Hispanic residents (see and below). However, areas that are located outside of Manhattan that have high Impervious Surface also have higher percentages of Black and Hispanic residents, greater distance from green space and a significant correlate of rental overcrowding.
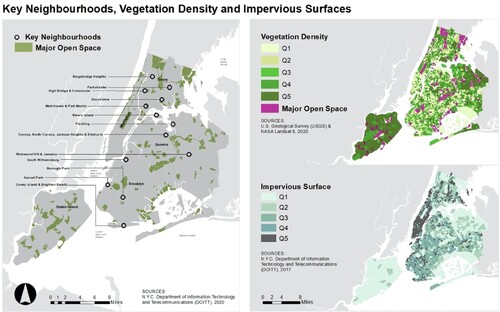
Figure 2. New York City key neighbourhoods of risk and distance to major open space, with vegetation density and impervious surface mapped in quintiles (Q1 lowest effect to Q5 highest effect)
4.2. Assessing impact of natural, built and social factors across three COVID-19 waves
To understand the physical geography of COVID-19 across the three waves, we ran another multivariate multiple regression with the first COVID-19 wave, the second wave, the combined first and second waves, and the third wave of the pandemic (). The dependent variables are measured as cumulative COVID-19 case rates for each census tract (N = 2078) across each wave. Some of the independent variables are measured as percentages such as percent of census tracts that lack AC, Percent Black and African American and Percent Hispanic. For these variables, interpretation is straightforward. For example, a 1% increase in the percent of a census tract that is Black or African American is associated with a 780-case increase in the number of cases across Wave 1. Since many of the other variables are composites, and interpretation is more challenging, we have also standardised all variables and report the standardised coefficient, which is also helpful in understanding the relative impact of the different independent variables. For example, a 1 standard deviation increase in Percent Black or African American residents in a census tract leads to a 0.30 standard deviation increase in COVID-19 case counts in Wave 1. The statistical significance of variables is not affected by standardsing the variables.
Table 4. Multiple multivariate regression analysis of COVID-19 across three waves.
4.2.1. Wave 1
In the first wave of the pandemic, LST and COVID-19 case rates were concentrated in similar neighbourhoods. As shown in , the LST hotspot neighbourhoods – the South Bronx; Jamaica, Queens; Elmhurst, Queens; Maspeth and Sunnyside, Queens; Greenpoint and Williamsburg, Brooklyn – tended to also have high COVID-19 case rates. The inverse correlation with Vegetation Density and positive correlation with Impervious Surface (shown in ) demonstrate that the pandemic was worse in neighbourhoods in the boroughs of Bronx, Brooklyn, Queens and Staten Island, whereas areas such as mid and upper Manhattan had lower case rates (all variables statistically significant to the 99% confidence interval). This was the only summer wave and the compound risk with heat can be seen in the positive coefficients for Distance from Green Space, Distance to Public Cooling and Percent Lacking AC ().
Figure 3. COVID-19 Wave 1 mapped with distance to cooling infrastructure and percent of population in each census tract that lacks AC
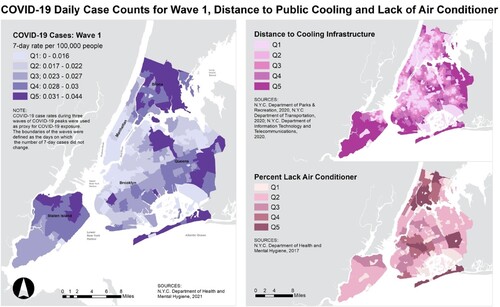
The neighbourhoods farther from green space and public cooling infrastructure (), and also those with lower percentages of households having AC, had higher COVID-19 case counts. This demonstrates the significance of green space not only for mediating heat, but also mitigating the impact of the pandemic. As we explore in Section 5, public cooling is also a potentially useful mediator of summer pandemics. Access to outdoor greenspace and public outdoor cooling facilities such as pools and open streets gave individuals a relatively safe way to mediate the impact of extreme heat while limiting the potential virus spread. Subsequent studies have for example shown that the risk of catching COVID-19 is diminished outdoors. As expected, access to private air conditioning is also correlated with lower COVID-19 case counts.
With respect to social factors, Social Vulnerability (as measured by median household income, language isolation, percent lacking diploma and percent lacking health insurance) is highly significant (). Some of the areas with the highest levels of social vulnerability are located in neighbourhoods such as Sunset Park, Coney Island and Brighton Beach in Brooklyn; Concourse, Port Morris, Mott Haven and Soundview in the Bronx; Corona, North Corona, Jackson Heights, Elmhurst and Flushing in Queens; and the Lower East Side of Manhattan. In the first wave the standardised coefficient of Social Vulnerability (0.011) is not as strong as the included race variables of percent African American residents (0.301) and Percent Hispanic (0.364) residents in each neighbourhood (). With standardised coefficients of 0.30 and 0.364 respectively in Wave 1, the race variables are the strongest predictors in the model. During the first wave of the virus much was reported about the impact of the virus, particularly on Black and African American communities (NYC Department of Mental Health and Hygiene Citation2021).
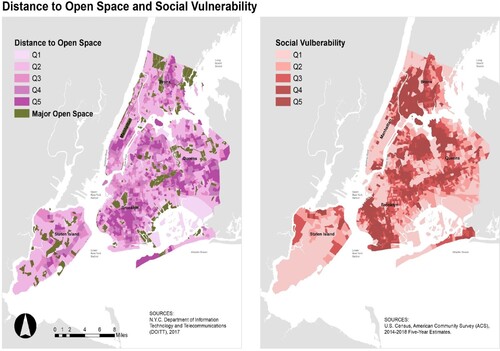
Figure 4. Distance to green space mapped with the social vulnerability scale as represented in quintiles. Hatched overlays indicate census tracts that have both the highest quintile case rates and temperature.
4.2.2. Waves 1 and 2: social vulnerability, race and essential work
In the second wave, which was the first winter wave of the pandemic, the relationship between access to Green Space and COVID-19 case counts is reversed and the significance of Rental Crowding falls away (). The areas most impacted by the second wave of the virus as measured by case counts are still the farthest from public cooling. As with the first wave, these are still in boroughs other than Manhattan. However, there is a noticeable transition between the first and the second wave ().
Figure 5. COVID-19 Waves 1 and 2 combined mapped in comparison to Wave 1 and Wave 2.
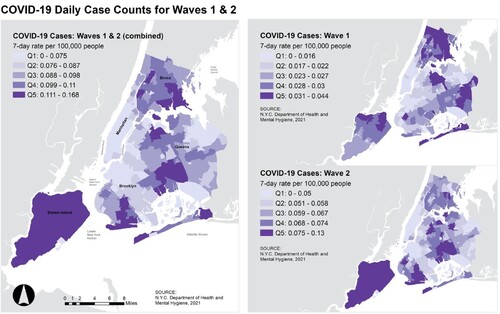
Looking at , the geography of the virus shifted with highest levels of concentration moving from the Northern Bronx, Eastern Queens, Northern Staten Island, to the South Bronx, Northwest Queens, South Brooklyn and areas between Brooklyn and Queens.
(Composite of Waves 1–2 and Race) shows a side-by-side comparison of Waves 1 and 2, and the geography of the virus shifted. The composition of neighbourhoods might explain some of the variation. Census tracts with the highest concentrations of Black or African AmericanFootnote3 residents are more concentrated in the Northwest and South Bronx and particularly Southeast Queens and East Brooklyn. These represent areas where Black and African American residents have historically settled as a consequence of policies such as redlining and urban renewal. Neighbourhoods such as Bedford Stuyvesant, Brownsville and East New York (Brooklyn) also represent areas with strong and historic grass roots community organisations that have helped to highlight and reveal continuing inequalities and injustice. Areas of the Northwest and South Bronx such as Hunts Point, Longwood, Mott Haven, Port Morris and Soundview have historically rooted populations of both Black and Hispanic residents. This has led to different forms of community-led research and advocacy campaigns, like the NYC Environmental Justice Alliance (NYC-EJA) Waterfront Justice Project that has advocated to address differential climate change impacts associated with the dislocation of chemicals during flooding events and disproportionate infrastructure improvements to advance adaptation inside the city’s Significant Maritime and Industrial Areas (Bautista et al. Citation2015; Reckien et al. Citation2018). Indicative of the history of systemic racism and disproportionate environmental justice burden, these areas are all adjacent to industrial sites.
Figure 6. COVID-19 Wave 1 and Wave 2 mapped in comparison to census data on Percent Black or African American and Percent Hispanic residents in each census tract.
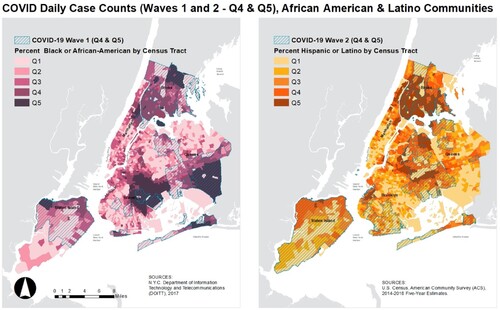
In the second wave, the Social Vulnerability standardised coefficient (0.36) is higher than both the Percent Black (−0.16) and Percent Hispanic (0.121) standardised coefficients (). Indeed, the sign of the Black coefficient is reversed indicating that case counts were actually lower in the neighbourhoods with higher percentages of Black and African American residents ().
While our data clearly demonstrates this transition, we cannot explain the reasons or causes for the shift. There may be some connection to the nature of social vulnerability and how this bears out across the waves. Percent Hispanic is indeed a strong correlate of high case count across all waves (). A direct correlation analysis between Percent Black, Percent Hispanic and Social Vulnerability shows a statistically significant 0.54 (54 percent) positive correlation between Social Vulnerability and Percent Hispanic, and a statistically significant −0.053 (5 percent) negative correlation between Percent Black and Social Vulnerability. This finding suggests that the Social Vulnerability variable corresponds strongly with Hispanic populations in New York, while Black communities are not necessarily as socially vulnerable as measured by household income, education, language isolation and lack of health insurance.
Other census tracts with higher percentages of Hispanic residents are located in the South Bronx, North Staten Island and distributed in smaller clusters throughout Brooklyn and Queens. In the second wave, the virus shifted, particularly away from predominant Black communities in Brooklyn and Queens and towards, neighbourhoods with higher Hispanic populations particularly in the South Bronx. Neighbourhoods such as Sunset Park, Sunnyside, Middle Village and Queensboro Hill were particularly affected in wave 2 (). These neighbourhoods were vulnerable to COVID-19 across both waves 1 and 2. The severity of impact extended across Staten Island and the Rockaways.
Vulnerability may also correspond with populations disproportionately engaged in essential work, as outlined in the NYC Comptroller’s report on Frontline Workers (Citation2020). The NYC Comptroller’s report (Citation2020), reinforced by other studies (Department of Labour Citation2021; Fiscal Policy Institute Citation2020; NYC Mayor’s Office of Immigrant Affairs Citation2021b; Rho, Fremstad, and Brown Citation2020), finds that one-third of essential workers are Black and one third are Hispanic, and that across various essential worker categories, Black employees make up the largest share of transit workers (41%), while Hispanic workers represent the largest share (60%) of cleaning service employees. As a consequence of both lower social vulnerability and differences in the nature of work, Black residents may have been able to better overcome some of the challenges (work-related exposure, lack of health care access, etc.) that severely impacted Hispanic residents during the second wave of the pandemic.
While the nature of essential work (cleaning versus transit work for example) may have played a role in the shift in case counts between waves 1 and 2, the predominant causes are likely to be found in a combination of public intervention, behavioural change, or other epidemiological causes. For example, Skinner-Dorkenoo et al. (Citation2022) demonstrate that social psychology can influence the perception of COVID-19 vulnerability; specifically, exposure to information about racial disparities in COVID-19 vulnerability reduced empathy and support for safety precautions targeted to support those groups, perpetuating racial inequalities. In any case, the differential racial impact between waves 1 and 2 is a notable finding that should be further explored by scholars in a range of fields including public health. For example, if public health interventions helped to mediate the disparities of impact for Black and African American residents in the second wave, it would be important to understand how and why these interventions were successful, as well as whether the same interventions were applied to Hispanic populations.
4.2.3. Waves 1 and 2: differential density
In considering the pandemic from the start of the first wave to the end of the second, most of the variables maintain their significance. Heat, Vegetation Density, Rental Overcrowding, Distance to Public Cooling, Percent Lacking AC, Social Vulnerability and Percent Hispanic are positive correlates with higher COVID-19 case counts (). In contrast Impervious Surface and Mixed Density are strong correlates of lower COVID-19 case counts. Several studies have already identified the relationship between density and COVID-19 spread (Davies et al. Citation2020; Dong, Du, and Gardner Citation2020), with most studies suggesting that increased density leads to heightened spread of the virus. Nevertheless, the significance here is not only of the structures of physical infrastructure and how it affects density, but also of the social use of infrastructure (Association for Neighborhood & Housing Development Citation2021; New York City Environmental Justice Alliance Citation2020). In particular, the Rental Crowding variable captures areas where rental overcrowding is high, meaning that living spaces tend to house far more than one person (). Neighbourhoods such as Corona and North Corona, Queens have high rental crowding and high COVID-19 case counts. Although these areas have more general vegetative density than areas such as Manhattan, because infrastructure consists of detached and single-family houses rather than high-rise buildings, occupation rates are high (Badger and Bui Citation2019; NYC Planning Citationn.d.; ANHD 2021). There are fewer parks and other green amenities in these neighbourhoods (Closson Citation2021; Huber Citation2020; Trust for Public Land Citationn.d.).
Figure 7. COVID-19 Wave 1 and Wave 2 mapped in comparison to rental overcrowding and mixed density in each census tract.
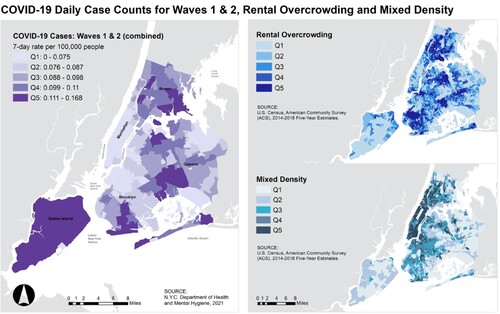
Additionally, these areas tend to have higher food insecurity and poorer access to social services and amenities (Kucklick and Manzer Citation2021; NYC Health Citation2021; Teirlinck Citationn.d.). Many new immigrant families have limited English skills and longer commute distances to work, while lacking access to health care, affordable nutritious food, and childcare (NYC Health Citation2021; NYC Mayor’s Office of Immigrant Affairs Citation2021a; NYC Mayor’s Office of Immigrant Affairs Citation2021b; Teirlinck Citationn.d.). Areas of Mixed Density, such as Upper East and West Sides of Manhattan, have high-end population and infrastructural density, but significantly lower COVID-19 case counts. These are often wealthy residential spaces and predominantly White non-Hispanic communities, which have multiple amenities and services to attend to public health needs. In contrast, low income and communities of colour located near industrial neighbourhoods that in NYC concentrate in other boroughs, particularly in the South Bronx and North and Southwest Brooklyn, suffer from the lack of basic necessities creating a negative impact on social determinants of local health (Brooklyn Borough President Citation2023; NYC-EJA 2020). Areas such as certain neighbourhoods in Manhattan have affluent communities with private amenities that allow individuals to more successfully isolate. Due to their mixed nature, with residential facilities in close proximity to shops, restaurants and places of work, they allow for easier access to the full range of services that individuals need (Kucklick and Manzer Citation2021; NYC Planning Citationn.d.). They are also correlated with areas that are cooler and that have better access to green space and public cooling (as a broader indicator) of social infrastructure (Closson Citation2021; Huber Citation2020; Lane et al. Citation2014). This is consistent across the first and second waves.
The relatively lower risks experienced in areas of Mixed Density in our data may in fact demonstrate the benefits of the “15-minute city,” a model adopted by cities around the world to promote equity and sustainability and most recently by Paris as a post-pandemic recovery strategy (Ferer-Ortiz et al. Citation2022; Moreno et al. Citation2021; Pisano Citation2020). By decentralizing the city into “complete” neighborhoods with a mix of services and amenities, studies have shown that “15-minute cities” can improve accessibility to healthy and affordable food, health and other basic services, quality green space, jobs, education, retail, and recreation (Allam et al. Citation2022; Camerin Citation2020; Ferer-Ortiz et al. Citation2022; Kakderi et al. Citation2021; Milner et al. Citation2021; Moreno et al. Citation2021; Pisano Citation2020; Pozoukidou and Chatziyiannaki Citation2021). Density is important in understanding vulnerability, including the vulnerability to heat effects and the pandemic, but the nature of the vulnerability cannot be understood in isolation of other built and social factors.
4.2.4. Wave 3: the impact of vaccinations
New York City deployed a number of different strategies to combat the COVID-19 pandemic. The third wave of the virus was accompanied by significant shifts in the geography of the pandemic. Between the second and third waves, the rate and accessibility to COVID-19 testing increased substantially, and the predominant strand of the virus evolved from Delta to Omicron. Studies indicate that Omicron was more contagious (CDC Citation2022; Ito, Piantham, and Nishiura Citation2022; HKUMed Citation2021; UK Health Security Agency Citation2021; WHO Citation2022), which bears out in the increased case counts relative to other waves, and possibly had less severe health impacts (CDC Citation2022; HKUMed Citation2021; UK Health Security Agency Citation2021; WHO Citation2022). However, perhaps the most significant public intervention was the introduction of COVID-19 vaccinations prior to the start of the wave. Vaccinations became available beginning on 11 January 2021 in a process based on CDC guidelines determined by age, frontline worker status and other comorbidities (Chokshi Citation2021; Dooling et al. Citation2021; Kates, Tolbert, and Michaud Citation2021). As of 8 April 2022, over 77 percent of the population was reported to be fully vaccinated (NYC Health Citation2022).
The impacts in reducing, and in some cases reversing, built and social vulnerabilities are considerable. The right column in shows that the significance of most variables fell away, with census tracts with higher rates of rental overcrowding and higher percentage lacking AC seeing sign reversals indicating that these census tracts experienced statistically significant lower case counts. Indeed, the veracity of the model, as indicated by the R2, likewise drops away from 45+ percent as measured across the first, second and combined first and second waves drops to 8 percent for the third wave. However, some predictors of vulnerability remain significant including heat and Percent Hispanic population. This likely reflects co-vulnerability of areas that tend to be hotter, as well as areas with higher percentages of Hispanic population, which may again correspond with higher levels of essential work and exposure.
The geographic shift of the pandemic can also be seen in . Wave 3 which includes quintiles of COVID-19 case count in purple (highest quintile in dark purple) and top 4 and 5 heat and COVID-19 Waves 1 and 2 quintiles hashed in red. Some areas that had less vulnerability including in the northern area between Queens and Brooklyn, Central Manhattan and parts of Staten Island saw higher case counts of COVID-19. Areas such as the South Bronx and Central North Queens saw lower case counts. Some of the underlying vulnerability, including in Central North Queens and South-Central Bronx, remains.
Figure 8. COVID-19 Wave 3 mapped in quintiles with highest quintile of compound risk index in hashed red overlay.
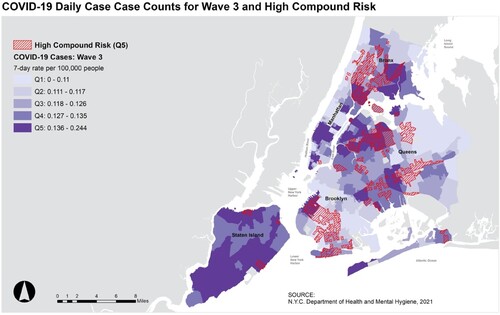
Our analysis reveals a profound shift in the geography of COVID-19 riskscapes between each wave, but particularly the second and third wave of the pandemic once vaccines became available. In line with epidemiological studies of vaccine impact (Makhoul et al. Citation2020; Toor et al. Citation2021; Rodrigues and Plotkin Citation2020), access to vaccines seems to have helped mitigate COVID-19 risks and helped reduce or even reverse disparities in case counts in many physically and socially vulnerable census tracts. This is demonstrated both by factor and regression analysis and by mapping of the COVID-19 waves. Whereas associated physical and social factors of vulnerability are reasonably consistent between the first and second wave, there are considerable differences in the third wave. For these reasons, we incorporate case data from the first and second wave into our analysis and index of COVID-19 and heat vulnerability, but not data from the third wave ().
4.2.5. The compound risk of heat and COVID-19
Exploratory factor analysis revealed the most significant and related factors of vulnerability and compound risk of COVID-19 and Heat during Waves 1 and 2 to be Rental Crowding and Social Vulnerability (Appendix 1). The variables were loaded and rotated in Stata’s combined PCA and FA as a single factor with an eigenvalue of 1.96. The variables were then standardised and scaled into the index with a reliability test Cronbach's alpha of 0.29 and an average interim covariance of 0.63. We mapped the Compound Risk Index as shown in . The index incorporates a range of physical, built, social environmental and social factors, but once again as determined through their spatial statistical interrelationships. Finally, these results are reported with finer grain at the level of the census tract.
Figure 9. Compound risk map showing the overlap of high temperature, COVID-19 case rates across Waves 1 and 2, rental crowding and social vulnerability; NYC interventions including open and cool streets, pools open in summer 2020 and major open space; key high-risk and low-risk neighbourhoods and high and low distance to cooling centers.
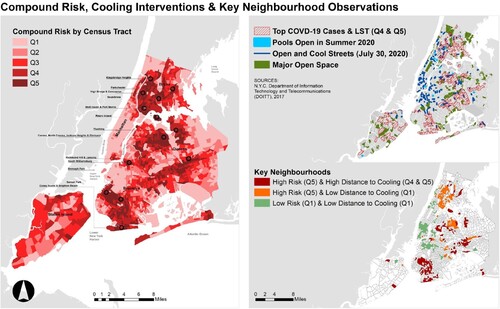
According to our Compound Risk Index (), the most vulnerable areas of the city are Kingsbridge Heights, Parkchester, Concourse, Soundview, Mott Haven, Port Morris and Rikers Island in the Bronx; Flushing, Corona, North Corona, Jackson Heights, Elmhurst, Flushing, Richmond Hill and Jamaica in Queens; Sunset Park, Borough Park, Coney Island and Brighton Beach in Brooklyn and Stapleton in Staten Island. Several of these neighbourhoods, like Sunset Park (Brooklyn) and Mott Haven and Port Morris (Bronx) are known for the disproportionate concentration of environmental burdens and historic environmental justice issues given their location in NYC-designated Significant Maritime and Industrial Areas (SMIAs) (Bautista et al. Citation2015). However, less is known about heat impacts in other residential communities located near inland industrial areas like Jamaica or Maspeth (Queens) or Soundview (Bronx); or low-income immigrant communities like North Corona, Corona, Jackson Heights (Queens) – including waterfront neighbourhoods like Flushing (Queens).
4.3. NYC public interventions for heat and COVID-19 risk
4.3.1. City wide cooling interventions
At the height of the COVID-19 pandemic, NYC introduced Open Streets to provide New Yorkers with nearby access to outdoor public spaces to combat the isolation effects of the pandemic. As part of the Cool It! NYC programme, the City expanded the Open Streets initiative to include Cool Streets, which provide tree-based shade and flowing water from fire hydrant spray caps (The City of New York Citation2020; “Cool It! NYC : NYC Parks” Citationn.d.; NYC DOT - Open Streets Citation2020). All Open and Cool Streets are mapped as part of the spatial analysis. The goal was designating 100 miles of streets, and around 70 miles were achieved in the summer of 2020. We compare the location of these interventions to our findings as they relate to distribution and concentration of density, ethnicity and access to greenspace, and cooling centres that influence compound risk. We observe neighbourhoods experiencing “high risk and high distance to cooling infrastructure”, “high risk and low distance to cooling infrastructure” and “low risk and low distance to cooling infrastructure”. Our study identifies neighbourhoods of concern where the City could focus future efforts to connect people living in high risk areas with additional cooling infrastructure.
While the City is generally targeting vulnerable areas with its mitigation programmes, the coverage of these neighbourhoods by mitigation measures is uneven. demonstrates the uneven mitigation measures to address the compound risk of heat, COVID-19 and overcrowding. Of the hotspot neighbourhoods vulnerable to the compound risk of heat and COVID-19, Jamaica and Elmhurst, Queens could benefit from further interventions due to their lack of existing measures.
Only some of these neighbourhoods have City mitigation measures. In particular, our analysis identifies areas such as Parkchester and Rikers Island (Bronx), East Williamsburg, Sunset Park, Borough Park, Coney Island and Brighton Beach (Brooklyn), Corona, North Corona, Flushing, Jamaica and Far Rockaway (Queens) to have high compound risk and low interventions. In addition, we found that other communities, like Mott Haven and Port Morris (Bronx) and Jackson Heights and Elmhurst (Queens) have high compound risk and moderate interventions. Identifying the top 50 census tracts with the highest compound risk according to our index highlights these neighbourhoods in particular (). These are areas where the City can direct resources to address both issues of environmental justice and climate resilience. Some of these neighbourhoods appear to have potential for both high heat risk as well as either coastal or estuary inundation from sea level rise, with high-tide or so-called nuisance flooding now occurring in some neighbourhoods. Further study of the relationship between heat and both inland and coastal flood risk is warranted.
5. Conclusions and recommendations
Our findings demonstrate that the compound risks of COVID-19 and heat stress are both public health and equity challenges. Several areas were identified as vulnerable to the compound risk of extreme heat and COVID-19. The heat and COVID-19 riskscape as mapped in our Compound Risk Index serves as a tool for policymakers seeking to develop interventions for responding to both extreme heat and COVID-19 in urban areas. New York City’s programmes on Open Streets for COVID-19 and risk reduction and Cool Streets for temperature risk reduction are examples of interventions that can be established in tandem to deal with compound risks.
In addition, our findings shed light on the way compound risks affect vulnerable populations in dense cities such as New York. Notably, these risks can be neither understood nor addressed in silos. Heat and COVID-19 exposure are both influenced by natural and built environmental factors, as well as social ramifications including the ways in which physical infrastructure is used, and the availability and accessibility of mitigation infrastructure (for example, see Benfer et al. Citation2021; Locke et al. Citation2021; Ortiz et al. Citation2022). Socio-demographic characteristics, although not necessarily direct causes of vulnerability, are significant indicators of both heat and COVID-19 exposure, and of where compound vulnerability exists, even taking all other factors into account (for example, see Gaynor and Wilson Citation2020; Li et al. Citation2022; Rydin et al. Citation2012).
Strategies to address vulnerability must likewise address underlying natural, built and social environmental and social factors targeting interventions where and in ways such that they can most effectively address underlying causes (See e.g. Burbidge et al. Citation2022; Hoffman, Shandas, and Pendleton Citation2020; Karaye and Horney Citation2020). For the pandemic, the findings suggest that useful interventions are not just to be found in the domain of public health, but that the natural and built/social environment to which individuals are exposed and have access matters. Shoring up social infrastructure and amenities, such as access to quality green spaces and public cooling facilities, can also be of benefit to public health resilience (See e.g. Groulx et al. Citation2021; Lai et al. Citation2019; Nayak et al. Citation2019). Indeed, resilience requires that cities remain flexible in their approach, and that interventions be targeted to generate co-benefits.
In this article, we examine COVID-19 and heat, but the compound nature of these results seems to generate insights into more general forms of vulnerability. In particular, as our statistical analysis and layered maps suggest, natural, built and social vulnerabilities are often overlapped. As such, our compound risk index is specific to COVID-19, heat, rental crowding and a few measures of social vulnerability but is likely also capturing more general physical, built-environmental and socio-economic vulnerability that hold regardless of the type of risk considered. In this regard, the Index could provide the city guidelines of areas to target resilience interventions across a range of different phenomena, including heat, pandemic vulnerability, increasing coastal and inland flood risk due to sea level rise, migration and job loss and other catastrophes.
There are many avenues through which the work presented could be expanded in the future. In particular, there are several findings that require further inquiry. Our data show the significance of not just population density, but particularly the type of density on both heat and COVID-19 vulnerability. Areas such as Manhattan, which have very high density, but mixed (commercial and residential) density fare better than areas that are more suburban, have better vegetation quality and less impervious surface, but high levels of rental crowding for both heat and COVID-19 exposure. This is a finding with significance to a range of planning and design disciplines. For the planning field, it is worth considering how measures such as access to high quality mediation infrastructure (green spaces, cooling facilities, shopping facilities, food and health care centres, etc.) can allow for enhanced resilience even where urban density is maintained or even increased.
Our data likewise demonstrate a shift in the racial composition of impact of the virus between Waves 1 and 2, with census tracts with Black and African American populations being more severely impacted in the first wave (as also widely reported in new media) but less severely impacted in the second wave. This trend is not the same for census tracts with higher percentages of Hispanic residents, which were more severely impacted across all waves of the pandemic (including the post-vaccine third, Omicron wave). There could be a range of reasons, epidemiological, policy interventions, or social and behavioural interventions that are worth studying by scholars in a range of disciplines (Skinner-Dorkenoo et al. Citation2022).
The nature of our analysis clearly indicates the significance and geographic shift of the pandemic in the third wave away from areas that are otherwise more vulnerable. Given that the introduction and wide-deployment of vaccines contributed to this shift, we believe that vaccinations are the likely cause. In this regard, our findings support epidemiological studies showing the significance of vaccination as a public health intervention to combat COVID-19 (Andrews et al. Citation2022; Bruxvoort et al. Citation2021; CDC Citation2020; Feikin et al. Citation2022a; Feikin et al. Citation2022b; Fowlkes et al. Citation2021; Higdon et al. Citation2022; Johnson et al. Citation2022; Lopez Bernal et al. Citation2021; Lewis et al. Citation2022; Makhoul et al. Citation2020; Rodrigues and Plotkin Citation2020; Toor et al. Citation2021). However, we do not have access to adequately geocoded vaccine data to be able to directly analyse the impacts of the vaccine. In particular, although most factors are mediated by the introduction of the vaccine, areas with high heat exposure potential and high percentages of Hispanic residents are still more significantly impacted. As vaccine data become more readily available this is a finding other scholars should further investigate.
Finally, in understanding compound risk we would like to extend the scope and scale of our analysis of risks to include predominant climate change-related environmental effects in New York City, including sea level rise, coastal flooding and storm surge risks, as well as ambient air quality risks. We can then integrate these factors into the compound risk scale. We would like to use this methodology to examine compound risks in other cities and believe this is an avenue where collaboration with a range of other scholars could be productive. Multi-city comparison would give a more complete analysis of the trends and impacts of the virus across all waves, as well as a better understanding of the scale at which the pandemic operated. The analysis can likewise be replicated at larger scales, across the state of New York, for example, to understand more complex urban-rural dynamics. Taken together, these techniques, findings and avenues of future research offer new ways to understand compound climate and pandemic risks and fruitful new strategies to develop related co-benefits of interventions.
Supplemental Material
Download MS Word (138.3 KB)Disclosure statement
No potential conflict of interest was reported by the author(s).
Additional information
Funding
Notes
1 Here we are examining potential exposure to heat from built environmental factors such as impervious surfaces, urban density and lack of tree cover. We are correlating these with direct spatially calibrated temperature measurements at the census tract level. We are spatially associated these attributes to summary data of census tracts most impacted by COVID. The analysis is spatial in nature.
2 Largest observed value on the 7-day average trend line.
3 We use Black and African American in keeping with ACS census data to acknowledge African as well as non-African descendants. For tables, we have condensed this term to “Black”.
References
- Allam, Zaheer, Mark Nieuwenhuijsen, Didier Chabaud, and Carlos Moreno. 2022. “The 15-Minute City Offers a New Framework for Sustainability, Liveability, and Health.” The Lancet Planetary Health 6 (3): e181–e183. doi:10.1016/S2542-5196(22)00014-6.
- Andrews, Nick, Julia Stowe, Freja Kirsebom, Samuel Toffa, Tim Rickeard, Eileen Gallagher, Charlotte Gower, et al. 2022. “Covid-19 Vaccine Effectiveness Against the Omicron (B.1.1.529) Variant.” New England Journal of Medicine 386 (16): 1532–1546. doi:10.1056/NEJMoa2119451.
- Aram, Farshid, Ester Higueras García, Ebrahim Solgi, and Soran Mansournia. 2019. “Urban Green Space Cooling Effect in Cities.” Heliyon 5 (4). doi:10.1016/j.heliyon.2019.e01339.
- Arthurson, Kathy, and Scott Baum. 2015. “Making Space for Social Inclusion in Conceptualising Climate Change Vulnerability.” Local Environment 20 (1): 1–17. doi:10.1080/13549839.2013.818951.
- Association for Neighborhood and Housing Development. 2021. “Deep Inequities in Housing Risk and COVID Impact Continues.” May 27, 2021. https://anhd.org/press-release/deep-inequities-housing-risk-and-covid-impact-continues.
- Badger, Emily, and Quoctrung Bui. 2019. “Cities Start to Question an American Ideal: A House With a Yard on Every Lot.” The New York Times, June 18, 2019, sec. The Upshot. https://www.nytimes.com/interactive/2019/06/18/upshot/cities-across-america-question-single-family-zoning.html.
- Bautista, E., E. Hanhardt, J. C. Osorio, and N. Dwyer. 2015. “New York City Environmental Justice Alliance Waterfront Justice Project.” Local Environment 20 (6): 664–682. doi:10.1080/13549839.2014.949644.
- Beck, Ulrich. 2012. World at Risk. Translated by Ciaran Cronin. Cambridge (UK): Polity.
- Benfer, Emily A., David Vlahov, Marissa Y. Long, Evan Walker-Wells, J. L. Pottenger, Gregg Gonsalves, and Danya E. Keene. 2021. “Eviction, Health Inequity, and the Spread of COVID-19: Housing Policy as a Primary Pandemic Mitigation Strategy.” Journal of Urban Health 98 (1): 1–12. doi:10.1007/s11524-020-00502-1.
- Boateng, Godfred O., Laura M. Phipps, Laura E. Smith, and Frederick A. Armah. 2021. “Household Energy Insecurity and COVID-19 Have Independent and Synergistic Health Effects on Vulnerable Populations.” Frontiers in Public Health 8. https://www.frontiersin.org/articles/10.3389fpubh.2020.609608.
- Bock, Jennifer, Palak Srivastava, Sonal Jessel, Jacqueline M. Klopp, and Robbie M. Parks. 2021. “Compounding Risks Caused by Heat Exposure and COVID-19 in New York City: A Review of Policies, Tools, and Pilot Survey Results.” Journal of Extreme Events 08 (02): 2150015. doi:10.1142/S2345737621500159.
- Boermans, Adriaan Martijn, and Mark. Kattenberg. “Estimating Reliability Coefficients with Heterogeneous Item Weightings Using Stata: A Factor Based Approach.” SSRN Scholarly Paper. Rochester, NY: Social Science Research Network, 2011. doi:10.2139/ssrn.2026433
- Bolitho, Annie, and Fiona Miller. June 3, 2017. “Heat as Emergency, Heat as Chronic Stress: Policy and Institutional Responses to Vulnerability to Extreme Heat.” Local Environment 22 (6): 682–698. doi:10.1080/13549839.2016.1254169.
- Bose-O’Reilly, Stephan, Hein Daanen, Katharina Deering, Nicola Gerrett, Maria Maud, Theresia Elisabeth Huynen, Jason Lee, Stefan Karrasch, et al. 2021. “COVID-19 and Heat Waves: New Challenges for Healthcare Systems.” Environmental Research 198 (July): 111153. doi:10.1016/j.envres.2021.111153.
- Brooklyn Borough President. 2023. “Brooklyn Borough President Antonio Reynoso Releases Administration’s Transition Report – Office of the Brooklyn Borough President Antonio Reynoso.” Accessed March 21, 2023. https://www.brooklyn-usa.org/brooklyn-borough-president-antonio-reynoso-releases-administrations-transition-report/.
- Bruxvoort, Katia J., Lina S. Sy, Lei Qian, Bradley K. Ackerson, Yi Luo, Gina S. Lee, Yun Tian, et al. 2021. “Effectiveness of MRNA-1273 Against Delta, Mu, and Other Emerging Variants of SARS-CoV-2: Test Negative Case-Control Study.” BMJ 375 (December): e068848. doi:10.1136/bmj-2021-068848.
- Burbidge, Manon, T. Smith Larsen, S. Feder, and S. Yan. 2022. “Don’t Blame It on the Sunshine! An Exploration of the Spatial Distribution of Heat Injustice Across Districts in Antwerp, Belgium.” Local Environment 27 (2): 160–176. doi:10.1080/13549839.2021.2005007.
- Camerin, Federico. 2020. “Open Issues and Opportunities to Guarantee the ‘Right to the “Healthy” City’ in the Post-Covid-19 European City.” Contesti. Città, Territori, Progetti 2: 149–162. doi:10.13128/contest-12504.
- CDC. 2020. “Coronavirus Disease 2019 (COVID-19).” Centers for Disease Control and Prevention. February 11, 2020. https://www.cdc.gov/coronavirus/2019-ncov/variants/variant-classifications.html.
- CDC. 2022. “Omicron Variant: What You Need to Know.” Centers for Disease Control and Prevention. March 29, 2022. https://www.cdc.gov/coronavirus/2019-ncov/variants/omicron-variant.html.
- “CDC Morbidity and Mortality Weekly Report”. 2013. CDC.
- Chokshi, Dave A. 2021. “New York City Department of Health and Mental Hygiene 2021 Health Advisory #2,” January 11, 2021.
- Closson, Troy. 2021. “The Disparities in Access to New York’s Parks.” The New York Times, May 27, 2021, sec. New York. https://www.nytimes.com/2021/05/27/nyregion/parks-access-nyc.html.
- Cook, Monica. 2014. “The Least of These” Theses, October. https://scholarworks.rit.edu/theses/8513.
- Cook, Monica, John R. Schott, John Mandel, and Nina Raqueno. 2014. “Development of an Operational Calibration Methodology for the Landsat Thermal Data Archive and Initial Testing of the Atmospheric Compensation Component of a Land Surface Temperature (LST) Product from the Archive.” Remote Sensing 6 (11): 11244–11266. doi:10.3390/rs61111244.
- “Cool It! NYC : NYC Parks”. n.d. Accessed December 24, 2020. NYC Parks. https://www.nycgovparks.org/about/health-and-safety-guide/cool-it-nyc.
- “COVID-19 Cases and Deaths by Race/Ethnicity: Current Data and Changes Over Time.” 2022. Kaiser Family Foundation (blog), February 22, 2022. https://www.kff.org/coronavirus-covid-19/issue-brief/covid-19-cases-and-deaths-by-race-ethnicity-current-data-and-changes-over-time/.
- “COVID-19: Data on Vaccines – NYC Health”. n.d. Accessed April 25, 2022. https://www1.nyc.gov/site/doh/covid/covid-19-data-vaccines.page.
- “COVID-19: Data Trends and Totals.” NYC Department of Health and Mental Hygiene. https://www1.nyc.gov/site/doh/covid/covid-19-data-totals.page (Accessed August 15, 2021).
- Cutter, Susan L., Bryan J. Boruff, and W. Lynn Shirley. 2003. “Social Vulnerability to Environmental Hazards*.” Social Science Quarterly 84 (2): 242–261. doi:10.1111/1540-6237.8402002.
- Dasgupta, Sharoda. 2020. “Association Between Social Vulnerability and a County’s Risk for Becoming a COVID-19 Hotspot — United States, June 1–July 25, 2020.” MMWR. Morbidity and Mortality Weekly Report 69). doi:10.15585/mmwr.mm6942a3.
- Davies, Anna, Gregory Hooks, Janelle Knox-Hayes, and Raoul S Liévanos. 2020. “Riskscapes and the Socio-Spatial Challenges of Climate Change.” Cambridge Journal of Regions, Economy and Society 13(August): 197–213. doi:10.1093/cjres/rsaa016.
- “Disadvantaged Communities Criteria”. 2021. New York State. Accessed April 19, 2022. https://climate.ny.gov/Our-Climate-Act/Disadvantaged-Communities-Criteria.
- Dong, Ensheng, Hongru Du, and Lauren Gardner. 2020. “An Interactive Web-Based Dashboard to Track COVID-19 in Real Time.” The Lancet Infectious Diseases 20 (5): 533–534. doi:10.1016/S1473-3099(20)30120-1.
- Dooling, Kathleen, Mona Marin; Megan Wallace, Nancy McClung, Mary Chamberland, Grace M. Lee, H. Keipp Talbot, José R. Romero, Beth P. Bell, and Sara E. Oliver. 2021. The Advisory Committee on Immunization Practices’ Updated Interim Recommendation for Allocation of COVID-19 Vaccine — United States, December 2020.” https://www.cdc.gov/mmwr/volumes/69/wr/mm695152e2.htm.
- “EarthExplorer”. n.d. U.S. Geological Survey. Accessed April 7, 2022. https://earthexplorer.usgs.gov/.
- “Enhancing Response to Omicron SARS-CoV-2 Variant”. 2022. World Health Organisation. https://www.who.int/publications/m/item/enhancing-readiness-for-omicron-(b.1.1.529)-technical-brief-and-priority-actions-for-member-states.
- Feikin, Daniel R., Laith J. Abu-Raddad, Nick Andrews, Mary-Ann Davies, Melissa M. Higdon, Walter A. Orenstein, and Minal K. Patel. 2022a. “Assessing Vaccine Effectiveness Against Severe COVID-19 Disease Caused by Omicron Variant. Report from a Meeting of the World Health Organization.” Vaccine 40 (26): 3516–3527. doi:10.1016/j.vaccine.2022.04.069.
- Feikin, Daniel R., Melissa M. Higdon, Laith J. Abu-Raddad, Nick Andrews, Rafael Araos, Yair Goldberg, Michelle J. Groome, et al. 2022b. “Duration of Effectiveness of Vaccines Against SARS-CoV-2 Infection and COVID-19 Disease: Results of a Systematic Review and Meta-Regression.” The Lancet 399 (10328): 924–944. doi:10.1016/S0140-6736(22)00152-0.
- Feyisa, Gudina Legese, Klaus Dons, and Henrik Meilby. 2014. “Efficiency of Parks in Mitigating Urban Heat Island Effect: An Example from Addis Ababa.” Landscape and Urban Planning 123: 87–95. doi:10.1016/j.landurbplan.2013.12.008.
- Fowlkes, A., M. Gaglani, K. Groover, M. S. Thiese, H. Tyner, and K. Ellingson. 2021. “Effectiveness of COVID-19 Vaccines in Preventing SARS-CoV-2 Infection Among Frontline Workers Before and During B.1.617.2 (Delta) Variant Predominance — Eight U.S. Locations, December 2020–August 2021. MMWR. Morbidity and Mortality Weekly Report, December 2020–August 2021.” MMWR. Morbidity and Mortality Weekly Report 70. doi:10.15585/mmwr.mm7034e4.
- Gaynor, Tia Sherèe, and Meghan E. Wilson. 2020. “Social Vulnerability and Equity: The Disproportionate Impact of COVID-19.” Public Administration Review 80 (5): 832–838. doi:10.1111/puar.13264.
- Groulx, Mark, Christopher Lemieux, Shannon Freeman, Jacob Cameron, Pamela A. Wright, and Theresa Healy. 2021. “Participatory Planning for the Future of Accessible Nature.” Local Environment 26 (7): 808–824. doi:10.1080/13549839.2021.1933405.
- Gu, Lijuan, Linsheng Yang, Li Wang, Jiangping Yu, and Binggan Wei. 2020. “An Exploratory Study of Neighbourhood Heterogeneity in Health: Evidence from China.” Local Environment 25 (10): 787–809. doi:10.1080/13549839.2020.1837761.
- Guardaro, M., D. M. Hondula, and C. L. Redman. 2022. “Social Capital: Improving Community Capacity to Respond to Urban Heat.” Local Environment 27 (9): 1133–1150. doi:10.1080/13549839.2022.2103654.
- Harlem, Gunness. 2020. “Descriptive Analysis of Social Determinant Factors in Urban Communities Affected by COVID-19.” Journal of Public Health 42 (3): 466–469. doi:10.1093/pubmed/fdaa078.
- “Heat and Cooling Equity”. n.d. NYC Council. Accessed August 26, 2022. https://council.nyc.gov/data/heat/.
- “Heat Vulnerability Index”. n.d. Accessed October 26, 2021. New York State Department of Health. https://www.health.ny.gov/environmental/weather/vulnerability_index/.
- Hewitt, Kenneth. 1997. Regions of Risk: A Geographical Introduction to Disasters. Routledge. https://www.routledge.com/Regions-of-Risk-A-Geographical-Introduction-to-Disasters/Hewitt/p/book/9780582210059.
- Higdon, Melissa M., Anurima Baidya, Karoline K. Walter, Minal K. Patel, Hanane Issa, Emmanuelle Espié, Daniel R. Feikin, and Maria Deloria Knoll. 2022. “Duration of Effectiveness of Vaccination Against COVID-19 Caused by the Omicron Variant.” The Lancet Infectious Diseases 22 (8): 1114–1116. doi:10.1016/S1473-3099(22)00409-1.
- The H. John Heinz III Center for Science, Economics. 1999. The Hidden Costs of Coastal Hazards: Implications for Risk Assessment and Mitigation. Island Press.
- “HKUMed Finds Omicron SARS-CoV-2 Can Infect Faster and Better than Delta in Human Bronchus but with Less Severe Infection in Lung”. 2021. LKS Faculty of Medicine at The University of Hong Kong (HKUMed). https://www.med.hku.hk/en/news/press/20211215-omicron-sars-cov-2-infection.
- Ho, Hung Chak, Anders Knudby, Yongming Xu, Matus Hodul, and Mehdi Aminipouri. 2016. “A Comparison of Urban Heat Islands Mapped Using Skin Temperature, Air Temperature, and Apparent Temperature (Humidex), for the Greater Vancouver Area.” Science of The Total Environment 544 (February): 929–938. doi:10.1016/j.scitotenv.2015.12.021.
- Hoffman, Jeremy S., Vivek Shandas, and Nicholas Pendleton. 2020. “The Effects of Historical Housing Policies on Resident Exposure to Intra-Urban Heat: A Study of 108 US Urban Areas.” Climate 8 (1): 12. doi:10.3390/cli8010012.
- Huber, Daniel. “Which Neighborhoods Have More Nearby Park Space Per Capita? | New York City by the Numbers.” 2020. Accessed August 25, 2022. https://ibo.nyc.ny.us/cgi-park2/2020/07/which-neighborhoods-have-more-nearby-park-space-per-capita/.
- Islam, S. Nazrul, and John Winkel. 2017. “Climate Change and Social Inequality.” United Nations Department of Economic and Social Affairs. https://www.un.org/development/desa/publications/working-paper/wp152.
- Ito, Kimihito, Chayada Piantham, and Hiroshi Nishiura. 2022. “Relative Instantaneous Reproduction Number of Omicron SARS-CoV-2 Variant with Respect to the Delta Variant in Denmark.” Journal of Medical Virology 94 (5): 2265–2268. doi:10.1002/jmv.27560.
- Jin, Andrew Shida, and Kelly T. Sanders. 2022. “Analyzing Changes to U.S. Municipal Heat Response Plans During the COVID-19 Pandemic.” Environmental Science & Policy 128 (February): 347–358. doi:10.1016/j.envsci.2021.11.022.
- Johnson, Amelia G. 2022. “COVID-19 Incidence and Death Rates Among Unvaccinated and Fully Vaccinated Adults with and Without Booster Doses During Periods of Delta and Omicron Variant Emergence — 25 U.S. Jurisdictions, April 4–December 25, 2021. MMWR. Morbidity and Mortality Weekly Report, April 4–December 25, 2021.” MMWR. Morbidity and Mortality Weekly Report 71. doi:10.15585/mmwr.mm7104e2.
- Kakderi, Christina, Nicos Komninos, Anastasia Panori, and Eleni Oikonomaki. 2021. “Next City: Learning from Cities During COVID-19 to Tackle Climate Change.” Sustainability 13 (6): 3158. doi:10.3390/su13063158.
- Karaye, Ibraheem M., and Jennifer A. Horney. 2020. “The Impact of Social Vulnerability on COVID-19 in the U.S.: An Analysis of Spatially Varying Relationships.” American Journal of Preventive Medicine 59 (3): 317–325. doi:10.1016/j.amepre.2020.06.006.
- Kates, Jennifer, Jennifer Tolbert, and Josh Michaud. 2021. “The COVID-19 ‘Vaccination Line’: An Update on State Prioritization Plans.” KFF (blog). January 11, 2021. https://www.kff.org/coronavirus-covid-19/issue-brief/the-covid-19-vaccination-line-an-update-on-state-prioritization-plans/.
- King, Andrew D., and Luke J. Harrington. 2018. “The Inequality of Climate Change from 1.5 to 2°C of Global Warming.” Geophysical Research Letters 45 (10): 5030–5033. doi:10.1029/2018GL078430.
- Kinney, Patrick L., Thomas Matte, Kim Knowlton, Jaime Madrigano, Elisaveta Petkova, Kate Weinberger, Ashlinn Quinn, Mark Arend, and Julie Pullen. 2015. “New York City Panel on Climate Change 2015 Report Chapter 5: Public Health Impacts and Resiliency.” Annals of the New York Academy of Sciences 1336 (1): 67–88. doi:10.1111/nyas.12588.
- Knowlton, Kim, Barry Lynn, Richard A. Goldberg, Cynthia Rosenzweig, Christian Hogrefe, Joyce Klein Rosenthal, and Patrick L. Kinney. 2007. “Projecting Heat-Related Mortality Impacts Under a Changing Climate in the New York City Region.” American Journal of Public Health 97 (11): 2028–2034. doi:10.2105/AJPH.2006.102947.
- Krüger, E. 2017. “Impact of Site-Specific Morphology on Outdoor Thermal Perception: A Case-Study in a Subtropical Location.” Urban Climate 21 (September): 123–135. doi:10.1016/j.uclim.2017.06.001.
- Kucklick, Annie, and Lisa Manzer. 2021. “Overlooked & Undercounted 2021: Struggling to Make Ends Meet in New York City.” Women’s Center for Education and Career Advancement. https://1giqgs400j4830k22r3m4wqg-wpengine.netdna-ssl.com/wp-content/uploads/2021/10/NYC2021_Self_Sufficiency_Report.pdf.
- Lai, Dayi, Wenyu Liu, Tingting Gan, Kuixing Liu, and Qingyan Chen. 2019. “A Review of Mitigating Strategies to Improve the Thermal Environment and Thermal Comfort in Urban Outdoor Spaces.” Science of The Total Environment 661: 337–353. doi:10.1016/j.scitotenv.2019.01.062.
- “Land Cover Raster Data (2017) – 6in Resolution | NYC Open Data.” 2017. NYC Department of Information Technology and Telecommunication (DoITT). https://data.cityofnewyork.us/Environment/Land-Cover-Raster-Data-2017-6in-Resolution/he6d-2qns.
- Lane, Kathryn, Katherine Wheeler, Kizzy Charles-Guzman, Munerah Ahmed, Micheline Blum, Katherine Gregory, Nathan Graber, Nancy Clark, and Thomas Matte. 2014. “Extreme Heat Awareness and Protective Behaviors in New York City.” Journal of Urban Health 91 (3): 403–414. doi:10.1007/s11524-013-9850-7.
- Lewis, Nickolas, Laura C. Chambers, Huong T. Chu, Taylor Fortnam, Roberta De Vito, Lisa M. Gargano, Philip A. Chan, James McDonald, and Joseph W. Hogan. 2022. “Effectiveness Associated With Vaccination After COVID-19 Recovery in Preventing Reinfection.” JAMA Network Open 5 (7): e2223917. doi:10.1001/jamanetworkopen.2022.23917.
- Li, Dongying, Galen D Newman, Bev Wilson, Yue Zhang, and Robert D Brown. 2022. “Modeling the Relationships Between Historical Redlining, Urban Heat, and Heat-Related Emergency Department Visits: An Examination of 11 Texas Cities.” Environment and Planning B: Urban Analytics and City Science 49 (3): 933–952. doi:10.1177/23998083211039854.
- Liévanos, Raoul S. 2020. “Racialised Uneven Development and Multiple Exposure: Sea-Level Rise and High-Risk Neighbourhoods in Stockton, CA.” Cambridge Journal of Regions, Economy and Society 13 (2): 381–404. doi:10.1093/cjres/rsaa009.
- Locke, Dexter H., Billy Hall, J. Morgan Grove, Steward T. A. Pickett, Laura A. Ogden, Carissa Aoki, Christopher G. Boone, and Jarlath P. M. O’Neil-Dunne. 2021. “Residential Housing Segregation and Urban Tree Canopy in 37 US Cities.” Npj Urban Sustainability 1 (1): 1–9. doi:10.1038/s42949-021-00022-0.
- Lopez Bernal, Jamie, Nick Andrews, Charlotte Gower, Eileen Gallagher, Ruth Simmons, Simon Thelwall, Julia Stowe, et al. 2021. “Effectiveness of Covid-19 Vaccines Against the B.1.617.2 (Delta) Variant.” New England Journal of Medicine 385 (7): 585–594. doi:10.1056/NEJMoa2108891.
- Madrigano, Jaime, Kazuhiko Ito, Sarah Johnson, Patrick L. Kinney, and Thomas Matte. 2015. “A Case-Only Study of Vulnerability to Heat Wave–Related Mortality in New York City (2000–2011).” Environmental Health Perspectives 123 (7): 672–678. doi:10.1289/ehp.1408178.
- Makhoul, Monia, Houssein H. Ayoub, Hiam Chemaitelly, Shaheen Seedat, Ghina R. Mumtaz, Sarah Al-Omari, and Laith J. Abu-Raddad. 2020. “Epidemiological Impact of SARS-CoV-2 Vaccination: Mathematical Modeling Analyses.” Vaccines 8 (4): 668. doi:10.3390/vaccines8040668.
- Manangan, Arie Ponce, Christopher K. Uejio, Shubhayu Saha, Paul J. Schramm, Gino D. Marinucci, Claudia Langford Brown, Jeremy J. Hess, and George Luber. n.d. “Assessing Health Vulnerability to Climate Change.” CDC National Center for Environmental Health. https://www.cdc.gov/climateandhealth/pubs/assessinghealthvulnerabilitytoclimatechange.pdf.
- Martinez, G. S., C. Linares, F. de’Donato, and J. Diaz. 2020. “Protect the Vulnerable from Extreme Heat During the COVID-19 Pandemic.” Environmental Research 187 (August): 109684. doi:10.1016/j.envres.2020.109684.
- McGeehin, M. A., and M. Mirabelli. 2001. “The Potential Impacts of Climate Variability and Change on Temperature-Related Morbidity and Mortality in the United States.” Environmental Health Perspectives 109 (Suppl 2): 185–189. doi:10.1289/ehp.109-1240665
- Meo, S. A., A. A. Abukhalaf, A. A. Alomar, I. Z. Al-Beeshi, A. Alhowikan, K. M. Shafi, A. S. Meo, A. M. Usmani, and J. Akram. August 2020a. “Climate and COVID-19 Pandemic: Effect of Heat and Humidity on the Incidence and Mortality in World’s Top Ten Hottest and Top Ten Coldest Countries.” European Review for Medical and Pharmacological Sciences 24 (15): 8232–8238. doi:10.26355/eurrev_202008_22513.
- Meo, S. A., A. A. Abukhalaf, A. A. Alomar, O. Y. Sumaya, W. Sami, K. M. Shafi, A. S. Meo, A. M. Usmani, and J. Akram. September 2020b. “Effect of Heat and Humidity on the Incidence and Mortality Due to COVID-19 Pandemic in European Countries.” European Review for Medical and Pharmacological Sciences 24 (17): 9216–9225. doi:10.26355/eurrev_202009_22874.
- Milner, James, Mike Davies, Andy Haines, Rachel Huxley, Susan Michie, Lawrie Robertson, José Siri, and Paul Wilkinson. 2021. “Emerging from COVID-19: Lessons for Action on Climate Change and Health in Cities.” Journal of Urban Health 98 (3): 433–437. doi:10.1007/s11524-020-00501-2.
- Mitchell, Bruce Coffyn, and Jayajit Chakraborty. 2018. “Exploring the Relationship Between Residential Segregation and Thermal Inequity in 20 U.S. Cities.” Local Environment 23 (8): 796–813. doi:10.1080/13549839.2018.1474861.
- Morello-Frosch, Rachel, and Edmond D. Shenassa. 2006. “The Environmental “Riskscape” and Social Inequality: Implicationsfor Explaining Maternal and Child Health Disparities.” Environmental Health Perspectives 114 (8): 1150–1153. doi:10.1289/ehp.8930.
- Moreno, Carlos, Zaheer Allam, Didier Chabaud, Catherine Gall, and Florent Pratlong. 2021. “Introducing the “15-Minute City”: Sustainability, Resilience and Place Identity in Future Post-Pandemic Cities.” Smart Cities 4 (1): 93–111. doi:10.3390/smartcities4010006.
- Morrow, B. H. 1999. “Identifying and Mapping Community Vulnerability.” Disasters 23 (1): 1–18. doi:10.1111/1467-7717.00102.
- Müller-Mahn, Detlef, Jonathan Everts, and Christiane Stephan. 2018. “Riskscapes Revisited - Exploring the Relationship Between Risk, Space and Practice.” Erdkunde 72 (September): 197–213. doi:10.3112/erdkunde.2018.02.09.
- Nath, Bibhash, Wenge Ni-Meister, and Mutlu Özdoğan. 2021. “Fine-Scale Urban Heat Patterns in New York City Measured by ASTER Satellite—The Role of Complex Spatial Structures.” Remote Sensing 13 (19): 3797. doi:10.3390/rs13193797.
- Nayak, Aditi, Shabatun J. Islam, Anurag Mehta, Yi-An Ko, Shivani A. Patel, Abhinav Goyal, Samaah Sullivan, et al. 2020. “Impact of Social Vulnerability on COVID-19 Incidence and Outcomes in the United States.” medRxiv, doi:10.1101/2020.04.10.20060962.
- Nayak, Seema G., Srishti Shrestha, Scott C. Sheridan, Wan-Hsiang Hsu, Neil A. Muscatiello, Cristian I. Pantea, Zev Ross, et al. 2019. “Accessibility of Cooling Centers to Heat-Vulnerable Populations in New York State.” Journal of Transport & Health 14: 100563. doi:10.1016/j.jth.2019.05.002.
- Neisser, Florian, and Detlef Müller-Mahn. 2017. “Urban Riskscapes—Social and Spatial Dimensions of Risk in Urban Infrastructure Settings.” In Urban Disaster Resilience and Security, edited by A. Fekete and F. Fiedrich, 347–359. Springer International Publishing. https://www.springerprofessional.de/en/urban-riskscapes-social-and-spatial-dimensions-of-risk-in-urban-/15282024.
- “New York City Heat-Related Mortality Report”. 2021. NYC Environmental Health. Accessed April 7, 2022. https://nyccas.cityofnewyork.us/nyccas2021v9/report/1.
- “New York City’s Frontline Workers.” 2020. Office of the New York City Comptroller Brad Lander. March 26, 2020. https://comptroller.nyc.gov/reports/new-york-citys-frontline-workers/.
- “New York’s Essential Workers Overlooked, Underpaid, and Indispensable”. 2020. Fiscal Policy Institute. https://fiscalpolicy.org/wp-content/uploads/2020/04/Essential-Workers-Brief-and-Recs.pdf.
- Norton, Briony A., Andrew M. Coutts, Stephen J. Livesley, Richard J. Harris, Annie M. Hunter, and Nicholas S.G. Williams. 2015. “Planning for Cooler Cities: A Framework to Prioritise Green Infrastructure to Mitigate High Temperatures in Urban Landscapes.” Landscape and Urban Planning 134: 127–138. doi:10.1016/j.landurbplan.2014.10.018.
- New York City Environmental Justice Alliance. April 2020. “NYC Climate Justice Agenda 2020: A Critical Decade for Climate, Equity, & Health".
- NYC Department of Health. n.d. “Environment & Health Data Portal: Heat Vulnerability Index.” Accessed August 26, 2022. https://a816-dohbesp.nyc.gov/IndicatorPublic/VisualizationData.aspx?id = 2191,4466a0,100,Summarize.
- “NYC DOT - Open Streets”. 2020. https://www1.nyc.gov/html/dot/html/pedestrians/openstreets.shtml.
- NYC Health. 2021. “EPI Data Brief: Food Insecurity and Access in New York City during the COVID-19 Pandemic, 2020-2021.” https://www1.nyc.gov/assets/doh/downloads/pdf/epi/databrief128.pdf.
- NYC Mayor’s Office of Immigrant Affairs. 2021b. “A Demographic Snapshot: NYC’s Latinx Immigrant Population.” NYC Mayor’s Office of Immigrant Affairs. https://www1.nyc.gov/assets/immigrants/downloads/pdf/Hispanic-Immigrant-Fact-Sheet.pdf.
- NYC Mayor’s Office of Immigrant Affairs. “A Demographic Snapshot: NYC’s Asian and Pacific Islander (API) Immigrant Population”. 2021a. NYC Mayor’s Office of Immigrant Affairs. https://www1.nyc.gov/assets/immigrants/downloads/pdf/Fact-Sheet-NYCs-API-Immigrant-Population.pdf.
- “NYC Planimetrics | NYC Open Data.” February 1, 2019. NYC Department of Information Technology and Telecommunication (DoITT). https://data.cityofnewyork.us/Transportation/NYC-Planimetrics/wt4d-p43d.
- “NYC Planning ZoLa”. n.d. NYC Planning New York City’s Zoning & Land Use Map. Accessed August 25, 2022. https://zola.planning.nyc.gov/about.
- NYS Department of Labour. “Characteristics of Frontline Essential Workers in New York State,” September 2021. https://dol.ny.gov/system/files/documents/2021/09/characteristics-of-frontline-workers-09-22-21.pdf.
- NY State Senate. “NY State Senate Bill S6599,” June 18, 2019. https://www.nysenate.gov/legislation/bills/2019/s6599.
- “Omicron, Delta, Alpha, and More: What To Know About the Coronavirus Variants”. Yale Medicine. Accessed April 11, 2022. https://www.yalemedicine.org/news/covid-19-variants-of-concern-omicron.
- O’Neill, Marie S., and Kristie L. Ebi. 2009. “Temperature Extremes and Health: Impacts of Climate Variability and Change in the United States.” Journal of Occupational and Environmental Medicine 51 (1): 13–25.
- Oppenheimer, Michael, Bruce Glavovic, van Roderik Jochen Hinkel, Alexandre Magnan, Amro Abd-Elgawad, Cai Rongshu, et al. 2022. “Sea Level Rise and Implications for Low Lying Islands, Coasts and Communities.” In IPCC Special Report on the Ocean and Cryosphere in a Changing Climate, 321–446. Cambridge University Press. doi:10.1017/9781009157964.006.
- Ortiz, L., A. Mustafa, P. Herreros Cantis, and T. McPhearson. 2022. “Overlapping Heat and COVID-19 Risk in New York City.” Urban Climate 41: 101081. doi:10.1016/j.uclim.2021.101081.
- Patz, J. A., M. A. McGeehin, S. M. Bernard, K. L. Ebi, P. R. Epstein, A. Grambsch, D. J. Gubler, et al. 2000. “The Potential Health Impacts of Climate Variability and Change for the United States: Executive Summary of the Report of the Health Sector of the U.S. National Assessment.” Environmental Health Perspectives 108 (4): 367–376. doi:10.1289/ehp.00108367.
- Pisano, Carlo. 2020. “Strategies for Post-COVID Cities: An Insight to Paris En Commun and Milano 2020.” Sustainability 12 (15): 5883. doi:10.3390/su12155883.
- Pozoukidou, Georgia, and Zoi Chatziyiannaki. 2021. “15-Minute City: Decomposing the New Urban Planning Eutopia.” Sustainability 13 (2): 928. doi:10.3390/su13020928.
- Reckien, Diana, Shuaib Lwasa, David Satterthwaite, Darryn McEvoy, Felix Creutzig, Mark Montgomery, Daniel Schensul, et al. 2018. “Equity, Environmental Justice, and Urban Climate Change.” In Climate Change and Cities: Second Assessment Report of the Urban Climate Change Research Network, edited by Cynthia Rosenzweig, Patricia Romero-Lankao, Shagun Mehrotra, Shobhakar Dhakal, Somayya Ali Ibrahim, and William D. Solecki, 173–224. Cambridge: Cambridge University Press. doi:10.1017/9781316563878.013.
- Renn, Ortwin. 2008. Risk Governance: Coping With Uncertainty in a Complex World. doi:10.1007/978-1-4020-6799-0.
- Rho, Hye Jin, Shawn Fremstad, and Hayley Brown. 2020. “A Basic Demographic Profile of Workers in Frontline Industries.” Center for Economic and Policy Research. https://cepr.net/wp-content/uploads/2020/04/2020-04-Frontline-Workers.pdf.
- Rodrigues, Charlene M. C., and Stanley A. Plotkin. 2020. “Impact of Vaccines; Health, Economic and Social Perspectives.” Frontiers in Microbiology 11. doi:10.3389/fmicb.2020.01526. https://www.frontiersin.org/article/10.3389fmicb.2020.01526.
- Rosenthal, Joyce Klein, Patrick L. Kinney, and Kristina B. Metzger. 2014. “Intra-Urban Vulnerability to Heat-Related Mortality in New York City, 1997–2006.” Health & Place 30 (November): 45–60. doi:10.1016/j.healthplace.2014.07.014.
- Rosenzweig, Cynthia, William Solecki, Reginald Blake, Malcolm Bowman, Andrew Castaldi, Craig Faris, Vivien Gornitz, et al. 2009. “Climate Risk Information.” NYC Panel on Climate Change. https://www.nyc.gov/html/om/pdf/2009/NPCC_CRI.pdf.
- Ruiz-Luna, Arturo, Rafael Bautista Bautista, Rafael Hernández-Guzmán, and Vera Camacho-Valdez. 2019. “Uneven Distribution of Urban Green Spaces in a Coastal City in Northwest Mexico.” Local Environment 24 (5): 458–472. doi:10.1080/13549839.2019.1590324.
- Rydin, Yvonne, Michael Davies, Julio D. Dávila, Pedro C. Hallal, Ian Hamilton, Ka Man Lai, and Paul Wilkinson. 2012. “Healthy Communities.” Local Environment 17 (5): 553–560. doi:10.1080/13549839.2012.681465.
- “SARS-CoV-2 Variants of Concern and Variants under Investigation”. 2021. UK Health Security Agency. https://assets.publishing.service.gov.uk/government/uploads/system/uploads/attachment_data/file/1043807/technical-briefing-33.pdf.
- Skinner-Dorkenoo, Allison L., Apoorva Sarmal, Kasheena G. Rogbeer, Chloe J. André, Bhumi Patel, and Leah Cha. 2022. “Highlighting COVID-19 Racial Disparities Can Reduce Support for Safety Precautions among White U.S. Residents.” Social Science & Medicine 301 (May): 114951. doi:10.1016/j.socscimed.2022.114951.
- Teirlinck, Bertrand. “Access to Health Care in NYC: Borough Inequality + the Pandemic Effect.” n.d. Accessed August 25, 2022. https://edc.nyc/insights/access-to-health-care-in-nyc-borough-inequality-pandemic-effect.
- The official website of the City of New York. “ As Summer Enters Full Swing, New York City Builds,” July 7, 2020. http://www.nyc.gov/office-of-the-mayor/news/500-20/as-summer-enters-fullswing-new-york-city-builds-cool-streets-nation-leading-open-streets.
- Toor, Jaspreet, Susy Echeverria-Londono, Xiang Li, Kaja Abbas, Emily D. Carter, Hannah E. Clapham, Andrew Clark, et al. 2021. “Lives Saved with Vaccination for 10 Pathogens Across 112 Countries in a Pre-COVID-19 World.” ELife 10 (July): e67635. doi:10.7554/eLife.67635.
- Trust for Public Land. “The Trust for Public Land - Park Serve.” n.d. Accessed August 25, 2022. https://parkserve.tpl.org/mapping/index.html?CityID = 3651000#reportTop.
- Unger, J., Tamás Gál, János Rakonczai, Laszlo Mucsi, Jozsef Szatmari, Zalán Tobak, Boudewijn Van Leeuwen, and K. Fiala. 2010. “Modeling of the Urban Heat Island Pattern Based on the Relationship Between Surface and Air Temperatures.” Idojaras 114 (October 2010): 287–302.
- Wallace, R., and D. Wallace. 1990. Origins of Public Health Collapse in New York City: The Dynamics of Planned Shrinkage, Contagious Urban Decay and Social Disintegration. - PMC.” Accessed May 3, 2022. https://www.ncbi.nlm.nih.gov/pmc/articles/PMC1809782/.
- Wilhelmi, O. V., P. D. Howe, M. H. Hayden, and C. R. O’Lenick. 2021. “Compounding Hazards and Intersecting Vulnerabilities: Experiences and Responses to Extreme Heat During COVID-19.” Environmental Research Letters 16 (8): 0084060. doi:10.1088/1748-9326/ac1760.
- Wilson, Bev. 2020. “Urban Heat Management and the Legacy of Redlining.” Journal of the American Planning Association 86 (4): 443–457. doi:10.1080/01944363.2020.1759127.
- Xu, Xinliang, Hongyan Cai, Zhi Qiao, Liang Wang, Cui Jin, Yaning Ge, Luyao Wang, and Fengjiao Xu. 2017. “Impacts of Park Landscape Structure on Thermal Environment Using QuickBird and Landsat Images.” Chinese Geographical Science 27 (5): 818–826. doi:10.1007/s11769-017-0910-x.
- Zölch, Teresa, Johannes Maderspacher, Christine Wamsler, and Stephan Pauleit. 2016. “Using Green Infrastructure for Urban Climate-Proofing: An Evaluation of Heat Mitigation Measures at the Micro-Scale.” Urban Forestry & Urban Greening 20: 305–316. doi:10.1016/j.ufug.2016.09.011.