
ABSTRACT
Older buildings are often vilified for alleged poor energy performance. This discussion has, however, been limited to operational energy, rather than whole-life carbon. This paper compares both embodied and operational carbon emissions of building preservation to new construction. Methodologically, it relies on consequential replacement LCA. Using a representative 1950s school building as a case study, a locally heritage-listed example of Modernist architecture, four retention scenarios are devised. The scenarios represent different approaches towards repair needs, cost implications, time horizons of refurbishment, and conserving the building's architectural-historical value. For the contemporary new build, two scenarios are developed based on a case study school building completed in 2018. They differ by the material of the structural frame (concrete or cross-laminated timber). The concrete-framed alternative corresponds to the present business as usual, whereas the wooden alternative represents a competing lower-carbon technology. The study was conducted in Finland, i.e. a cold continental climate. In such conditions, operational energy consumption is significant for a building's carbon footprint. Nevertheless, the findings show that building preservation results in lower emissions than new construction in most of the scenarios. The climate change mitigation potential of building preservation is significant at the scale of singular buildings and the building stock scale.
1. Introduction
The global environmental and climate crisis is undoubtedly the one challenge in the current era that overwhelms most others. Buildings undeniably have a major role in it, but which part does the built heritage play? In the construction and real estate sector, older buildings have more often than not been labelled as contributors due to their alleged wasteful energy consumption (as explained by e.g. PowerFootnote1). When the environmental perspective has penetrated the built heritage discourse, climate change has mainly been seen as a threat to the heritage that will require adapting to (as noted by e.g. ICOMOS),Footnote2 and rightfully so. Nevertheless, ICOMOS also points out that the relation between climate change and heritage is still vastly underexplored. Therefore, it is fair to ask if this is yet the whole picture.
In building sustainability assessment, a whole-life carbon perspective has gained traction in the recent years and rendered the energy efficiency paradigm obsolete. Instead of focusing only on a building’s operational emissions, the embodied emissions arising primarily from manufacturing the construction materials are now acknowledged as an important factor for decision-making (e.g. by Lützkendorf and BalouktsiFootnote3). Some built heritage professionals, such as Jackson,Footnote4 have pointed to this early on but alas, gone unheard in the wider society. Moreover, the development of cleaner energy technologies is providing prospects for decoupling a building’s energy usage from its carbon emissions (as discussed by e.g. Kuittinen and HäkkinenFootnote5) further emphasizing the growing significance of embodied emissions.
Consequently, the built heritage is increasingly understood as an asset that can help to combat the further escalation of the environmental and climate emergency. For instance, Huuhka and VestergaardFootnote6 have drawn parallels between the principles of architectural conservation and those of the circular economy and suggested that building preservation implements the circular economy at the highest level. This journal has joined the conversation with inter alia the special issue edited by Normandin, in which e.g. Baker et al. discussed the carbon reduction potential in built heritage preservation.Footnote7 Moreover, Berg and Fuglseth as well as Ferriss have presented life cycle assessments (LCA) of case studies comparing the greenhouse gas emissions of a heritage building’s energy refurbishment to those of new build.Footnote8 Both papers found that refurbished heritage buildings could outperform new ones.
SalmioFootnote9 has reviewed a body of research with similar premises, conducted in cold continental climates. The 19 publications reviewed contained 65 case studies in total. In 60% of the cases, refurbishment was lower-carbon throughout the study period (which varied between 25–75 years, though usually was 50–60 years). In the remaining 40%, refurbishment started off as lower-carbon than new build, but after a while, their mutual order changed. In these cases, it took on average as long as 30 years (19–55 years), apart for two publications the cases of which were outliers. Thus, based on the overwhelming majority of previous studies, Salmio interpreted that refurbishment is more helpful to climate change mitigation than new build. However, the methodological choices of the LCA varied greatly, and not all studies could be considered as methodologically robust. Moreover, in the two outlier publications, it only took a short time (1–11 years) for new build to outperform refurbishment. Key differences to the other studies were that first, the publications only investigated minor refurbishment interventions. Second, they examined primary energy consumption, not CO2.
Therefore, there is a need to keep building the evidence base with case studies from different contexts. The current research is situated in Finland and works with case studies of school buildings. The purpose is to compare the climate change mitigation potential of building preservation and replacement (demolition and new build) through two connected research questions (RQs):
RQ1. What are the long-term CO2 impacts of different degrees of refurbishment?
RQ2. What are the long-term CO2 impacts of demolition and replacement with new construction?
The article presents LCA results on carbon footprint for four different refurbishment scenarios for a heritage-listed 1950s school building. These are compared to two distinct replacement (i.e. demolition and new build) scenarios, which have been developed based on a contemporary school building, completed in 2018. All scenarios have been modelled and simulated, which yields calculated, mutually comparable results.
2. Materials and methods
2.1. Case study buildings and scenarios
2.1.1. 1950s school building
Korso school in Vantaa, Finland () was chosen as the case study building for the refurbishment scenarios. Built in 1959, it represents a cohort – post-WWII school buildings – increasingly slated for demolition. With circa 18% of all school buildings, 1940–1959 is also the largest school building cohort in Finland, with 2175 buildings and 3976 Mm2 of floor area.Footnote10 The goal was to find an individual building that represents the architecture of its time as well as typical repair needs in such buildings. The selected Korso school is a two-story building with a narrow frame. Its layout is typical for the time with a corridor in the longitudinal direction and classrooms on one or two sides. The school represents Modernist architecture and has been listed as locally valuable built heritage. In all, Modernist schools built up until the end of the 1970s represent half of the Finnish school building stock.Footnote11 This building’s heated net floor area is 2412 m2 and the load-bearing structure is made of in-situ cast concrete. gives the structures in more detail.
Figure 1. Korso school, perspective drawing and facades 1:750. Photo courtesy of Kimmo Nekkula.
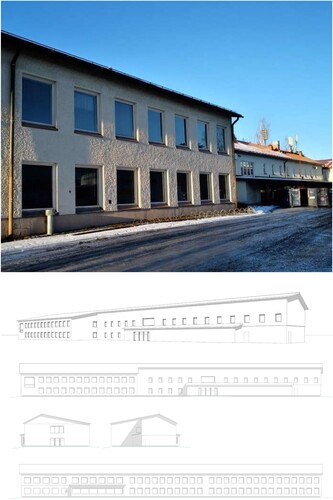
Table 1. Structures used in the scenarios.
2.1.2. Contemporary school building
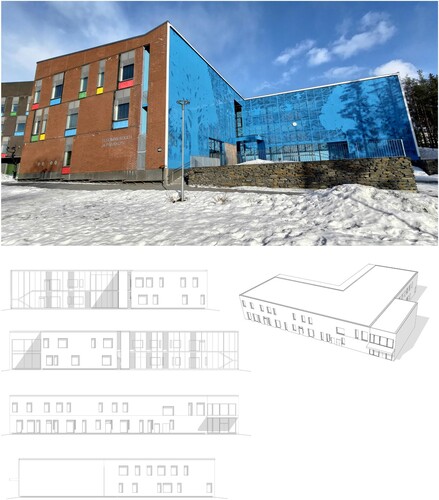
For the case study of a contemporary school building, Tesoma school in Tampere, Finland () was selected, which originates from previous research.Footnote12 The building was completed in 2018 and it fulfils the current building codes. It is, however, substantially larger than Korso school. To match the heated net floor area of Korso school (2412 m2) and thus make a comparable pair of buildings, a smaller design was created by using only one L-shaped wing of the original three-winged building. Additionally, two construction material alternatives were created, a concrete-framed building and a wood-framed building, the structures for which are given in . The concrete-framed alternative follows the actual, implemented structures of Tesoma school and represents the business-as-usual. The wood-framed alternative replaces the concrete structures with cross-laminated timber (CLT) structures, selected in collaboration with a CLT manufacturer’s structural engineer. It represents a competing, lower-carbon technology on the market.
Figure 2. Tesoma school, perspective drawing and facades 1:750. Photo courtesy of the authors.
2.1.3. Refurbishment and new construction scenarios
2.1.3.1. Refurbishment scenarios
For the refurbishment, four scenarios were designed that represent different degrees of refurbishment ( and ). Refurbishment 1 (R1) initially only improves the building’s air tightness by sealing gaps between structural parts. This indoor air quality improving refurbishment provides additional time for school activities and shifts decision-making into the future. As repair needs will keep accumulating, the initial measures are not enough to guarantee a safe and healthy building in the long term. At some point, the school must be repaired more thoroughly. Thus, the school is refurbished comprehensively after 15 years as in Refurbishment 2 (R2). Therefore, R1 can be considered a ‘delayed’ refurbishment.
Table 2. Input data for energy calculation.
Refurbishment 2 (R2) is extensive: all building services are renewed. The original mechanical exhaust ventilation system is replaced with mechanical ventilation with heat recovery. Water, sewer, electrical, and heating systems are renewed. The bottom floor is replaced with a new concrete slab with thermal insulation underneath. Additional insulation is installed in the attic. Windows and doors, the plastering of the facades and the roofing materials are renewed. An elevator is added to improve accessibility.
Refurbishment 3 (R3) is an energy refurbishment where, in addition to the measures in R2, the amount of insulation in the roof is increased. Airtightness is improved and building services are renewed as in R2. Windows, doors and ventilation systems are renewed too, but with more energy-efficient products than in R2.
Refurbishment 4 (R4) is an extensive energy refurbishment, an additional examination to scenario R3, which is identical apart from the added façade insulation. In the scenario, the 30 mm façade plastering of R3 is replaced with 10 mm adjustment screed, additional EPS insulation 50 mm, and thin-coat plastering of 10 mm.
2.1.3.2. New construction scenarios
For new construction, the structures used in both concrete-framed and wood-framed scenarios are typical and commonly used ( and ). In the concrete-framed N1, walls are precast concrete panels, the roof and intermediate floors are hollow-core slabs, and the base floor is a concrete slab. In the wood-framed N2, the load-bearing structures are CLT and other glued-laminated timber structures. Demolition of the existing 1950s building is included in both scenarios.
2.2. LCA approach, method and data
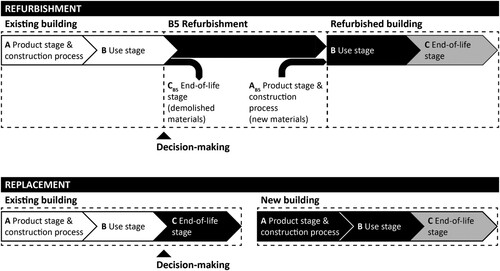
The LCA follows a Consequential Replacement approach for buildings.Footnote13 Consequential LCA is interested in the environmental impacts that occur as a consequence of a decision and can be used for supporting decision-making between different choices. In this paper, and in consequential replacement LCA of buildings more widely, the question is whether to preserve a building or to replace it with a new one. The current paper considers additionally, which refurbishment approach or construction material of a new build burdens the environment the least. depicts the scope.
Figure 3. Scope of LCA. Source: See note 13.
The LCA focuses on CO2 only. The calculations were made following the Finnish Ministry of the Environment’sFootnote14 method for the whole life carbon assessment of buildings (hereafter, ‘MoE method’). The method is underlain by the European assessment standards on sustainable construction.Footnote15
The energy efficiency requirements for new construction in Finland are set in the Decree 1010/2017 of the Ministry of the Environment.Footnote16 The new build scenarios meet these requirements. For refurbishment works, such requirements are set in the Decree 4/13.Footnote17 Three ways are given for fulfilling the requirements. In the current study, the refurbishment scenarios meet the requirements by halving the U-value of each repaired building part or by being equal to the benchmarks in regulations.
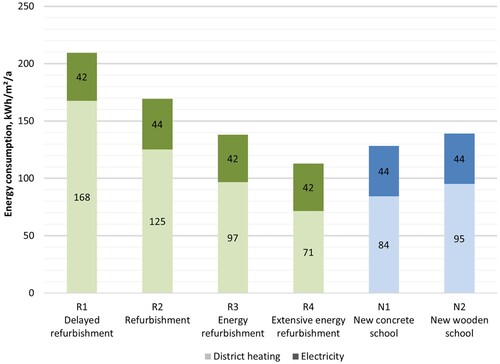
Building information models (BIMs) for the case-study buildings were created in ArchiCAD software. The BIMs were used for calculating the material volumes of the product stage as well as the energy consumption of the use stage. Energy consumption was simulated using IDA ICE 4.8 dynamic energy calculation software, based on standardized use for school buildings as per the Decree 1010/2017.Footnote18 gives the input data for the calculation. gives the results for the energy use, which act as an input for the carbon footprint calculation.
Figure 4. Energy simulation results.
The carbon footprints for the scenarios were calculated using One Click LCA software with a reference study period of 50 years. The emissions (kg CO2e) were calculated by associating the material volumes and energy consumption with tabulated emission coefficients. For materials, the coefficients were primarily selected from the national generic database CO2data.fi, commissioned by MoE and developed and maintained by Finnish Environment Institute. ‘Conservative’ values of the database were used. If a material’s emission coefficient was not featured in the database, an Environmental Product Declaration (EPD) of a product commonly used in Finland was selected. However, the emissions of ready-mixed concrete were calculated with a coefficient that is consistent with the products used in today's typical construction (not a conservative value). The purpose was to avoid exaggeration, since concrete is the single largest emission source in new construction. The structures used, amounts and types of materials, emission coefficients, service lives and construction site wastage (%) are all given in a supplementary file.
For work activities (the work site’s emissions), tabulated values compliant with the MoE method and CO2data.fi were used. For new construction (A5) and demolition (C1), values pertaining to educational buildings were retrieved from CO2data.fi. The database does not feature tabulated values for refurbishment works, but the value for construction work was adapted for this purpose according to the degree of refurbishment ().
Figure 5. Life cycle phases, data sources and tabulated values used. Notes: A5 or C values are not available for refurbishment works in the MoE method. Thus, the method’s A5 value for new construction was used for R2–R4. This is likely an exaggeration, so it was assumed that the value compensates for CB5 as well, and a value for CB5 was not estimated separately.
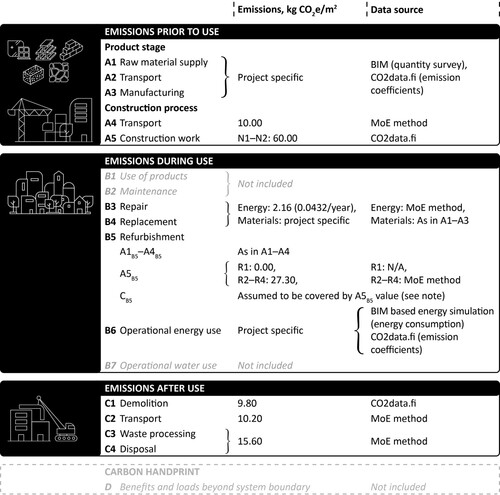
Tabulated values were also used for technical lifespans of building components, building services systems, and future energy scenarios. Replacement intervals of building components (B4) were drawn from their technical lifespans specified in CO2data.fi and Building Information File 18-10922.Footnote19 For building services systems’ product stage, floor space-based tabulated emission values from CO2data.fi were used. Their replacement is assumed after 25 years. gives all tabulated values and their sources.
In terms of emissions from energy production in the future, the MoE method assumes a decarbonization scenario for electricity and district heating, available in CO2data.fi. The emission factors are presented in the supplementary file.
3. Results
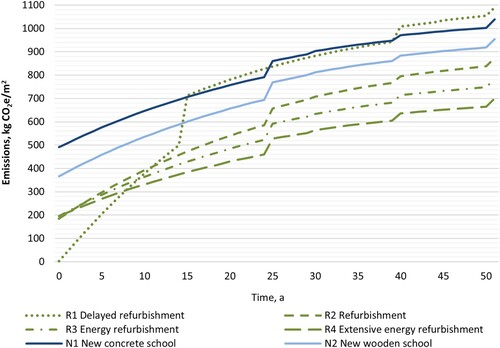
and give the results. provides the lump sum of CO2 for the whole reference study period of 50 years, divided over the stages A (prior to use, indicating embodied CO2), B (during use, indicating operational CO2) and C (after use, indicating end-of-life CO2). illustrates the temporal accumulation of the emissions, which is relevant for assessing the climate change mitigation potential of the scenarios, and which differs substantially between them. Next, the results are first discussed by comparing the four refurbishment scenarios (RQ1). Then, the refurbishment scenarios are compared to the replacement scenarios (RQ2).
Figure 6. Accumulation of emissions during different life cycle stages.
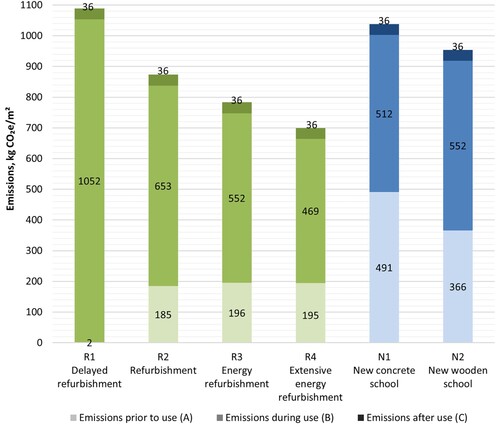
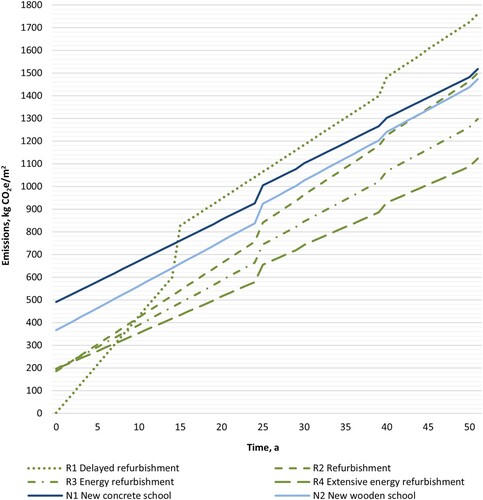
Figure 7. Accumulation of emissions in the different refurbishment and replacement scenarios.
3.1. CO2 impacts of different refurbishment scenarios
All other refurbishment scenarios but R1 have a notable ‘carbon spike’ at the beginning of the study period because of the emissions prior to use (stages A1–A5). Similarly, smaller carbon spikes occur at 25 and 40 years due to the renewal of building services and windows and doors, respectively. For R1, the carbon spikes are delayed by 15 years, when a more thorough renovation is first performed. Therefore, the second carbon spike from the renewal of building services occurs in year 40, and that from the renewal of windows and doors does not fall within the 50-year study period. The final carbon spikes in year 50 illustrate the scale of emissions from demolition, but the purpose is not to suggest that demolition is inevitable. Instead, life-cycle extension measures similar to the refurbishment scenarios could be re-performed.
3.1.1. R1 delayed refurbishment
Scenario R1, where only some light repairing and sealing is initially done, is the most low-emission solution for the first 8 years. This is despite the energy consumption of the scenario being remarkably high compared to the other alternatives, shown in as a steeply rising curve. In the more thorough renovation in year 15, the energy efficiency of the building is improved. However, due to the significant operational energy consumption of the early years, out of all the scenarios, R1 produces the highest emissions by year 40.
3.1.2. R2 refurbishment
Scenario R2, where refurbishment is performed in year 0, first produces a carbon spike of 185 kg CO₂/m2. However, since the energy efficiency of the building is significantly improved, the accumulated emissions dive below those of R1 after year 11. By year 50, the emissions of R2 are circa 20% smaller than those of R1.
3.1.3. R3 energy refurbishment
The energy refurbishment scenario R3 produces a carbon spike of 196 kg CO₂/m2, which is slightly (6%) larger than that of R2. As a result of its smaller energy consumption, R3 produces fewer emissions than R2 right after the third year, and fewer than R1 after year 10. By year 50, its accumulated emissions are 28% smaller than in R1 and 10% smaller than in R2.
3.1.4. R4 extensive energy refurbishment
In the extensive energy refurbishment scenario R4, the carbon spike is unexpectedly lower (195 kg CO2/m2) than in R3. The result is explained by the difference of emissions between insulation and plaster materials. In R3, the facades have 30 mm of plastering and in R4, there is a total of 20 mm of plastering in addition to an EPS insulation layer of 50 mm. The EPS in R4 produces fewer emissions than the additional 10 mm of plaster in R3. After the first 8 years, R4 becomes the lowest-carbon option, which it then remains. By year 50, its accumulated emissions are 36% smaller than in R1, 20% smaller than in R2 and 11% smaller than in R3.
3.2. CO2 impacts of new build out of concrete or wood vs. refurbishment
Both new construction scenarios, N1 (concrete building) and N2 (wooden building), have a substantial carbon spike from the emissions of the product stage and construction process (A1–A5) in year 0. Similar to the refurbishment scenarios, the renewal of building services in year 25 and windows and doors in year 40 induce smaller carbon spikes. The emissions from demolition are also demonstrated in year 50, though this does not imply that demolition should be performed.
3.2.1. N1 new concrete building
The new concrete building N1 is the scenario with the largest emissions early on. When N1 and R1 are compared, R1 is lower-carbon until year 15. Between years 15 and 40, their mutual order fluctuates, but the emission levels are practically equal. After year 40, N1 becomes slightly lower-carbon so that by year 50, it has a 5% advantage over R1. However R2, R3, and R4 emit substantially less CO2 than N1 throughout the study period.
3.2.2. N2 new wooden building
The new wooden building N2 displays a lower emission level than the new concrete building N1 throughout the 50 years. By year 50, the emissions of N2 are 8% lower than those of N1. This is because the carbon spike of N2 is only circa 75% of that of N1, but their operational energy consumption is almost equal. R1 emits less CO2 than N2 until year 15 when N2 becomes the lower-carbon option out of the two. However R2, R3, and R4 are more low-carbon than the wooden new building N2 throughout the 50 years.
3.3. Sensitivity analysis
Sensitivity analysis is conducted to examine how findings and conclusions may change if underlying assumptions are biased. This paper’s sensitivity analysis looks at the material emissions of concrete; windows’ and doors’ energy-efficiency; potential differences in calculated and actual energy consumption; slower than anticipated energy decarbonization; and potential future decarbonization of materials production.
3.3.1. Material emissions of concrete
The selection of the right emission coefficient for a single material can be crucial when the amount of this material is significant. In the case studies, only concrete is such a material. This research used an emission coefficient from a generic, typical product presented in the national database CO2data.fi, localized to Finland with 2020 electricity profile, without the coefficient (1.2) for the conservative value.
If this emission coefficient (0.10 kg CO2e/kg) is exchanged for the conservative value (0.13 kg CO2e/kg), the emissions of N1 increase by 6% during stage A, which results in a 3% increase overall. The mutual order between scenarios remains the same, but the emissions of N1 diverge slightly from those of the other scenarios. Compared to R1, the CO2 payback time of N1 shifts from year 15 to year 17.
3.3.2. Windows’ and doors’ energy efficiency
R2–R4 use more energy-efficient windows than N1 and N2, which can be criticized. Nevertheless, the overall impact of windows’ U-values is small. For instance, changing the U-value of windows and doors in R2 from 0.8 W/(m²K) to 1.0 W/(m²K) used in N1 and N2 increases the annual energy consumption of R2 by 2% but the whole-life CO2 emissions only by 1%. Moreover, should R2 conserve the existing windows and doors as R1 does, the annual energy consumption would increase by 17% but the overall CO2 emissions only by 6%. This is because conservation avoids the embodied emissions of new windows and doors. Neither of the changes alters the mutual order of the scenarios.
3.3.3. Calculated vs. actual energy consumption
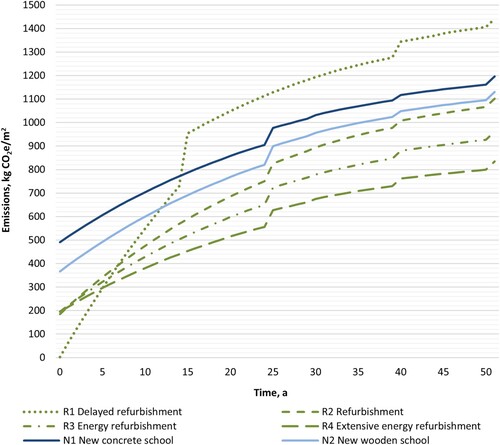
Calculated energy consumption does not always match the realized consumption. According to Ruusala et al., the difference can be significant in the Finnish climate.Footnote20 In their study, school buildings’ actual electricity consumption was on average 10% and district heating consumption 50% higher than the calculated values. takes the values in and imposes these increases on them. The order of the scenarios remains otherwise the same, but the emissions of R1 now clearly exceed those of N1 after year 15.
Figure 8. Accumulation of emissions when +10% to electricity consumption and +50% to district heating consumption is assumed. Compare to .
3.3.4. No decarbonization of energy production
Decarbonization of energy production or lack thereof is a feature that can affect the results significantly. shows the emissions of the scenarios without the decarbonization of energy production. The emissions for electricity and district heating stay constant at the level of the year 2022. The order of the scenarios remains otherwise the same, but the emissions of R1 exceed those of N1 after year 15, and those of R2 exceed those of N2 in year 44.
Figure 9. Accumulation of emissions when no decarbonization is assumed for energy production. Compare to .
3.3.5. Potential materials’ decarbonization
The MoE method does not feature a decarbonization scenario for materials’ embodied emissions. However, their future decarbonization would not influence the mutual order of N1, N2, R2, R3, and R4, because the scenarios have nearly equal future material input at the same time due to the renewal of building services and parts in years 25 and 40. The one scenario potentially impacted is R1, which postpones the renovation carbon spike until year 15. As shows, materials production needs not decarbonize by much in 15 years for R1 to become a lower-carbon option to N1. However, for R1 to reach a lower emission level than N2, material production would need to decarbonize in 15 years by more than 90%.
4. Discussion and conclusions
This paper examined the role of building preservation in climate action with the help of case studies on school buildings. In doing so, it contributed new evidence to the emerging body of literatureFootnote21 that examines whether it is more low-carbon to preserve buildings or to replace them. In all, the study encompassed eight comparison pairs, as the whole-life carbon performance of four refurbishment alternatives (with varying timing and depth of intervention) of a 1950s school were juxtaposed to that of two new build scenarios (a concrete-framed and a wooden option) in a ‘consequential replacement’ LCA setting. Three of the four refurbishment scenarios (R2–R4) outperformed the new building alternatives throughout the 50-year timeframe. The delayed refurbishment scenario R1 remained the lower-carbon option to the new buildings N1 and N2 for the first 15 years. Thereafter, the new wooden building N2 outperformed it, while R1 and the new concrete building N1 performed, in practice, equally until year 40.
As authors before us have pointed out, climate change mitigation is a time-sensitive activity.Footnote22 In 2018, the IPCC warned that the ‘carbon budget’ to keep global warming below 1.5°C was running out in near future and called for net-zero emissions in less than 15 years (in 2023, that is, in less than a decade).Footnote23 Reaching net-zero requires cutting emissions – not increasing them. Therefore, when comparing R1 and N2, it is debatable which one should be deemed climate-friendlier. Moreover, a sensitivity analysis examined whether the findings would change if focal assumptions underlying the LCA were altered. The conclusions regarding the climate-friendliness of R2–R4 remained unaffected. Certain changes in the assumptions did alter the mutual order of R1 and N1 after year 15, making N1 the lower-carbon option thereafter. As with R1 vs. N2, the relevance of the switched order for climate change mitigation is debatable.
In all, the results, in particular those of R2–R4, reinforce the conclusion that can be drawn from previous literature (as done in her review by SalmioFootnote24): preserving buildings is, as a rule, more climate friendly than replacing them with new ones. However, as R1 and prior studies examining minor refurbishment interventions imply, reducing operational energy consumption of buildings to be preserved can be vital to achieving this outcome.
From a building conservation viewpoint, any of the refurbishment scenarios can be deemed preferable to demolition. They have, nevertheless, differing implications for the retention of original fabric and appearance. R1 retains – until year 15 – the most of the building’s authentic fabric, while R4 changes the building the most, as a new insulation layer is added on top of its facades. R2 and R3 represent compromises between fabric retention and operational energy reduction. They alter the façades less than R4 by omitting the additional insulation and by only replacing windows and doors. While neither R2 nor R3 can outperform R4, both are nevertheless clearly lower-carbon than new build. This is true even if the original windows and doors are conserved, as was observed in the sensitivity analysis for R2. However, if it is not possible to conserve the existing windows e.g. due to poor condition, choosing energy-efficient replacement windows helps to cut heat loss. Moreover, an energy-efficient ventilation solution is key to the low-carbon performance of R2 and R3. In a building originally equipped with mechanical ventilation, such as the case study building, exchanging obsolete building services systems into energy-efficient ones can help to reduce operational energy consumption substantially without changing the building’s outward appearance.
Apart from R1, the mutual order of the refurbishment and replacement scenarios is largely set in the very beginning by the ‘carbon spike’ from the embodied carbon. The embodied emissions of N1 and N2 correspond to nearly 50 years of building operation. Thorough refurbishment will induce a carbon spike too, but a significantly lower one. In the case study, refurbishing the building could save up to 296 kg CO2e/m2 embodied carbon (R4 vs. N1). Moreover, refurbishment can help to bring the operational emissions of existing buildings down to the level of new build. The majority of previous studiesFootnote25 justify similar conclusions as the current study, suggesting that the emissions avoidance potential is likely extendable to other types and ages of buildings.
To illustrate the magnitude of this potential with a simple thought experiment, let us conclude by calculating the theoretical embodied emissions avoidance potential if all school buildings from the 1940–70s in the four largest cities of Finland were energy-refurbished and not replaced with new concrete buildings. The total floor area of these buildings is 2 Mm.Footnote26 With the aforementioned embodied carbon saving potential of 296 kg CO2e/m2, the total avoidance potential is 0.6 Mt CO2e. This corresponds to 17% of the cities’ emissions not covered by the EU Emissions Trading System, including construction.Footnote27 Since the current policy objective is to reduce these emissions by roughly 40% from the current level,Footnote28 it seems clear that building preservation could make a substantial contribution to reaching the climate goals. In conclusion, this research reinforces the growing evidence base that rather than being a part of the problem, existing buildings can be a part of the solution, if only societies let them.
Input_data
Download MS Excel (68.3 KB)Acknowledgements
We thank the City of Vantaa for the collaboration in providing us access to the Korso school and its documents.
Disclosure statement
No potential conflict of interest was reported by the author(s).
Data availability statement
The data that support the findings of this study are available in the tables and figures of the article, the supplementary data file, and Open Access sources (emissions coefficients and tabulated values in the MoE method or the CO2data.fi database).
Additional information
Funding
 The work was conducted in the Circular Construction in Regenerative Cities (CIRCuIT) project. This project has received funding from the European Union’s Horizon 2020 Research and Innovation Programme [grant agreement No 821201].
Notes on contributors
Malin Moisio
Malin Moisio is an architect and a doctoral researcher at Tampere University School of Architecture, research group ‘Renovation and Circular Economy Transition’ (ReCET). She focuses on the potential of renovation, adaptive reuse and infill construction in the fight against climate change. Her research methodology is based on life cycle assessment (LCA) and energy simulations.
Satu Huuhka
Satu Huuhka is an architect, D.Sc. and an associate professor (tenure track) for sustainable renovation at Tampere University School of Architecture. As the leading Finnish expert on circular construction, she leads the ReCET research group. ReCET researches all aspects of circular construction but focuses particularly on reusing existing assets - whole buildings or their parts.
Emmi Salmio
Emmi Salmio is a civil engineer and a doctoral researcher at Tampere University School of Architecture, research group ReCET. Her work deals with life-cycle assessment (LCA) in the circular economy of construction. This means, for example, assessing the environmental benefits of reusing buildings or building parts.
Tapio Kaasalainen
Tapio Kaasalainen is an architect, a university Instructor in renovation and a post-doctoral researcher at Tampere University School of Architecture, research group ReCET. His research focuses on building stocks and the extension of buildings' lifespans via renovation and repurposing. His particular area of interest lies in the interconnected challenges of population and building stock ageing.
Jukka Lahdensivu
Jukka Lahdensivu is a civil engineer, D.Sc. and an adjunct professor at Tampere University Department of Civil Engineering. He leads the research group ‘Service-Life Engineering of Structures’ and is the leading Finnish expert on the subject matter. As a managing consultant at Ramboll Finland, he has also worked on numerous real-life projects ranging from conservation to new construction.
Notes
1 Anne Power, ‘Does Demolition or Refurbishment of Old and Inefficient Homes Help to Increase Our Environmental, Social and Economic Viability?’ Energy Policy 36 (2008), doi:10.1016/j.enpol.2008.09.022.
2 ICOMOS Climate Change and Cultural Heritage Working Group, The Future of Our Pasts: Engaging Cultural Heritage in Climate Action (Paris: ICOMOS, 2019), https://openarchive.icomos.org/id/eprint/2459.
3 Thomas Lützkendorf and Maria Balouktsi, ‘Embodied Carbon Emissions in Buildings: Explanations, Interpretations, Recommendations’, Buildings and Cities 3 (2022), doi:10.5334/bc.257.
4 Mike Jackson, ‘Embodied Energy and Historic Preservation: A Needed Reassessment’, APT Bulletin: The Journal of Preservation Technology 36 (2005): 47–52. https://www.jstor.org/stable/40003163.
5 Matti Kuittinen and Tarja Häkkinen, ‘Reduced Carbon Footprints of Buildings: New Finnish Standards and Assessments’, Buildings and Cities, 1 (2020): 182–197, doi:10.5334/bc.30.
6 Satu Huuhka and Inge Vestergaard, ‘Building Conservation and the Circular Economy: A Theoretical Consideration’, Journal of Cultural Heritage Management and Sustainable Development 10 (2020), doi:10.1108/JCHMSD-06-2019-0081.
7 Kyle Normandin, ‘Climate Emergency and Our Built Environment’, Journal of Architectural Conservation 27 (2021), doi:10.1080/13556207.2021.1992839; Hannah Baker et al., ‘Retention not Demolition: How Heritage Thinking Can Inform Carbon Reduction’, Journal of Architectural Conservation 27 (2021), doi:10.1080/13556207.2021.1948239.
8 Fredrik Berg and Mie Fuglseth, ‘Life Cycle Assessment and Historic Buildings: Energy-Efficiency Refurbishment Versus New Construction in Norway’, Journal of Architectural Conservation 24 (2018), doi:10.1080/13556207.2018.1493664; Lori Ferriss, ‘Sustainable Reuse of Post-War Architecture through Life Cycle Assessment’, Journal of Architectural Conservation 27 (2021), doi:10.1080/13556207.2021.1943260.
9 Emmi Salmio, ‘Korjausrakentamisen ja purkavan uudisrakentamisen vertailu hiilijalanjäljen näkökulmasta [Comparing the Carbon Footprint of Renovation and Reconstruction]’ (Master’s thesis, Tampere University, 2022), https://urn.fi/URN:NBN:fi:tuni-202210057445.
10 Statistics Finland, ‘Buildings and Free-time Residences’, https://pxweb2.stat.fi/PxWeb/pxweb/en/StatFin/StatFin__rakke/?tablelist=true (accessed December 1, 2022).
11 Ibid.
12 Satu Huuhka et al., ‘Renovate or Replace? Consequential Replacement LCA Framework for Buildings’, Buildings and Cities 4 (2023), doi:10.5334/bc.309; Satu Huuhka et al., Purkaa vai korjata? Hiilijalanjälkivaikutukset, elinkaarikustannukset ja ohjauskeinot [To Demolish or to Repair? Carbon Footprint Impacts, Life Cycle Costs and Steering Instruments] (Helsinki: Ympäristöministeriö, 2021), https://urn.fi/URN:NBN:fi:tuni-202201051091; Malin Moisio and Satu Huuhka, Comparison of a Concrete and Wooden School: Examinations Based on Carbon Footprint (2021).
13 Satu Huuhka et al., ‘Renovate or Replace? Consequential Replacement LCA Framework for Buildings’, Buildings and Cities 4 (2023), doi:10.5334/bc.309.
14 Matti Kuittinen, ed., Method for the Whole Life Carbon Assessment of Buildings (Helsinki: Ministry of the Environment, 2019), http://urn.fi/URN:ISBN:978-952-361-030-9.
15 European Committee for Standardization, Sustainability of Construction Works – Assessment of Environmental Performance of Buildings – Calculation Method (EN 15978:2011); European Committee for Standardization, Sustainability of Construction Works. Assessment of Buildings. Part 2: Framework for the Assessment of Environmental Performance (EN 15643-2:2012); and European Committee for Standardization, Sustainability of Construction Works – Environmental Product Declarations – Core Rules for the Product Category of Construction Products (EN 15804).
16 Ministry of the Environment, Decree 1010/2017 on the Energy Performance of New Buildings, 2017.
17 Ministry of the Environment, Decree 4/13 on Improving the Energy Performance of Buildings Undergoing Renovation or Alternation, 2013.
18 Ibid.
19 Rakennustieto, Kiinteistön tekniset käyttöiät ja kunnossapitojaksot [Technical Lifespans and Maintenance Periods of Buildings] (RT 18-109822) (Helsinki: Rakennustietosäätiö RTS, 2008).
20 Annu Ruusala, Anssi Laukkarinen and Juha Vinha, ‘Energy Consumption of Finnish Schools and Daycare Centers and the Correlation to Regulatory Building Permit Values’, Energy Policy 119 (2018), doi:10.1016/j.enpol.2018.04.029.
21 See notes 8 and 9.
22 E.g. James Kallaos, ‘Explicit Consideration of Time in the Life Cycle Assessment of Buildings’, in SB10 Finland: Sustainable Community – buildingSMARTTM Conference Proceedings (Helsinki: Finnish Association of Civil Engineers RIL and VTT Technical Research Centre of Finland, 2010), https://www.irbnet.de/daten/iconda/CIB20877.pdf; Jukka Heinonen, Antti Säynäjoki and Seppo Junnila, ‘A Longitudinal Study on the Carbon Emissions of a New Residential Development’, Sustainability 3 (2011), doi:10.3390/su3081170.
23 IPCC, Global Warming of 1.5°C. An IPCC Special Report on the Impacts of Global Warming of 1.5°C Above Pre-Industrial Levels and Related Global Greenhouse Gas Emission Pathways, in the Context of Strengthening the Global Response to the Threat of Climate Change (2018), doi:10.1038/291285a0
24 See note 9.
25 See notes 8 and 9.
26 See note 10.
27 Calculated on the basis of: Statistics Finland, ‘Greenhouse Gases’, https://pxdata.stat.fi/PXWeb/pxweb/fi/StatFin/StatFin__khki/?tablelist=true (accessed December 1, 2022).
28 Ympäristöministeriö, Valtioneuvoston kirjelmä eduskunnalle komission ehdotuksesta Euroopan parlamentin ja neuvoston asetuksen 2018/842/EU sitovista kasvihuonekaasupäästöjen vähennyksistä jäsenvaltioissa vuosina 2021–2030 ja Pariisin sopimuksen sitoumusten täyttämiseksi (taakanjakoasetus) muuttamisesta [The Finnish Government’s Communication to the Finnish Parliament Regarding the Commission’s Proposal to Change the Regulation (EU) 2018/842 of the European Parliament and of the Council on Binding Annual Greenhouse Gas Emission Reductions by Member States from 2021 to 2030 Contributing to Climate Action to Meet Commitments under the Paris Agreement], https://valtioneuvosto.fi/delegate/file/95674.