
ABSTRACT
Given the crucial role of feedback in supporting learning in higher education, understanding the factors influencing feedback effectiveness is imperative. Student feedback literacy, that is, the set of attitudes and abilities to make sense of and utilize feedback is therefore considered a key concept. Rigorous investigations of feedback literacy require psychometrically sound measurement. To this end, the present paper reports on the development and initial validation (N = 221) of a self-report instrument. Grounded in the conceptual literature and building on previous scale validation efforts, an initial overinclusive item pool is generated. Exploratory factor analysis and the Rasch measurement model yield adequate psychometric properties of an initial scale measuring two dimensions: feedback attitudes and feedback practices with a total of 21 items. We further provide evidence for criterion-related validity. Findings are discussed in light of the emerging feedback literacy literature and avenues for further improvement of the scale are reported.
1. Introduction
Feedback has famously been identified as ‘one of the most powerful influences on learning and achievement’ (Hattie and Timperley Citation2007, 81). This makes feedback – the provision of information about student learning back to students – a central consideration in designing effective learning experiences. For example, the classic self-regulated learning (SRL) model by Butler and Winne (Citation1995) posits feedback as an inherent determinant of SRL processes, which in turn, are preconditions for student learning. However, under the umbrella term feedback hides an array of possible feedback designs, which can be more or less elaborate, detailed, or motivating; a variety which may also explain the high degree of heterogeneity in the effects of feedback (Hattie and Timperley Citation2007; Wisniewski, Zierer, and Hattie Citation2020). With a similar goal of understanding the utility and effectiveness of feedback better, there is an emerging literature positing a more student-centered perspective on feedback. Central to this approach is the concept of student feedback literacy.
Feedback literacy was initially introduced a decade ago by Sutton (Citation2012), and conceptualized as a part of a broader academic literacy (Lea and Street Citation2006). Carless and Boud (Citation2018) later extended Sutton’s work, seminally defining feedback literacy as ‘the understandings, capacities and dispositions needed to make sense of information and use it to enhance work or learning strategies’ (1316). As such, feedback literacy is underpinned by the assumption of students as agents, taking responsibility for their own learning and, thus, utilizing feedback to improve their study behavior and reaching individual learning goals. A recent critical review identified two contrasting views of feedback literacy (Nieminen and Carless Citation2023): The sociocultural perspective (i.e. feedback literacy resides in academic communities in which individual students are socialized) and the skills approach (i.e. feedback literacy is an individual difference and capacity). The latter perspective in particular holds the promise of employing the concept as a lens to shed light on differential feedback effects and, potentially, developing student feedback literacy via targeted educational interventions. Crucially, this requires a tight conceptual grip on the construct itself as well as valid measurement of student feedback literacy as a psychological construct.
Responding to recent calls for a psychometrically sound measurement of the construct (e.g. Winstone, Mathlin, and Nash Citation2019), the present study reports on the initial development and first validation of a multidimensional psychometric self-report scale for measuring student feedback literacy. Such a measure provides researchers with a tool to empirically capture this elusive construct, thus paving the way for more in-depth and/or large-scale investigations into feedback literacy and its role in higher education.
2. Literature review
2.1. Student-centered view on feedback
In its more traditional conception, feedback is about expert instructors telling students relevant information in the right way at the right time. This has been dubbed the ‘transmission model’ or ‘old paradigm of feedback’ (Winstone and Carless Citation2019). However, some research has shifted interest toward the role of learners in feedback. The new paradigm of student-centered feedback processes increasingly conceptualizes feedback as a more dialogical process in which learners participate actively and autonomously (Van der Kleij, Adie, and Cumming Citation2019), a view that coincides with more socio-constructivist views of learning. Resonating with this paradigm, diverse research on learner-centered feedback attitudes and practices has been produced, which appears to be partially building up toward the notion of feedback literacy. This preceding body of literature is therefore reviewed briefly.
Notably, to illuminate students’ role in feedback conceptually and empirically, research has intensively looked at learner’s attitudes as well as practices involved in feedback. For example, attitudes toward feedback have been explored through the lens and terms of feedback orientation (Kasch et al. Citation2022; King et al. Citation2009; Linderbaum and Levy Citation2010), feedback conception (Brown et al. Citation2016), feedback perception (Strijbos et al. Citation2021), and feedback receptivity (Lipnevich et al. Citation2021). To briefly summarize, we find that researchers frequently posit multiple dimensions of these concepts, suggesting a relative complexity of factors making up feedback-related attitudes. Crucially, perceived usefulness of feedback appears repeatedly across these conceptualizations, highlighting the intuitive notion that plain perceptions of utility are likely at the heart of feedback attitudes. This aligns well with the findings that perceived feedback usefulness also positively impacts actual feedback effects, not only feedback perceptions (Harks et al. Citation2014). Also common among these conceptualizations is the addition of further nuance through dimensions that pertain to affective (i.e. ‘affect’ in Strijbos et al. Citation2021) and or self-related perceptions (i.e. ‘self-efficacy’ in Kasch et al. Citation2022; Linderbaum and Levy Citation2010).
Aside from students’ attitude-based role in feedback processes, researchers have also focused on feedback practices, that is, how students make use of and interact with feedback. Here, forms of engagement with feedback are central (Garino Citation2020; Handley, Price, and Millar Citation2011; Winstone et al. Citation2017). Specifically, Winstone et al. (Citation2017) refer to the notion of proactive engagement, resonating with the conclusions of Garino (Citation2020) that feedback engagement implies students being ready, willing, and able to learn from feedback. Notably, these accounts consistently highlight learner agency as underpinning feedback engagement. Slightly different is the notion of feedback seeking, defined as, for example, ‘purposely seeking information about one’s own level of performance, interpreting it, and applying it in order to reach one’s goals’ (Anseel et al. Citation2015, cited in Leenknecht, Hompus, and van der Schaaf Citation2019, 2). Essentially, feedback seeking means deducing feedback from surroundings (monitoring) or explicitly asking for feedback (inquiry) (Joughin et al. Citation2021). Although feedback seeking is a concept originating from management research, its tenets bear implications for understanding feedback literacy, especially with respect to proactive notions that underlie the latter. For this reason, Joughin et al. (Citation2021) seek to ‘promote a better understanding of feedback literacy by drawing together these two strands’ (3). Turning toward feedback literacy, we find that these earlier cornerstones remain the foundation of the construct.
2.2. Feedback literacy conceptualizations
The shift of focus toward students’ role in feedback processes is interpreted by Nieminen and Carless (Citation2023) as fabrication, in that the conception of feedback literate students is, in a way, manufactured to (1) provide a lens from which to understand how students deal with feedback on a descriptive level but also, more normatively, to (2) formulate a desired ‘ideal student’ that is able to make the most of feedback. In this sense, feedback literacy sits comfortably among other literacies or broad competency models also serving this double function, e.g. academic literacy and twenty-first-century skills (Chen Citation2021).
Sutton (Citation2012) first used the term feedback literacy as part of academic literacy, which involves not only cognitive skills but also habits, capacities, and educational identities. Later, Carless and Boud (Citation2018) defined feedback literacy as ‘the understandings, capacities, and dispositions needed to make sense of information and use it to enhance work or learning strategies’ (2) and proposed a framework with four features: (1) Appreciating feedback, (2) Making judgements, (3) Managing affect and (4) Taking action.
Building on this work, Molloy, Boud, and Henderson (Citation2020) further deduced identified seven descriptions of feedback literate students from qualitative data of higher education students. These descriptions include more specific categories based on student statements. For example, the description (1) commits to feedback as improvement consists of two categories: (a) establishes a disposition to use feedback to continually improve their work and (b) acknowledges that mastery/expertise is not fixed, but can change over time and context (Molloy, Boud, and Henderson Citation2020, see ). These two frameworks by Carless and Boud (Citation2018) and Molloy, Boud, and Henderson (Citation2020) are influential and empirical for advancing the concept of feedback literacy.
Table 1. Structure of the two-factor solution.
Alongside student feedback literacy, there is also an emerging literature on feedback literacy in relation to peer feedback specifically (e.g. Dong et al. Citation2023; Han and Xu Citation2020) as well as teacher feedback literacy (e.g. Carless and Winstone Citation2023). Although interesting in their own right and arguably relevant for a comprehensive understanding of feedback literacy in the tertiary classroom, the present study focusses on student feedback literacy and, thus, develops an instrument for this purpose only. For scale development work on the abovementioned related constructs, we refer the readers to Dong et al. (Citation2023) and Wang et al. (Citation2023), among others.
2.3. Available measures
With the growing interest in the notion of student feedback literacy, there have been recent efforts to create psychometric scales that allow for the measurement of the construct. Although there are many self-report instruments pertaining to feedback perceptions and similar constructs (for a review, see Brown and Zhao Citation2023), here we briefly review only available instruments which specifically refer to feedback literacy. During the data collection for the present study, two such scales were published: a six-dimensional student feedback literacy scale by Zhan (Citation2022) and the three-dimensional learner feedback literacy model by Song (Citation2022). During the revision of our manuscript, another scale development study was published, Yildiz et al. (Citation2022) with four factors. Although we find no grounds to doubt the methodological rigor and psychometrical soundness of these works, we want to highlight potential unaddressed shortcomings of these efforts, from which we derive the benefits of adding yet another psychometric scale to the available toolset.
Zhan (Citation2022) provided a scale validation report using confirmatory factor analysis on a sample of Chinese university students (N = 555), arriving at six dimensions of feedback literacy. Although psychometric indicators suggest a sound instrument, we note some potential shortcomings that may limit the value of the scale for future research. Zhan (Citation2022) provides only cursory reporting of important conceptual and methodological aspects. For example, it remains unclear why the decision was made to deviate in content and number from previous conceptual work by postulating these particular six dimensions. Given the confirmatory approach to construct validation, a strong theoretical rationale would be needed. Further, the item generation process remains opaque. Was there an initial overinclusive item pool that was then iteratively modified and reduced, as recommended by Clark and Watson (Citation1995) and DeVellis (Citation2017)? The reporting does not provide insights into this.
Shortly after, Song (Citation2022) created a 21-item self-report inventory consisting of three subscales. Notably, the first two subscales consist of two components each, actually making this a measure with five hypothesized dimensions. Validation was conducted on a sample of higher education students from a Singaporean polytechnic institute (N = 923) via Bifactor confirmatory analysis, Rasch analysis and correlations. While results support the quality of the instrument, here too we note potential points of contention. First, like Zhan (Citation2022), the approach here is again highly confirmatory. Second, in line with Han and Xu’s (Citation2021) approach, Song (Citation2022) chose to focus on students’ dispositions prior to feedback engagement. While interesting in its own right, it may be disputed whether this actually captures feedback literacy in the sense of enacted understandings, capacities, and dispositions toward feedback, which is a foundational aspect of the seminal work of Sutton (Citation2012), Carless and Boud (Citation2018), as well as Molloy, Boud, and Henderson (Citation2020).
Yildiz et al. (Citation2022) report on a scale development study with Turkish students (N = 735), covering four dimensions of student feedback literacy across 24 items. Convincingly, they generate an overinclusive initial item pool which is subjected to exploratory factor analyses (EFA) in a first sample before, in a second sample, the four-factor structure is confirmed via confirmatory factor analysis (CFA). The resulting instrument has desirable psychometric properties. Similarly to Song (Citation2022), however, one could argue that this instrument mainly covers one side of feedback literacy, students’ attitudes and dispositions toward feedback. The instrument does not measure enactment of feedback literacy, that is, practices and capacities to elicit, process, and act on feedback, although this is an important part of the construct according to its scholarly foundations (Carless and Boud Citation2018; Molloy, Boud, and Henderson Citation2020; Sutton Citation2012).
Overall, at this point, we argue that the highly confirmatory approaches in both Zhang (Citation2022) and Song (Citation2022) may be premature. The authors justify their approach on the grounds that their factor structures are well-grounded in theory. Yet, the very fact that Zhang (Citation2022) and Song (Citation2022) arrive at such different models betrays that essential conceptual and theoretical foundations are not yet solidly established. This is echoed in Nieminen and Carless (Citation2023), who stress the importance of further explorations of the dimensions of feedback literacy and supported by the fact that Yildiz et al. (Citation2022), whose approach was indeed exploratory, arrived at yet another factor structure. From our reading of the literature, however, Yildiz et al. (Citation2022) fails to capture the breadth of feedback literacy by mainly focusing on attitudes and dispositions. As such, their instrument measures something more closely related to feedback perceptions (e.g. Brown and Zhao Citation2023). From this, we conclude the need for a more exploratory and open-ended scale development approach. Further, we aim to produce an instrument in which the enacted facet of feedback literacy is reflected sufficiently, in order to distinguish the construct from feedback attitudes and perceptions.
3. The present study
This study proposes and investigates a self-report measure of student feedback literacy, the goal being an instrument that is rigorously grounded in the existing literature while improving on previous scale development efforts through a more open and exploratory approach. Aside from producing a usable self-report scale, our approach also aims at deepening our understanding of feedback literacy itself by exploring it as a multidimensional psychological construct.
Feedback literacy as ‘a set of generic practices, skills, and attributes’ manifesting in ‘situated learning practices’ (Sutton Citation2012, 33) is constantly being enacted and expressed in diverse cognitive, affective, or behavioral ways, depending on context. Thus, we conceive of feedback literacy in terms of (1) prior dispositions such as beliefs and mental models as well as (2) performed practices of feedback engagement and enactment across diverse situations. Carrying pertinent feedback-related beliefs and motivations could be considered ‘talking the talk’, while using feedback in self-directed ways in the sense of learner agency can be considered ‘walking the walk’. This central distinction simultaneously informs scale development and will be subject to empirical testing.
Following the 8-step procedure for scale development suggested by DeVellis (Citation2017), this study aims to provide answers to the overarching question of ‘What are the psychometric properties of a student feedback literacy scale?’. This question can be further distinguished into more actionable subquestions:
RQ1: What is the factor structure of a student feedback literacy scale?
RQ2: What are the reliability and validity indicators for psychometric quality according to classical test theory and the Rasch measurement model?
RQ3: To what extent does the student feedback literacy scale suggest criterion-related validity with respect to related but distinct student learning constructs?
RQ4: How can the instrument be improved in future validation and development efforts?
4. Methods
4.1. Item development
As a first step, an overinclusive pool of items reflecting the latent construct was generated. For an intended scale with 15–20 items, an initial pool of 40–50 items was deemed appropriate. Previous feedback literacy research was used as reference for item creation, encompassing conceptual and empirical papers on feedback literacy itself (Carless and Boud Citation2018; Han and Xu Citation2021; Malecka, Boud, and Carless Citation2022; Molloy, Boud, and Henderson Citation2020; Sutton Citation2012) as well as on feedback-related processes such as feedback engagement (Garino Citation2020; Handley, Price, and Millar Citation2011; Winstone et al. Citation2017), feedback-seeking behavior (Joughin et al. Citation2021; Leenknecht, Hompus, and van der Schaaf Citation2019) and self-regulated learning (e.g. Butler and Winne Citation1995). The qualitative work by Molloy, Boud, and Henderson (Citation2020) was chosen as a starting point, as it empirically builds upon the conceptual groundwork of Carless and Boud (Citation2018).
We applied two complementary strategies to ensure content validity in item creation. To begin, we hypothesized simple, high-level distinctions to scaffold our item development process. Thus, a distinction into three overarching dimensions was made: (1) Openness to feedback (2) Engagement with feedback, and (3) Enactment of feedback. As a second strategy, existing descriptions, features, and dimensions of feedback literacy were iteratively identified from the available literature and introduced as subthemes to these overarching dimensions, from which items were then deduced. If descriptors were not sufficiently specific to delineate an item from them, they were not included. Descriptions were extracted until the subthemes were saturated. Through this process, we intended to develop a balanced and diverse item pool. Ultimately, 84 descriptions of feedback literacy were extracted and 16 subthemes identified. Refer to the supplementary material (OSF: osf.io/z4tus) for an overview of hypothetical dimensions, subthemes, their descriptions, as well as supporting research.
Item phrasing decisions were made carefully to avoid suggestive or double-barreled questions. Items were consistently worded as personalized ‘I’- statements to trigger students’ introspection about their own literacy levels instead of using more general statements (e.g. ‘Feedback is helpful for … ’) that may tap more depersonalized knowledge. We aimed for neutral item phrasing and chose a moderate level of abstraction in order to avoid tying self-report to highly specific events while still triggering aspects of students’ individual biographies. A 5-point Likert scale was set as response format, labeled (1) strongly disagree to (5) strongly agree, to strike a balance between offering sufficient response options, while also ensuring that participants are able to discriminate meaningfully between options.
We subjected this initial item pool to external review for clarity by three higher education students and six educational researchers with high to native English proficiency. Students were provided with a spreadsheet of the questionnaire and asked to rate each item of the preliminary item pool for clarity, using a three-step response format (very clear, somewhat unclear, very unclear) and open-ended comments. In a follow-up online meeting, students elaborated on their feedback, and possible modifications to the phrasing were deliberated. For the education researchers, an online questionnaire via LimeSurvey was provided. They were asked to answer the preliminary questionnaire as if they belonged to the target group and provide open-ended comments on the clarity of items. Based on the review, 17 items were rephrased, and one was removed completely. The revised 41 items can be found in the supplementary material, alongside the final questionnaire and the dataset, at https://osf.io/z4tus.
4.2. Procedure
Survey participants were acquired through convenience sampling, with data collected from a sample of students (N = 250) in teacher training or counseling studies at Adiyaman University, Turkey. The sample size was deemed sufficient, as a 1:5 item-to-participant ratio (Kyriazos Citation2018) yields a minimum sample size of 205 for exploratory factor analysis and Rasch analysis for polytomous items requires a minimum of 100 participants for most purposes (Chen et al. Citation2014; Linacre Citation1994). The students were taught by one of the coauthors of this paper (D. Orhan Göksün), who asked them to participate in an online survey at their best available time for additional credit points. However, the survey was unrelated to the class matter.
Translation of psychometric scales requires thorough procedures to ensure analogous adaptation to language and culture (International Test Commission Citation2017). As data were collected with the Turkish questionnaire but analyzed in reference to the English questionnaire, de facto equivalence between both versions was crucial. The questionnaire was translated according to the following steps: Two Turkish post-doctoral researchers with excellent English proficiency translated the items into Turkish. Translations were then revised, if necessary, first, by the researcher leading data collection, and, afterward, by a Turkish language expert. Turkish items were translated back into English by an expert without knowledge of the original version. Finally, the leading researcher revised items based on back-translation discrepancies.
Students were informed about data handling ensuring anonymity and provided with instructions on the included items. The survey contained (1) demographic items, (2) initial feedback literacy items, (2) items pertaining to social desirability, (3) and items measuring constructs for analysis of convergent validity (see section 5.1). Within each thematic block, items were randomized to exclude the possibility of order effects (Strack Citation1992)
A pitfall of measuring competencies through self-report methods is that people may incorrectly assess themselves due to, for example, social desirability or overconfidence (Mahmood Citation2016). Therefore, measures were taken to control for such effects. First, the tendency toward social desirability was measured through three items (Social Desirability – Gamma Short Scale KSE-G, Nießen, Partsch, and Rammstedt Citation2018). Second, participants’ tendency to endorse the feedback literacy statements (i.e. item difficulty) was analyzed on the item level (see section 4.3).
We included three instruments in the questionnaire to assess criterion-related validity of our feedback literacy scale. From the R-SPQ-2F (Biggs et al. Citation2001), we included surface motivation (five items, Cronbach’s Alpha = .79) and deep motivation (five items, Cronbach’s Alpha = .65). Our instrument would show convergent validity by correlating positively with deep motivation, as we expect feedback literacy, especially in its enacted form, to align with a deep engagement with the learning content. We interpret as discriminant validity if our instrument yields no or negative correlation with surface motivation, as a superficial approach to learning is opposite to, for example, consciously eliciting feedback and adapting learning strategies based on feedback. We expect a positive correlation with feedback self-efficacy (five items, Cronbach’s Alpha = .74) of the Feedback Orientation Scale (FOS, Linderbaum and Levy Citation2010). We derive this from feedback self-efficacy being the result of successful feedback experiences, which should depend on demonstrating feedback literacy in past feedback situations. Therefore, no or negative correlations would indicate problems with our instrument, as the FOS is well-established.
After data collection, negative items were reverse-scored and the data was cleaned. Eleven cases with 95% identical responses were deleted. Straightlining is a strong form of ‘satisficing’, in which respondents provide an identical response to (nearly) all survey items (Kim et al. Citation2019). Although many of these cases were in the highest response category, we do not attribute this to ceiling effects, as these cases also straightlined across the negatively worded items, a clear indication of respondent inattention. We further excluded eight respondents with maximum scores on all three social desirability items. The final sample (N = 221) had a mean age of 22.5 years (SD = 4.3) and consisted of 67.4% women. Most students were in their fourth semester of study (67.9%), while second-semester students accounted for about 19.9% and sixth-semester students for 9% of students. Only 3.2% were in their eighth semester of study. Students came from different fields of study, i.e. foreign language teaching (23.1%), social science teaching (16.7%), special education teaching (17.6%), psychological counseling teaching (23.5%), and preschool teaching (19%).
4.3. Analysis
To accommodate the exploratory aim of this paper, we decided to conduct Exploratory Factor Analysis (EFA) on the 41 items. This was chosen as a first step, over an Confirmatory Factor Analysis (CFA) at this time, to not presuppose a factor structure. As explained in section 2.3, our reading of the literature suggests that the exact contents and delineations of the construct are still an ongoing subject of research and may benefit from more open-ended approaches at this time. Thus, CFA may be well-suited for future scale refinements in the ongoing validation efforts of the feedback literacy instrument, whereas EFA best suits our current purpose of exploring the dimensions of the construct.
Bartlett's test of Sphericity indicated that items correlate sufficiently for factorization. Next, four items were removed due to Kaiser-Meyer-Olkin (KMO) values below .70, FL12_rev, FL26, FL32_rev, FL37_rev. Finally, another item (FL39) was removed due to severe violation of univariate normality. We then conducted the EFA on the remaining 37 items with Principal Axis Factoring as extraction method (performing better than Maximum Likelihood under many practical conditions, as reported by De Winter and Dodou Citation2012) and an oblique rotation (Direct Oblimin) to allow for correlated factors. To determine the number of factors to retain, the Kaiser criterion was applied, using Eigenvalues of greater than 1 (Costello and Osborne Citation2005).
To arrive at a preliminary factor structure, the following procedure was chosen: First, items were removed based on communality. The cutoff was set at .30 as this allowed to maximize communality while attending to content diversity among the items (i.e. retaining subthemes, if possible). Second, items with factor loadings smaller than .4 were removed successively based on lowest loadings. Third, cross-loadings were inspected based on two heuristics: the .4-.3-.2-rule and the .32-threshold. That is, variables should (a) load onto their primary factor above .40, (b) load onto alternative factors below 0.30, and (c) demonstrate a difference of 0.20 between their primary and alternative factor loadings (Howard Citation2016). The .32-threshold determines an item cross-loading as .32 or higher on two or more factors (Costello and Osborne Citation2005). Exploratory Factor Analysis was conducted using the open-source software Jamovi, version 2.0 (https://www.jamovi.org/).
We use Rasch analysis, a special case of item response theory, to evaluate and improve our instrument. Rasch analysis uses a probability-based approach to assess whether observed responses fit the Rasch model (Bond and Fox Citation2015). If met, the model can identify measurement and structural properties of a scale, beyond classical test theory procedures. We performed PCA of the standardized residuals to assess uniformity, a central assumption of the Rasch model. We assessed item and person fit using Infit and Outfit MSNQ statistics, inspected rating scale functioning through Rasch-Andrich thresholds (i.e. category probability curves), evaluated differential item functioning via Mantel-Haenszel approach (Zwick, Thayer, and Lewis Citation1999) and produced Wright maps. We used Winsteps, version 4.5.5 (Linacre Citation2019) for all analyses.
Regarding the sequence of analyses, we chose to conduct Rasch analyses after exploring and establishing a preliminary factor structure via EFA to (1) confirm the unidimensionality of the factors via PCA of the standardized residuals, (2) to provide information about item difficulty, the aptness of response options, and potential differential item functioning as main outcomes to inform scale improvements (Petrillo et al. Citation2015; Van Zile-Tamsen Citation2017).
5. Results
5.1. Exploratory factor analysis
Through EFA, a first preliminary factor structure with three factors emerged. However, item FL21_rev – although reverse-scored for analysis – was found to load negatively on both factors and was therefore excluded from further analysis. Removal of this item changed the structure to a two-factor solution with one factor explaining 20.4 percent and the second factor explaining 13.7 percent of the total variance (cumulative variance: 34.0%). Communality and uniqueness values suggested that twelve items shared an insufficient amount of variance with all other variables. As their individual variation (i.e. error term) was too large, these items were excluded from further analysis. Two items were successively removed based on cross-loadings: FL11 (factor 1: λ = 0.333; factor 2: λ = 0.341) and FL33 (factor 1: λ = 0.398; factor 2: λ = 0.251). No further cross-loadings were found according to the .4-.3-.2-rule and the .32-threshold. Finally, the procedure yielded an instrument consisting of 21 items associated with two factors (see ). Factor 1 consists of twelve items, whereas factor 2 encompasses nine items, explaining a total of 39.5% of variance. This factor structure was robust to changes in extraction method and rotation. With regard to the reliability of the subscales, Cronbach’s alpha was found to be .86 for factor 1 and .86 for factor 2.
In reviewing item content, it emerges that the first nine items all belong to the hypothesized dimension 1 (Openness to feedback). The remaining twelve items are associated with hypothesized dimension 2 (Engagement with feedback) and 3 (Enactment of feedback). Based on the review of the item content and corresponding subthemes, we labeled Factor 2 as Dimension A ‘Feedback attitudes’ and Factor 1 as Dimension B ‘Feedback practices’.
5.2. Rasch analyses
5.2.1. Dimension A
Assumption of uniformity for Dimension A was assessed via PCA of standardized residuals. The Rasch dimension explained 45.6% of the variance, while the first contrast has an eigenvalue of 1.67, indicating that a potential second dimension is smaller than the strength of two items and thus negligible. This provides evidence for the unidimensionality assumption (Bond and Fox Citation2015). Based on Infit and Outfit MSNQ values > 2.0, 14 misfitting persons were identified. These cases displayed unexpected responses by indicating either too high or too low response values with respect to their ability. As many misfitting responses degrade measurement, these cases were repaired by marking the extreme responses as missing. With regards to items, no misfit was identified.
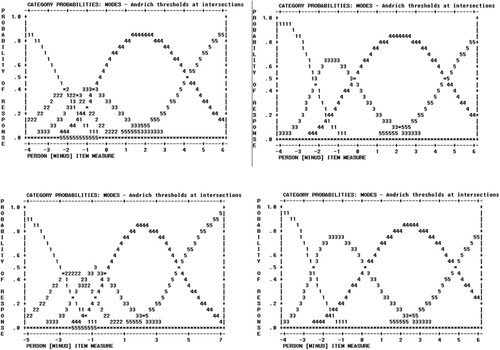
Analysis of the rating scales suggesting no disordering of rating scale categories, that is, the response options corresponded to the intended hierarchy on the subscale and item level. Response option four ‘agree’ was by far the most selected response (60%), followed by option five ‘strongly agree’ (29%). ‘Disagree’ and ‘strongly disagree’ together only accounted for 3 percent of responses. Category probability curves displayed an overlap of response categories 2 and 3 (see ). This suggests that students may not have been able to meaningfully distinguish between these two response options in the present sample. Collapsing these response categories into one provided more harmonious category probability curves (see , right). After these steps, person reliability is .82 (separation: 2.13) and item reliability is .82 (separation 2.13).
Figure 1. Category probability curves for Dimension A (top) and Dimension B (bottom) before (left) and after (right) collapsing response options.
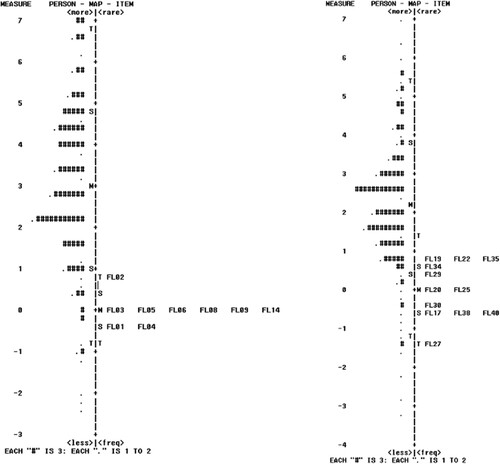
Wright maps provide an integrated visualization of item difficulty (left of Y-axis) and person ability (right of Y-axis) on a logit scale (see ). All items of Dimension A are clustered between 0 and −1 logits, the exception being item FL02 at around 1 logit. The person mean is located around 2 logits, indicating that respondents found the items relatively easy to endorse, with FL02 being the hardest and FL01 and FL04 the easiest. No differential item functioning was observed for gender. However, item FL04 (DIF size = −.76, p = .045) was easier to endorse for preschool teaching students, and item FL14 (DIF size = −.78, p = .02) was easier to endorse relative to the full sample of students. Further, item FL14 (DIF size = −.89, p = .016) was easier to endorse by second-semester students compared to more advanced students.
Figure 2. Wright maps (left: Dimension A, right: Dimension B) displaying persons and items on a linear logit scale. # corresponds to three persons, higher placements correspond to more difficulty (for items) and higher ability (for persons).
5.2.2. Dimension B
For Dimension B, PCA of standardized residuals yielded a Rasch dimension explaining 41.1% of variance an eigenvalue for the first contrast of 1.7, providing evidence for unidimensionality. Based on Infit and Outfit MSNQ values > 2.0, 19 misfitting persons were identified and misfitting responses were repaired. No misfitting items were found at this stage. As in Dimension A, no disordered response categories were identified. Response option four ‘agree’ was again the most selected response (66%), followed by 3 ‘neither agree nor disagree’ (16%) and 5 ‘strongly agree’ (14%). Category 1 ‘strongly disagree’ and 2 ‘disagree’ accounted for 5% of responses. Category probability curves again showed an overlap of categories 2 and 3. Here, too, collapsing these categories yielded smooth category probability curves. After these improvements, person reliability is .83 with a separation index of 2.21, and item reliability is .95 with a separation of 4.28. Inspection of Wright maps shows that items are distributed from 1 logit to below −1 logit, with FL27 being the easiest to endorse and FL19, FL22, and FL35 being the most difficult to endorse. This indicates a larger coverage of the construct than for Dimension A. Yet, as the person mean is located at around 2 logits, this indicates again that respondents found items relatively easy to endorse. Differential item functioning across gender was identified for item FL19 (DIF size = −.52, p = .03), in that men found this item significantly easier to endorse than expected. No differential item functioning was observed for semester or field of study.
5.3. Criterion-related validity
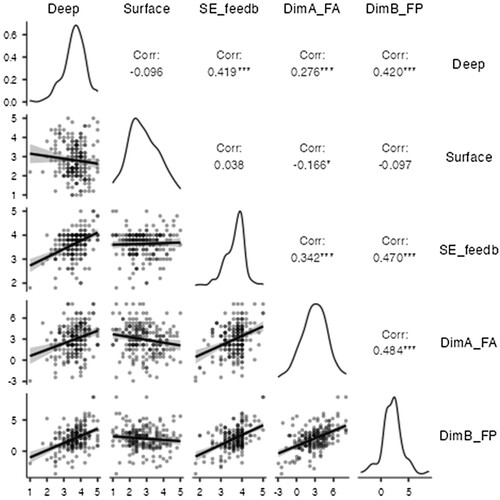
To gather further evidence for construct validity, we assessed if and to which extent the feedback literacy scale converged with theoretically related constructs (Cronbach and Meehl Citation1955; Lutomski et al. Citation2017). Raw scores were converted into Rasch scores to overcome limitations of ordinal data, as the Rasch model is able to construct actual linear measures from counts of qualitatively-ordered observations (Linacre and Wright Citation1993). Conversion tables for both dimensions can be found in Supplementary Material C. Pearson correlations were calculated with the constructs surface motivation and deep motivation of the R-SPQ-2F (Biggs et al. Citation2001), and feedback self-efficacy of the FOS (Linderbaum and Levy Citation2010). Results show significant correlations for both dimensions of feedback literacy with deep motivation, whereas feedback practices, which refer to enacted attitudes, show stronger associations than the attitude dimension (see ). Conversely, feedback literacy dimensions correlate negatively (i.e. feedback attitudes) or not at all (i.e. feedback practices) with surface motivation. Finally, both dimensions are positively and strongly associated with feedback self-efficacy.
Figure 3. Correlation matrix of feedback literacy dimensions, surface approach, deep motivation, and feedback self-efficacy. ***p < .001.
6. Discussion
An exploratory factor analysis uncovered a two-factor solution over 21 items, differing from our hypothesized three-dimensional structure. The gleaned structure has the benefit of being parsimonious, in that it is the simplest structure for describing a multidimensional construct. Most items load clearly on one factor (>.4), with limited crossloadings (≤.1), the exception being FL14 and FL17, which exhibit somewhat higher crossloadings. These properties provide a first indication of the factorial validity of the scale. During exploratory factor analysis, the cumulative variance of the model was increased as much as possible without compromising content and factor structure. Still, with both factors explaining 39.5% of variance, there remains room for improvement. In terms of reliability, classical test theory reliability of α = .86 for each of the two subscales and Rasch person reliability of .82 and .83, respectively, signal adequate properties of the instrument. Rasch separation indices of >3.0 for item separation and >2.0 for person separation further signal adequate but not ideal psychometric properties (Wright Citation1996). Inspection of Wright Maps showed that a large part of items clustered around relatively low item difficulty, implying limited coverage of the construct and restricting the instrument's capacity to distinguish high-ability students. This is particularly true for Dimension A, but also applies – albeit less severely – to Dimension B.
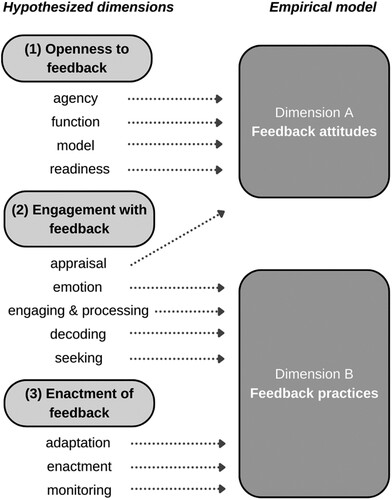
Beyond its statistical properties, the two-factor model is intuitively plausible and meaningful. With a view to the represented subthemes, the items included in the scale are both well-grounded in the literature and highly diverse in content. The items cluster distinctly as beliefs/mental dispositions toward feedback as well as active engagement/use of feedback. With respect to subtheme content, items in Dimension A reflect conceptual beliefs about feedback (model), awareness of personal responsibility (agency), willingness to use feedback (readiness), and judgment of feedback (appraisal) (see ). Dimension B is composed of items representing cognitive and behavioral engagement, including understanding (decoding), managing affect (emotion), and asking for (eliciting) feedback. It additionally encompasses the aspect of using feedback as grounds for behavioral adaptation in the learning process (adaptation, enactment, monitoring). Therefore, labeling Dimension A as Feedback attitudes and Dimension B as Feedback practices appears intuitive and consistent with the literature positing a distinction between students’ beliefs and actual engagement with feedback (e.g. Winstone et al. Citation2021).
Figure 4. Subthemes and dimensions in hypothesized (left) versus empirical model (right).
Although a two-dimensional model of feedback literacy is novel, the literature has recognized since its inception that feedback literacy involves both learners’ beliefs and attitudes as well as behavioral components. For instance, Carless and Boud (Citation2018) theorized ‘taking action’ being influenced by a combination of mental and emotional dispositions and processes. The present study now empirically clarifies that ‘taking action’ plays out on the cognitive, affective, and behavioral level, shaped by feedback attitudes accompanying or preconfiguring these behavioral components, i.e. feedback practices. This also aligns with Molloy, Boud, and Henderson (Citation2020), where categories about beliefs and attitudes (i.e. ‘commits to feedback as improvement’) appear alongside behavioral categories (‘processes feedback information’) to form their framework of feedback literacy. Thus, the present study ties in with previous research, while providing fresh and empirically-grounded theoretical insights.
One main insight is that the three features preceding ‘taking action’ (appreciating feedback processes, making judgements, and managing affect, see Carless and Boud Citation2018) were not meaningfully distinguished by the students in our sample, as evidenced by their clustering into one factor. Overall, the two-factor solution may be taken as an indication that the four features and seven categories (Molloy, Boud, and Henderson Citation2020) of feedback literacy are more closely integrated than previously expected. Differing from the six dimensions of Zhan (Citation2022), the five dimensions of Song (Citation2022), and the four dimensions of Yildiz et al. (Citation2022), our developed model provides a more straightforward view of the construct and signals the benefit of a more exploratory approach in the early stages of scale development. With an eye toward theoretical parsimony, we note the importance of further investigating which dimensional distinctions within the construct are necessary and informative before settling on a model of feedback literacy. Finally, the parsimonious factor structure has the added benefit that future short scales of the instrument can be particularly succinct, compared to instruments with many more dimensions.
The two-dimensional feedback literacy scale, once confirmed by further research, has practical implications for teaching in higher education. In light of our findings, interventions for fostering students’ feedback literacy should target both students’ attitudes and practices. In a recent scoping review, Little et al. (Citation2023) reported 16 empirical studies on feedback literacy interventions, but none of them used one of the three available psychometric instruments, likely due to their unavailability at the time. Instead, the intervention’s success was based on ad-hoc operationalizations of the construct. Little et al. (Citation2023) suggest that ‘Future studies should be clear surrounding their conceptualization of feedback literacy, which will influence how it is measured, and how findings can be synthesized across studies’ (9). Our two-factor instrument provides a clear and succinct conceptualization of the construct, which may guide future pedagogical interventions.
Following Little et al. (Citation2023), our factor structure implies that efforts to improve feedback literacy could have two main components. Feedback attitudes (Dimension A) could be addressed by educating students about the function of feedback and proposing an appropriate mental model of feedback that emphasizes student agency and reciprocity. Through reflective activities, students could be made aware of their current, possibly limited, models of feedback and guided toward a more comprehensive and productive understanding of feedback processes (see e.g. Ducasse and Hill Citation2019). On the level of feedback practices (Dimension B), students need to be given tools to emotionally process and decode feedback information. Feedback opportunities could be practiced within the class to encourage students to seek feedback, self-monitor, enact feedback, and adapt according to feedback. This is important to support confidence and intentionality in the feedback process (Little et al. Citation2023) and could be practiced via peer feedback activities and action plans. Our two-factor model can help educators make well-grounded instructional choices around feedback by providing them with a simple two-level distinction, the cognitive – affective and the behavioral. Lastly, the feedback literacy scale can also be used to evaluate the effectiveness of developed interventions.
7. Conclusion
As a work in progress, the current state of the instrument can be described as having good psychometric properties to measure student feedback literacy, albeit with some imperfections. To improve the scale, item refinement efforts should include (a) reviewing items with differential item functioning, (b) increasing item difficulty of easy items, (c) creating new items to cover more parts of the construct, and (d) reconsidering response categories. In refining the scale, confirmation of the two-factor structure (i.e. CFA) should also be done.
Aside from providing a psychometrically sound instrument for future research, the two dimensions of student feedback literacy, feedback attitudes and feedback practices, provide us with fresh insights to advance our understanding and conceptual grounding of feedback literacy in higher education. With this study, we hope to contribute to the debate of whether and how student feedback literacy can and should be quantitatively measured, despite the potential pitfall of ‘psychologizing students’ and teachers’ feedback behaviors amidst prevalent assessment and grading policies’ (Nieminen and Carless Citation2023, 1). A valid and reliable measure of student feedback literacy allows for systematic inquiries into what makes feedback effective for students with different feedback literacy, with possible implications for more adaptive or adaptable feedback practices. Also, such an instrument can provide the criterion to assess the efficacy of interventions for feedback literacy improvement (Little et al. Citation2023) or the effects of implementing feedback literacy within a curriculum (Malecka, Boud, and Carless Citation2022). Although needing further validation and improvement, this parsimonious scale provides researchers with a functioning measurement tool to investigate feedback literacy in higher education.
Ethics declaration
Informed consent for study participation as well as consent to publish the data in an academic paper was obtained from study participants prior to collecting their data. At the University where this data was collected, no ethical approval is necessary for survey studies in which informed consent is obtained by participants, as long as participants’ right to confidentiality is protected and participants who do not choose to participate are not disadvantaged.
Disclosure statement
No potential conflict of interest was reported by the author(s).
Data availability statement
The data that supports the findings of this study as well as the supplemental material are openly available at the Open Science Framework at: https://osf.io/z4tus (DOI: 10.17605/OSF.IO/Z4TUS).
References
- Anseel, F., A.S. Beatty, W. Shen, F. Lievens, and P.R. Sackett. (2015). How are we doing after 30 years? A meta-analytic review of the antecedents and outcomes of feedback-seeking behavior. Journal of Management 41, no. 1, 318–48.
- Biggs, J., D. Kember, and D.Y. Leung. 2001. The revised two-factor study process questionnaire: R-SPQ-2F. British Journal of Educational Psychology 71, no. 1: 133–49.
- Bond, T.G., and C.M. Fox. 2015. Applying the Rasch model: Fundamental measurement in the human sciences. 3rd ed. New York: Routledge.
- Brown, G.T., E.R. Peterson, and E.S. Yao. 2016. Student conceptions of feedback: Impact on self-regulation, self-efficacy, and academic achievement. British Journal of Educational Psychology 86, no. 4, 606–29.
- Brown, G.T., and A. Zhao. 2023. In defence of psychometric measurement: A systematic review of contemporary self-report feedback inventories. Educational Psychologist, 1–15.
- Butler, D.L., and P.H. Winne. 1995. Feedback and self-regulated learning: A theoretical synthesis. Review of Educational Research 65, no. 3: 245–81.
- Carless, D., and D. Boud. 2018. The development of student feedback literacy: Enabling uptake of feedback. Assessment & Evaluation in Higher Education 43, no. 8: 1315–25.
- Carless, D., and N. Winstone. 2023. Teacher feedback literacy and its interplay with student feedback literacy. Teaching in Higher Education 28, no. 1: 150–63.
- Chen, D. 2023. Toward an understanding of 21st-century skills: From a systematic review. International Journal of and Vocational Guidance 23: 275–94. doi:10.1007/s10775-021-09511-1.
- Chen, W.H., W. Lenderking, Y. Jin, K.W. Wyrwich, H. Gelhorn, and D.A. Revicki. 2014. Is Rasch model analysis applicable in small sample size pilot studies for assessing item characteristics? An example using PROMIS pain behavior item bank data. Quality of Life Research 23, no. 2: 485–93.
- Clark, L., and D. Watson. 1995. Constructing validity: Basic issues in objective scale development. Psychological Assessment 7, no. 3: 309–19.
- Costello, A.B., and J. Osborne. 2005. Best practices in exploratory factor analysis: Four recommendations for getting the most from your analysis. University of Massachusetts Amherst. doi:10.7275/jyj1-4868
- Cronbach, L.J., and P.E. Meehl. 1955. Construct validity in psychological tests. Psychological Bulletin 52, no. 4: 281.
- DeVellis, R.F. 2017. Scale development: Theory and applications. 4th ed. Thousand Oaks, CA: Sage.
- De Winter, J.C., and D. Dodou. 2012. Factor recovery by principal axis factoring and maximum likelihood factor analysis as a function of factor pattern and sample size. Journal of Applied Statistics 39, no. 4: 695–710.
- Dong, Z., Y. Gao, and C.D. Schunn. 2023. Assessing students’ peer feedback literacy in writing: Scale development and validation. Assessment & Evaluation in Higher Education, 1–16.
- Ducasse, A.M., and K. Hill. 2019. Developing student feedback literacy using educational technology and the reflective feedback conversation. Practitioner Research in Higher Education 12, no. 1: 24–37.
- Garino, A. 2020. Ready, willing and able: A model to explain successful use of feedback. Advances in Health Sciences Education 25, no. 2: 337–61. doi:10.1007/s10459-019-09924-2.
- Han, Y., and Y. Xu. 2020. The development of student feedback literacy: The influences of teacher feedback on peer feedback. Assessment & Evaluation in Higher Education 45, no. 5: 680–96.
- Han, Y., and Y. Xu. 2021. Student feedback literacy and engagement with feedback: A case study of Chinese undergraduate students. Teaching in Higher Education 26, no. 2: 181–96.
- Handley, K., M. Price, and J. Millar. 2011. Beyond ‘doing time’: Investigating the concept of student engagement with feedback. Oxford Review of Education 37, no. 4: 543–60. doi:10.1080/03054985.2011.604951.
- Harks, B., K. Rakoczy, J. Hattie, M. Besser, and E. Klieme. 2014. The effects of feedback on achievement, interest and self-evaluation: The role of feedback’s perceived usefulness. Educational Psychology 34, no. 3: 269–90.
- Hattie, J., and H. Timperley. 2007. The power of feedback. Review of Educational Research 77, no. 1: 81–112.
- Howard, M.C. 2016. A review of exploratory factor analysis decisions and overview of current practices: What we are doing and how can we improve? International Journal of Human-Computer Interaction 32, no. 1: 51–62.
- International Test Commission. 2017. The ITC guidelines for translating and adapting tests. https://www.intestcom.org/files/guideline_test_adaptation_2ed.pdf.
- Joughin, G., D. Boud, P. Dawson, and J. Tai. 2021. What can higher education learn from feedback seeking behaviour in organisations? Implications for feedback literacy Assessment & Evaluation in Higher Education 46, no. 1: 80–91. doi:10.1080/02602938.2020.1733491.
- Kasch, J., P. Van Rosmalen, M. Henderikx, and M. Kalz. 2022. The factor structure of the peer-feedback orientation scale (PFOS): toward a measure for assessing students’ peer-feedback dispositions. Assessment & Evaluation in Higher Education 47, no. 1: 15–28.
- Kim, Y., J. Dykema, J. Stevenson, P. Black, and D.P. Moberg. 2019. Straightlining: Overview of measurement, comparison of indicators, and effects in mail–web mixed-mode surveys. Social Science Computer Review 37, no. 2: 214–33. doi:10.1177/0894439317752406.
- King, P.E., P. Schrodt, and J.J. Weisel. 2009. The instructional feedback orientation scale: Conceptualizing and validating a new measure for assessing perceptions of instructional feedback. Communication Education 58, no. 2: 235–61.
- Kyriazos, T.A. 2018. Applied psychometrics: Sample size and sample power considerations in factor analysis (EFA, CFA) and SEM in general. Psychology (Savannah, Ga ) 9, no. 08: 2207.
- Lea, M.R., and B.V. Street. 2006. The “academic literacies” model: Theory and applications. Theory into Practice 45, no. 4: 368–77.
- Leenknecht, M., P. Hompus, and M. van der Schaaf. 2019. Feedback seeking behaviour in higher education: The association with students’ goal orientation and deep learning approach. Assessment & Evaluation in Higher Education 44, no. 7: 1069–78.
- Linacre, J.M. 1994. Sample size and item calibration stability. Rasch Measurement Transactions 7, no. 4: 328.
- Linacre, J. M. 2019. Winsteps® Rasch measurement computer program user’s guide. Beaverton, OR: Winsteps.com.
- Linacre, J.M., and B.D. Wright. 1993. Constructing linear measures from counts of qualitative observations. Paper presented at the fourth international conference on biometrics, Informetrics and Scientometrics, Berlin, Germany. https://files.eric.ed.gov/fulltext/ED364574.pdf.
- Lipnevich, A.A., K. Gjicali, M. Asil, & J. K. Smith. 2021. Development of a measure of receptivity to instructional feedback and examination of its links to personality. Personality and Individual Differences 169, 110086.
- Linderbaum, B.A., and P.E. Levy. 2010. The development and validation of the Feedback Orientation Scale (FOS). Journal of Management 36, no. 6: 1372–405.
- Little, T., P. Dawson, D. Boud, and J. Tai. 2023. Can students’ feed-back literacy be improved? A scoping review of interventions. Assessment & Evaluation in Higher Education, 1–14. doi:10.1080/02602938.2023.2177613.
- Lutomski, J.E., P.F. Krabbe, N. Bleijenberg, J. Blom, G.I. Kempen, J. MacNeil-Vroomen, M.E. Muntinga, et al. 2017. Measurement properties of the EQ-5D across four major geriatric conditions: Findings from TOPICS-MDS. Health and Quality of Life Outcomes 15, no. 1: 1–11.
- Mahmood, K. 2016. Do people overestimate their information literacy skills? A systematic review of empirical evidence on the Dunning-Kruger effect. Communications in Information Literacy 10, no. 2: 3.
- Malecka, B., D. Boud, and D. Carless. 2022. Eliciting, processing and enacting feedback: Mechanisms for embedding student feedback literacy within the curriculum. Teaching in Higher Education 27, no. 7: 908–22. doi:10.1080/13562517.2020.1754784.
- Molloy, E., D. Boud, and M. Henderson. 2020. Developing a learning-centred framework for feedback literacy. Assessment & Evaluation in Higher Education 45, no. 4: 527–40.
- Nießen, D., M. Partsch, and B. Rammstedt. 2018. Data for: An English-language adaptation of the social desirability–gamma short scale (KSE-G). GESIS data archive. https://zis.gesis.org/skala/Nie%C3%9Fen-Partsch-Kemper-Rammstedt-Social-Desirability-Gamma-Short-Scale-(KSE-G).
- Nieminen, J. H., and D. Carless. 2023. Feedback literacy: A critical review of an emerging concept. Higher Education 85, no. 6: 1381–400.
- Petrillo, J., S.J. Cano, L.D. McLeod, and C.D. Coon. 2015. Using classical test theory, item response theory, and Rasch measurement theory to evaluate patient-reported outcome measures: A comparison of worked examples. Value in Health 18, no. 1: 25–34.
- Song, B.K. 2022. Bifactor modelling of the psychological constructs of learner feedback literacy: Conceptions of feedback, feedback trust and self-efficacy. Assessment & Evaluation in Higher Education 47, no. 8: 1444–57.
- Strack, F. 1992. “Order effects” in survey research: Activation and information functions of preceding questions. In Context effects in social and psychological research, eds. N. Schwarz, and S. Sudman, 23–34. New York, NY: Springer.
- Strijbos, J.W., R. Pat-El, and S. Narciss. 2021. Structural validity and invariance of the feedback perceptions questionnaire. Studies in Educational Evaluation 68, 100980.
- Sutton, P. 2012. Conceptualizing feedback literacy: Knowing, being, and acting. Innovations in Education and Teaching International 49, no. 1: 31–40.
- Van der Kleij, F.M., L.E. Adie, and J.J. Cumming. 2019. A meta-review of the student role in feedback. International Journal of Educational Research 98: 303–23.
- Van Zile-Tamsen, C. 2017. Using Rasch analysis to inform rating scale development. Research in Higher Education 58, no. 8: 922–33.
- Wang, Y., A. Derakhshan, Z. Pan, and F. Ghiasvand. 2023. Chinese EFL teachers’ writing assessment feedback literacy: A scale development and validation study. Assessing Writing 56, 100726.
- Winstone, N., and D. Carless, eds. 2019. Designing effective feedback processes in higher education: A learning-focused approach. Routledge.
- Winstone, N.E., E.G. Hepper, and R.A. Nash. 2021. Individual differences in self-reported use of assessment feedback: The mediating role of feedback beliefs. Educational Psychology 41, no. 7: 844–62.
- Winstone, N.E., G. Mathlin, and R.A. Nash. 2019. Building feedback literacy: Students’ perceptions of the developing engagement with feedback toolkit. Frontiers in Education 4: 39.
- Winstone, N., R.A. Nash, M. Parker, and J. Rowntree. 2017. Supporting learners’ agentic engagement with feedback: A systematic review and a taxonomy of recipience processes. Educational Psychologist 52, no. 1: 17–37. doi:10.1080/00461520.2016.1207538.
- Wisniewski, B., K. Zierer, and J. Hattie. 2020. The power of feedback revisited: A meta-analysis of educational feedback research. Frontiers in Psychology 10: 3087.
- Wright, B.D. 1996. Reliability and separation. Rasch Measurement Transactions 1996 9, no. 4: 472.
- Yildiz, H., E. Bozpolat, and E. Hazar. 2022. Feedback literacy scale: A study of validation and reliability. International Journal of Eurasian Education and Culture 7, no. 19, 2214–49.
- Zhan, Y. 2022. Developing and validating a student feedback literacy scale. Assessment & Evaluation in Higher Education 47, no. 7: 1087–100.
- Zwick, R., D.T. Thayer, and C. Lewis. 1999. An empirical Bayes approach to Mantel-Haenszel DIF analysis. Journal of Educational Measurement 36, no. 1: 1–28.