
ABSTRACT
Unemployment refuses unambiguous definition. Its statistical representation is always open to contestation, especially where labour markets differ from the Western-industrial norm. Why do countries adopt international standards even if they may fit local conditions poorly? South Africa is an exemplary case to answer this question. When Apartheid ended in the early 1990s, South African statisticians embraced the new emancipatory spirit. Their broad unemployment indicator defied international conventions but did justice to the marginalised Black population, and to Black women in particular. Since then, however, South Africa has fallen in line with the much narrower definition of the International Labour Organization (ILO), in spite of widespread criticism. Why? We find that ILO standards were not forced upon South Africa. Instead, South African statisticians themselves embraced international standards to repel charges of arbitrary or politically motivated numbers. Counterintuitively, international standards become alluring precisely when doubts about statistics’ fit with local conditions are the greatest.
Introduction
For people who want to work, the inability to find employment can be a source of enormous hardship – economically, socially and personally. For societies at large, widespread unemployment is a fundamental political challenge. When labour market conditions are particularly dire, unemployment may be the central economic problem to be tackled. Effective policy and informed public debate, in turn, hinge on an accurate understanding of the size and shape of the issue. Statistics about unemployment are central to the fight against it.
Unemployment is not a natural category (Salais et al. Citation1986). Nineteenth century labourers pushed for censuses of the nascent working class to reveal its plight (Desrosières Citation1998). At their inception, unemployment statistics were a weapon for class struggle. Since then, just how we should conceptualise joblessness has been contested: who is included in the figures and who is not, how much do you have to work to fall in one or the other category, and so on (Baxandall Citation2004, Zimmermann Citation2006). These measurement choices are highly consequential: they highlight or obscure changes in labour markets and people’s working lives, and the statistics based on them guide policymakers and the public’s understanding (Gautié Citation2002, Hoskyns and Rai Citation2007). Unemployment statistics, in short, are deeply political: their definitions create winners and losers, and they lead us to ask who writes them in the first place (Desrosières Citation1998).
We know little about such indicator politics outside the OECD world. That is surprising. Labour market conditions in many developing countries are strained, and in the absence of strong welfare states, joblessness threatens people existentially.Footnote1 Yet it is not obvious that the essentially Western concept of unemployment (Garraty Citation1979, Topalov Citation1994) is well-suited to developing country labour markets. Subsistence agriculture is widespread outside large cities. Labour markets are highly segmented, often along racial or ethnic lines. And large parts of the population may find themselves in informal, precarious employment, below the statistical radar. These features complicate labour market statistics, and they enlarge the scope for political fights about them. At the same time, poorer countries often have asymmetrical and fraught relationships with international organisations, whose push for harmonised statistical standards may meet little enthusiasm on the ground. It is not clear why developing countries would stick to international statistical standards at odds with their socio-economic realities.
This article sets out to map and explain such unemployment indicator politics in South Africa. Joblessness has been an enormously political challenge in the country (Kingdon and Knight Citation2001). Unemployment there is one of the highest in the world: different measurement approaches put it somewhere between 26 and 38 percent in the first quarter of 2018.Footnote2 The central difference between these estimates lies in the treatment of ‘discouraged work seekers’, people who do not count as unemployed following the ILO definition but would still like to work.
Over the past two decades, South Africa has increasingly embraced the narrow ILO definition of unemployment and privileged it in its unemployment statistics – even if it remains politically disputed and arguably ill-suited to the country. Our central question is what has pushed South African unemployment statistics in this surprising direction. We can break it down into a descriptive-empirical as well as a more theoretical question: what have been the main political fights over unemployment statistics in South Africa since the mid-1990s? And which factors explain the choices that have been made?
Counterintuitively, South Africa has embraced international standards not in spite of their limited fit with domestic conditions, but precisely because of these difficulties. Defining and measuring unemployment in South Africa is such a fraught endeavour that every practical solution has immediately invited plausible criticism. Politicians quickly cast doubt on official figures: political incumbents – in particular the African National Congress – have criticised figures as too high; those in political opposition or advocating for the labour movement have embraced the opposite position. These criticisms have gnawed at the credibility of Statistics South Africa (Stats SA) – the official office for national statistics – even when the problem has not been the agency’s competence and determination, but rather the fundamental mismatch between the structure of the South African society and economy, and unemployment as a concept.
The ultimate choice for a narrow official definition has been driven by the wish to conform to international standards. The latter have not been forced on South Africa. Instead, they have been embraced bottom-up to buttress South Africa’s credibility with the international community as well as that of national statisticians vis-à-vis the political class, and to allow at least a superficial (if ultimately misleading) comparability between South Africa’s labour market conditions and those in the rest of the world.
This article builds on 25 interviews, conducted in 2018, with present and past South African statisticians, labour and business representatives, researchers, politicians and consultants, as well as on a range of primary documents about statistical debates and development there. It is structured as follows: the next section outlines the main insights social scientists have gathered about the political nature of unemployment indicators in Europe and North America and asks how well we should expect them to travel to developing countries. In the body of this article we then detail the two main phases in which South African unemployment statistics have been embattled and demonstrate how the quest for legitimacy has driven Stats SA to embrace an unemployment definition that matches local circumstances poorly. Our conclusions outline the implications of the South African experience for our thinking about the politics of economic statistics more generally and in developing countries in particular.
The Politics of Unemployment Indicators
Ubiquitous as internationally harmonised economic indicators are these days, they had been devised for domestic purposes: to evidence the plight of the nineteenth century working class in case of unemployment (Salais et al. Citation1986) and cost of living indicators (Stapleford Citation2009); to facilitate macroeconomic management in the case of gross domestic product (GDP), whose predecessors were developed in the 1930s and 1940s (Lepenies Citation2013). Economic statistics, in other words, were tailor-made for Western industrialised nations, and they had clear political purposes.
Their global spread only gathered pace after the Second World War (Ward Citation2004). International organisations such as the International Labour Organisation (ILO), the United Nations, and later the International Monetary Fund, the World Bank and the Organisation for Economic Co-operationand Development proselytised for their use and the developmentalist ideas underlying them (Masood Citation2016). Such governance by numbers has extended further with Millennium Development Goals and Sustainable Development Goals, which champion indicators as tools for economic and social development (Taylor Citation2016). Indeed, global benchmarking has emerged as a prominent all-purpose mode of transnational governance (Desrosières Citation1998, Davis et al. Citation2012, Jany-Catrice Citation2012, Broome and Quirk Citation2015, Cooley and Snyder Citation2015, Kelley Citation2017), with indices covering everything from gender equality and business climates to financial opacity and good governance.
Globally proliferating quantification can suffer from shortcomings that parallel those we find in domestic governance by numbers (Porter Citation1995): statistics’ air of objectivity and accuracy can hide shoddy methodologies (Broome et al. Citation2018), poor data (Jerven Citation2013, Linsi and Mügge Citation2019), outdated policy priorities (Fioramonti Citation2013), and biases in the data (Mügge Citation2019). These below-the-radar politics of economic statistics motivate us to investigate political fights over South African unemployment measures and the roles that domestic actors and international organisations play in them.
In public and political discourse, the official unemployment rate often functions as the de facto thermometer for national labour market conditions. Across history and societies, quite different phenomena have been collected under the heading ‘unemployment’ (Zimmermann Citation2006). On the one hand, unemployment as a label, and the statistics later built on it, consciously recognised that joblessness was not necessarily a sign of individual failure but could be caused by structural economic factors beyond personal reach. This framing of joblessness attenuated the moral opprobrium attached to it and shifted part of the responsibility for the plight of the unemployed onto governments (Gautié Citation2002).
Unemployment statistics as they solidified after the Second World War in Europe and the USA increasingly coalesced around a clear prototype:
An able-bodied, prime-age male industrial breadwinner with plant specific skills who [had] been laid off from full-time formal work as the result of a plant closing in a declining industry. (Baxandall Citation2004, p. 212)
On that basis, employment statisticians typically distinguish three categories of people: the employed, the unemployed, and the economically inactive. People in both the second and third groups have no jobs. However, the unemployed want a job, are available for one and are actively searching; the economically inactive normally fail the last criterion (Green Citation2000). The ‘active search’-criterion functions as a litmus test to gauge whether joblessness is voluntary or not.
This approach has shortcomings, as statisticians themselves concede (for example Sengenberger Citation2011 from the ILO). It excludes people who want a job but do not look for one because they are discouraged or deem their qualifications insufficient (Kingdon and Knight Citation2001). In many Western countries, controversies about unemployment statistics have focused on such involuntary economic inactivity (Baxandall Citation2004). Indeed, in 1982 the International Conference of Labour Statisticians included two distinct definitions in its guidelines: a narrow one, excluding the jobless who wanted work but did not search actively, and a broad one, which did include this group. In practice, most countries around the world have settled on the narrow definition as the official headline figure. This choice matters because it shapes the political priority attached to reducing unemployment of one or the other kind. Governments are likely to develop very different policies via-a-vis the people who fall between the two definitions, not least the welfare measures benefitting them.
A second contentious aspect of the ILO definition gains particular significance in developing countries: the unemployed have to be available for work. In Western contexts, that means being ready to begin work more or less right away – impossible only under special circumstances, for example due to impending childbirth or medical constraints. By implication, the unemployed are those people for whom the main barrier to a job is that the right one simply cannot be found.
In poor countries, the reasons not to be available may be very different. Rural subsistence farmers, for example, might long for formal employment but be unable simply to take up a paid job. Their whole life situation, as that of their dependents, may forbid that, and the employment sought may not be anywhere nearby. Even if someone is unable to walk away from her living situation – not ‘available’ and hence not unemployed – there may still be a serious labour market problem (Kingdon and Knight Citation2001, Posel et al. Citation2014).
Because of their monetary bias (Mügge Citation2019), economic statistics systematically sideline unremunerated (reproductive) labour, much of which is done by women within households (Hoskyns and Rai Citation2007). Such gender bias also feeds into unemployment statistics, and the gap between narrow and wide definitions: because a disproportionate share of household and care responsibilities lands on their shoulders, women are often not available for paid employment, even if – under a more equal division of tasks between men and women – they might be happy to seek employment, not least to buttress their economic independence. A narrow unemployment rate can thus hide the specific socio-economic difficulties women face.
High South African unemployment rates have repeatedly been doubted with the argument that, if joblessness really were that sky-high, we should witness large-scale riots. Yet in fact, socio-economic deprivation may be institutionalised:
The elaborate mechanisms of proletarianization, repression, and discrimination not only impoverished indigenous people physically, but probably did even more psychological damage. As soon as family and other social structures were disrupted, the disciplinary and civilising effects of those traditional structures were undermined. In this way a subculture – or syndrome – of poverty was institutionalised among poorer Africans and coloureds. (Terreblanche Citation2002, p. 40)
The question is how, among all the imperfect and potentially ill-fitting options, that single leading labour market indicator is constructed – which in turn dominates policy, public debate and external perceptions (cf. Khan et al. Citation2015). The literature offers several hunches, which we take as inspirations as we investigate the indicator politics in South Africa. Most obviously, politicians may tinker with definitions to embellish their economic achievements or, if in the opposition, detract from those of the ruling government (Moon and Richardson Citation1985). Second, international organisations such as the ILO and the United Nations have promulgated standards such as the System of National Accounts since the end of the Second World War (Ward Citation2004, Clegg Citation2010). It is unclear, however, how these internationalisation effects have played out in developing countries, where the gulf between international standards and the local situation may be particularly wide. Third, measurement approaches can become path-dependent once specific policy commitments are attached to them (Baxandall Citation2004, p. 216), such as workers’ rights to financial assistance. The interests that congeal around particular definitions may serve to entrench them. To what degree do these hunches help us make sense of the politics surrounding unemployment indicators in South Africa?
Unemployment Measures and the end of Apartheid
South African statistics have always been tightly linked to the country’s idiosyncratic politics and followed a strict racial logic. Its Current Population Survey (CPS) measured the Whites, the Coloureds and the Indians (as the categories went) until 1990 (Standing, Sender and Weeks Citation1996). The Black Africans, in contrast, were excluded. For the rest, the Central Statistical Service (CSS) mainly concentrated on Whites (Lehohla Citation2002). Nevertheless, already in the 1970s and 1980s, South African debates about unemployment statistics asked how much of it was in fact voluntary (Standing et al. Citation1996). Some argued that many rural-dwellers chose to be unemployed, content with subsistence agriculture (Kantor Citation1980, Gerson Citation1981); others pushed back (Simkins Citation1982, Kingdon and Knight Citation2001).
The apartheid legacy is fundamental to understand the specificities of South African labour markets and why narrow definitions may be particularly ill-fitting. Rural unemployment in the country is higher than urban unemployment because apartheid had severely restricted blacks’ mobility. Black homelands were rural areas with poor land and little formal employment.Footnote3 For people living there, finding paid work often meant waiting for formal-sector job opportunities to arise far away, outside the homelands. The geographical and racial mismatch between where people live and where employment is to be found mars South African labour markets to this day.
Apartheid legacies continue to shape present-day labour markets in other ways, as well: through highly unequal access to education (du Toit and Neves Citation2014) as well as through a large (and again racialized) informal economy (Rogerson Citation1992, Chandra et al., Citation2002). Given the history of unequal access to paid employment, unpaid and highly gendered household labour continues to play a central role especially for poor South African families (du Toit and Neves Citation2014, p. 834, Cousins et al. Citation2018).
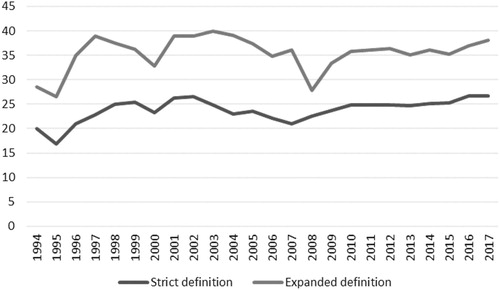
In addition, Apartheid-age repression of black labour had meant that it was available cheaply, not least for the labour-intensive resources extraction and agricultural sector. International boycotts and foreign companies’ reluctance to invest in Apartheid South Africa had held productivity growth back. Post-apartheid economic modernisation then meant that catch-up productivity growth hurt demand for labour. 500.000 jobs were lost in the first five years of democratic government, while an additional 450.000 young people entered the formal labour market. By whichever measure, unemployment skyrocketed (Cling Citation1999), as shows.
Figure 1. Labour Market Evolution since 1994 (%). Source: authors, based on Stats SA databases and statistics publications.
In 1994, the democratic movement in South Africa released the Reconstruction and Development Programme (RDP), which focused on redistribution following a Keynesian paradigm (Adelzadeh Citation1996, Koelble Citation2004). Two years later, the government shifted to an orthodox economic reform programme, encouraged not least by the major conglomerates of the country and the wish to attract foreign direct investment (Carmody Citation2002, Hamilton Citation2014). This international orientation, as we will argue below, eventually bolstered the case for adoption of international standards, including in economic statistics.Footnote4
The government opted for ‘regulated flexibility’ of the post-1994 labour market: minimum wages, combined with a recognition of a two-tier labour market of permanent, protected workers, as well as temporarily employed and less protected ones. Overoptimistically, the government had banked on a nine-fold increase in foreign direct investment (FDI) to meet employment targets. In the event, South Africa registered a net FDI outflow of around $1.6 billion between 1994 and 1999 as domestic companies internationalised. Old cleavages in South Africa’s labour market therefore have persisted, as does stifling unemployment and rampant inequality (the Gini coefficient varied between 0.66 and 0.70 between 1993–2012, see Isaacs, Citation2016).
Table 1. October Household survey, 1994–1997: unemployment rates.
The abolition of apartheid legislation in 1991 and the wider economic and political reversals in its wake brought challenges for economic statistics, too. The October Household Survey (OHS) of 1993 was the first one that aspired to include the entire population. The mission was to transform the CSS, formerly part of an oppressive apartheid state, into a democratic institution. In 1994, the government set up a task force to craft what would eventually become the Statistics Act. With the assistance of the Swedish, Australian and Canadian statistical agencies, it published a widely discussed policy paper in 1997; two years later, Stats SA was established and enshrined as the only institution producing official statistics (Stats SA Citation1999).
With the apartheid approach discredited, statistical standards were up in the air. Using this opening, the CSS defied international practice and adopted the expanded unemployment definition in the first 1993 OHS (Bangane Citation1999).Footnote5 It stuck to this definition for the subsequent years. An official report on the 1995 OHS defined unemployment as follows:
The proportion of people in the economically active population who are not in paid employment or self-employment at a given point in time, but who are available for work or for other income-generation activities, and who want to be employed or self-employed. (CSS Citation1996, p. 15)
This approach was a conscious policy decision. As Mark Orkin and Ros HirschowitzFootnote6 explained in the same report:
It has been widely recognised that the strict definition is too limited in the present South African context, where employment opportunities are extremely limited, and many unemployed people have ceased to seek work actively […] This applies mainly to women, particularly those in rural areas, where employment or income-generating activities are scarce, and transport is expensive. The unemployment rate is consequently defined by the CSS in terms of the expanded definition. (CSS Citation1996, p. 14–15)
Figure 2. Unemployment Rates by Race and Gender (%). Source: October Household Survey, 1995.
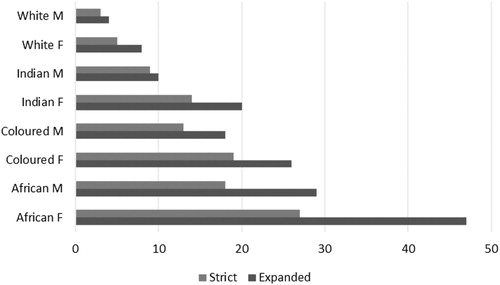
Three features are particularly striking: the unemployment rates vary strongly in line with the different racial categories, unemployment rates are substantially higher for women across all racial groups, and – most important for our purposes – the gap between the strict and expanded definitions is particularly high for Black South Africans and for women. In effect, economic inactivity that might potentially count as unemployment is Black, and it is heavily female. That gives the differing definitions a clearly gendered and racialized charge. In early post-Apartheid South Africa, CSS officials consciously defied international conventions and used unemployment definitions that would avoid such biases.
The Creeping Rise of an ‘Official’ Definition
No single indicator – narrow or broad – can answer all questions about labour markets. A struggle over indicator definitions therefore is a struggle over which perspective is highlighted and which one is sidelined. When several definitions and time series exist side by side, it still matters which one is designated as the ‘official’ set of figures, relegating competing data to a secondary status. During the second half of the 1990s, the narrow unemployment definition creepingly emerged as the ‘official’ one – setting the stage for the increasing marginalisation of the broad definition in the two decades to follow.
In South Africa, this definitional struggle has played out between the politician who, as minister, was in charge of economic statistics, and the head of statistics himself. Trevor Manuel has been minister in South African governments from 1994 to 2014, covering a range of portfolios. During the transition from CSS to Stats SA, he was in charge of statistics as Minister of Trade and Industry. Realizing how crucial statistics were for economic and political development of South Africa, Manuel fought hard for their reform once apartheid had ended (Green Citation2008). The debate was deeply politicised, as Ravi Naidoo, director of the National Labour and Economic Development Institute in the 1990s and early 2000s and part of the Statistics Council remembers:
It was very contentious because the [trade] union was keen to say that unemployment was a much bigger problem. And that therefore the government should be proactive in the economy. Whereas business, at that time, was happy to say we don’t need much intervention […] The fight was really to make the government more interventionist, because we had a very conservative economic team then in government. (Interview with Ravi Naidoo, Johannesburg, 2018)
A ‘wage-citizenship nexus’ took a central role in the post-apartheid South Africa (Barchiesi Citation2011). A strong focus on ‘jobs’ normalised paid work at the centre of the liberation of South Africans but, by implication, excluded non-wage workers. This narrative combined economic modernisation and formalisation with a catch-up to neoliberal, efficiency- and productivity-driven economic policies fashionable elsewhere in the world at the time (cf. Ferguson Citation2015).
After an initial phase in which statistical development was mainly inspired by the wish to shed Apartheid-legacies, public statistics professionalised. Statistics SA gained increasing autonomy through the Statistical Act of 1999. According to Peter Buwembo, chief director of the Quarterly Labour Force Survey, this autonomy became crucial for Stats SA:
That is the good thing, they give us enough space, good space. They don’t tell us at all what to do, they have to accept what we say. It is a story from a long time ago, when the minister [Manuel] said ‘don’t give me what I want to hear but what I need, what I need to understand, because what I cannot measure, I cannot manage it.’ Nobody asked for figures before. They get to know them at the same time as everybody, in the media. We have a strong Act; it helped us. (Interview with Peter Buwembo, Pretoria, January 2018)
This changed status also meant that methodological and inferential considerations – rather than purely political ones – increasingly gained weight. Hence, the first challenge to the broad definition – which asked whether people ‘wanted’ to work rather than whether they were ‘looking for a job’ – was rooted in a statistical argument about robustness. A 1998 Stats SA report critically noted that
the expanded unemployment rate does, however, introduce more subjectivity into the measure of the unemployment rate, and instability in tracking trends, as it is more difficult to distinguish what constitutes ‘wanting’ a job than to say whether someone has engaged in definite actions to find one. (Stats SA Citation1998, p. 63)
It was clear to all involved that people’s labour market situations come in many shades of grey. Nevertheless, translating those nuances into hard and fast categories presented difficulties of its own. One option was a ‘very expanded’ definition of unemployment, including even the jobless who professed no desire for employment.Footnote7 The other one was to classify the ‘not looking’ simply as economically inactive. shows the difference this categorisation makes.
The gaps between the figures were vast. The eventual compromise between Orkin and Manuel was to publish the narrow and the expanded numbers, with all attendant detail (age, sex, region, and so on.), but to designate the narrow yardstick as the official one (Green Citation2008).
As a former sociologist, who’s worked for [the Congress of South African Trade Unions] and for Jay Naidoo [its leader until 1993], we wouldn’t gain by ceasing to report the expanded definition, so now we report both. (Interview with Mark Orkin, Johannesburg, 2018)
Table 2 Official and Expanded unemployment rates measured by OHS 1994–97, and corollaries.
The second driver behind the narrow measure came from outside South Africa in the form of ILO standards. To be sure, the ILO did not impose its definitions in any way. Yet in the years after the immediate post-Apartheid enthusiasm, South African politicians felt a need to build international credibility, including by adherence to international technical norms and standards. The desire seemed to justify privileging a strict measure, and an increasing use of international consultants and rising regard for social development indicators further pushed South Africa in that direction.
The ILO definition granted countries some leeway in the treatment of the jobless who were not looking for a work, depending on the labour market structure and social constraints for job-searchers and non-searchers (Hussmanns et al. Citation1990, p. 107–108). That said, a 1996 ILO report stressed that including the non-searching unemployed might exaggerate unemployment (Standing et al. Citation1996). The ILO would tolerate the broad definition, but clearly not encourage it, and indeed three quarters of countries around the world ignored the jobless who were not actively looking for work from their unemployment statistics (Posel et al. Citation2014, Stats SA Citation1998).
On top, Orkin, and then Hirschowitz, argued that the broad definition would dent the country’s investment ratings through an excessively gloomy picture of economic conditions and disadvantage it in the international use made of comparative statistics (Green Citation2008; Interviews). Hence, South Africa published its new official unemployment rate following ‘widely-accepted international practice’ (Stats SA Citation1998, p. 11).Footnote9 The ILO supported the effort and assisted South Africa in tackling the many practical problems they confronted in building new statistics, remembers Neva Makgetla of the Trade & Industrial Policy Strategies Institute:
The ILO provided a lot of help to set up the system. Before 1994, even in the census Africans were not counted at all if they were in the former so-called ‘homelands’ – at that time close to half the population – and they only counted 10 percent of Africans living in the nominally ‘White’ areas. The then Central Statistical Office had no idea how to manage a survey of any kind that included Africans fully. They were themselves all White, for a start … (Interview with Neva MakgetlaFootnote10, Johannesburg, 2018)
The move towards international standards was buttressed by international consultants who supported Orkin and his team. The Swedish programme for example assisted not only with strategic management systems and the development of provincial offices and census planning; it also helped to refine household survey methodologies and to improve South Africa’s national accounts (Stats SA Citation1999). Transnational expert networks helped diffuse de facto international standards.
The 2000s: Discouraged Work Seekers or an Expanded Definition?
If the 1990s had earned the narrow unemployment indicator the ‘official’ label, the 2000s solidified this position. The September 2004 Labour Force Survey (LFS) was the last to detail the expanded unemployment as much as the strict, official one. After that, the broad unemployment indicator became an occasional, ancillary shadow statistic – even if debate has refused to die down about the ‘discouraged work seekers’-category and the misfit of international standards with South African conditions.
Early in the 2000s, statisticians were still content defending the legitimacy of both unemployment measures. In a 2002 briefing Hirschowitz, then Deputy Director-General for Quality and Integration, was ask to respond to criticism of the official (ie, narrow) unemployment figures from the Congress of South African Trade Unions (COSATU), the largest trade union confederation in the country. She replied that
there is an official and an expanded definition of unemployment. Countries are given the discretion to use either definition depending on the circumstances […] both definitions are valid in South Africa and therefore Stats SA used both of them. (Finance Standing Committee Citation2002)
By 2005 the broad unemployment rate had reached roughly 40 percent. Finance minister Manuel – earlier a supporter of a flexible approach – was incredulous: ‘If 40 percent of South Africans were really unemployed, there'd be a revolution.’ He warned that unemployment figures should not simply be ‘bandied about’. ‘Sure, unemployment is a problem,’ he said, ‘but that figure is wrong.’ (IOL Citation2005)
in March 2004 there were at least 4 million South Africans walking about in our villages, our towns and cities ‘actively looking for work’. This is such a large number of people that nobody could possibly have missed the millions that would be in the streets and village paths ‘actively looking for work’ in all likely places of employment. It, therefore, seems quite unlikely that the Stats SA figure is correct, if indeed it used the standard international ILO definition to determine the unemployment rate. (Mbeki Citation2005)
In the LFS from September 2004, expanded unemployment numbers had been relegated to the annexes. Half a year later, the March 2005 LFS replaced the ‘expanded unemployment’ category with a separate entry for ‘discouraged work seekers’ – the jobless who wanted a job and were available but had not sought work because no jobs were available in the area, because they were unable to find work requiring their skills, or because they had lost hope of finding any kind of work (Stats SA Citation2009). The statistics increasingly walled off the formally unemployed from other people in want of work.
This shift attracted political attention. The opposition decried the narrowness of the indicator. In October 2005, the Finance Standing Committee questioned dropping the broad definition of unemployment ‘as the strict definition did not accommodate the large informal and self-employed sector, which needed to be measured’ (Finance Portfolio Committee Citation2005). The South African Reserve Bank (SARB) also raised doubts, given the importance of unemployment for its monetary policy. Hirschowitz offered three defences: first, a separate ‘discouraged work seekers’ category would allow better identification of this group’s characteristics. Second, the new approach followed recommendations by the IMF, which had reviewed South African labour statistics. Third, the old presentation might confuse people who would ‘[compare] South Africa’s broad definition with other countries’ strict definitions’. Ian Davidson of the opposition Democratic Alliance remained unimpressed, fearing a growing disconnect between the real and the statistical world. The new approach would not provide the necessary information about the difference between the broad and strict unemployment definitions. ‘The broad category of unemployment must be retained and captured as it would reflect the real jobless rate’ (Ibid).
Spats continued between observers who found the figures too high or too low, and they further discredited the home-grown measures. Pali Lehohla, Statistician General until 2017 and Orkin’s deputy before 2000, conceded that Stats SA ‘had previously suffered negative publicity regarding the accuracy of its statistics pertaining to its community survey, after irresponsible reporting by a certain journalist [..] and after allegations’ (Finance Standing Committee Citation2008). However, the ‘narrow definition was adopted for international comparability and hence was the official definition for unemployment’, he avowed (Ibid).
To regain credibility, Stats SA asked the World Bank to review its statistical approach (interview with Peter Buwembo, Pretoria, January 2018). Heeding the Bank’s advice, Stats SA completely overhauled its survey design and shifted from the bi-annual LFS to a Quarterly Labour Force Survey (QLFS) (Yu Citation2009).
The report introducing the new statistical tools highlights conformity with ‘internationally acclaimed practices’ (Stats SA Citation2009, p. 19) no less than six times. To avoid being ground up between politically opposing domestic parties, national statisticians sought refuge among international statistical experts and their standards. That spirit lingers. In the words of Rashad Cassim, head of the SARB research department, former Deputy Director-General at Stats SA and member of the Statistics Council:
We really invest in making sure that what we do is keeping international practices. So we follow very strictly the ILO convention around what is considered an informal worker, what is considered a discouraged worker. (Interview with Rashad Cassim, Pretoria, February 2018)
Through this full embrace of ILO definitions, the ambiguity about where unemployment ends and genuine inactivity begins in South African statistics disappeared: the QLFS unequivocally files discouraged work seekers under ‘not economically active’. It has remained that way since (see , taken from the first QLFS 2018).
Table 3. Key labour market indicators, as presented in the first QFLS 2018.
The Evolution and Debates Until Today
In specialist circles, the debate about these categories continues. As always with statistical categorisation, the devil is in the detail. Reviewing the first QLFS of 2008, Meth observed that
it would seem that in the past, those who said that they lacked the money to pay for transport to seek work, or who said that there was no transport available, were classified as discouraged. The new definition no longer includes such folk, an important change, and one which deserves to be widely debated, especially in view of apartheid’s horrible distortions of South Africa’s spatial economy. (Meth Citation2009, p. 84)
The challenge that you have is the tools [are] not designed for lower levels. There are certainly pockets of unemployment in certain provinces for a lot of reasons. I will give you some examples. It’s called Murraysburg and the closest town, a big town, is Graff-Reinet. So the challenge for those people is that they don’t have the money to go to Graff-Reinet and register. So they may do for a few months and after they stop doing that. (Interview with Faldie Esau, Cape Town, May 2018)
Some people prefer to use the broader [definition], because they have some interest, especially the unions. (Interview with Peter Buwembo, Pretoria, January 2018)
The important thing, of course, is what you are trying to reflect – the ratio of people seeking work actively to the employed, or the ratio of those who want work, even if they’ve given up looking for it. [..] People who don’t actually work with the numbers often fetishize them – there were some people in COSATU who insisted on the broad figure mostly because they wanted to get government to prioritise unemployment more. (Interview with Neva Makgetla, Johannesburg, May 2018)
Thus, in South Africa, finding employment is widely seen as the key to escaping poverty. Political debates hence revolve around unemployment and poverty, but sideline the large number of working poor, who do not fit the jobs vs. poverty dichotomy. In 2012, more than a fifth of workers lived in households unable to meet basic needs, and 58 percent of poor South Africans lived in a household with an employed person (Rogan and Reynolds Citation2015). Indeed, Scully (Citation2016) calculated that 42 percent of South Africa’s employed labour force can count as precarious, such that unremunerated labour in the household and beyond remains essential to people’s survival strategies. Dominant views of unemployment effectively hide such problems.
Where criticism from the unions tends to cast unemployment figures as too low, criticism from the business sector has veered in the opposite direction. In 2011 the Adcorp work agency and consultancy avowed that the actual unemployment rate was only around 11.3 percent (Harding Citation2014), as opposed to the official 24.8 percent. Adcorp economist Loane Sharp observed that this latter number is ‘simply incredible, because we should have expected civil disobedience and disorder on a grand scale if this were true’ (Harding Citation2014). Whence this discrepancy between the real and the official numbers? Stats SA vastly underestimated informal employment, Adcorp argued, and should add more than six million people to its employment figures. The Adcorp methodology immediately drew academic fire (Wittenberg and Kerr Citation2012), but also fuelled doubts about the reliability and usefulness of official statistics (van der Berg Citation2013).
On the back of such incessant debate, the Finance Standing Committee debated the unemployment definition yet again in May 2013. Speaking for the Democratic Alliance, Tim Harris suggested that ‘Stats SA be asked to compile data on the broader definition to enable the Committee to get a better picture of the situation’ (Finance Standing Committee Citation2013). The former Deputy Director-General of Stats SA agrees:
I do think that saying that the narrow unemployment rate is 27 percent is misleading. Because at the end of the day you’re saying that discouraged workers are technically not part of your unemployment, because they technically stopped looking for a job. So because they stopped looking for a job, they are not unemployed anymore. But they’ve stopped looking because they couldn’t find [one]. So my view is that although, in terms of comparability, we give the narrow definition, I do think as a country we constantly have to give two together […] And we should be constantly monitoring why these discouraged workers are discouraged. (Interview with Rashad Cassim, Pretoria, February 2018)
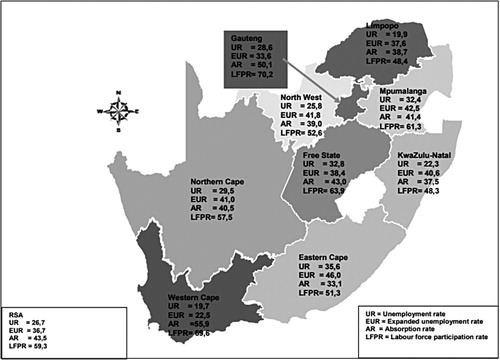
Based on these arguments, Stats SA has carefully reintroduced some of this information by listing the expanded definition in the QLFS annexes detailing unemployment by province in 2010. In addition, three years later, it is inserted it in the last section of the principal results, through a map summarising the QLFS (see the example in ). Since then, the expanded rate has operated as a kind of shadow statistic. The figures are available to those who really want to know and look for them; for the rest, the narrow definition of unemployment remains the official one to be used in political discourse and the media.
Figure 3. Summary of labour market measures at a glance, Q1: 2018. Source: Stats SA (Citation2018).
Conclusion
Unemployment has no obvious demarcations, and indicators to capture it are therefore fundamentally ambiguous and potentially vulnerable to contestation. This ambiguity becomes particularly clear in countries such as South Africa, in which broad and narrow definitions produce such widely disparate numbers.
This ambiguity has been hard to sustain, certainly for a fledging statistical office such as the South African one. During the past decades, unemployment measures in the country have undergone a dual movement. After the end of Apartheid, the Central Statistical Service initially embraced a broad unemployment definition to capture the socio-economic realities particularly of Black communities. Yet over the course of the 1990s and the 2000s, international standards increasingly dominated South African statistics, narrowing the unemployment indicator evermore.
Definitional quandaries do not only affect South African statistics. Labour markets in rich countries also change rapidly. Automation affects which kind of labour is in demand and which one is no longer. Entrepreneurial forms of self-employment are on the rise, as are part-time work and combinations of several jobs to make ends meet. Female labour force participation rates have risen substantially over the past decades, as well. The male factory worker as unemployment statistics lodestar is less and less useful – all around the world.
South Africa had tried to move beyond established unemployment standards in the early years of democratisation, and current Stats SA publications offer useful, nuanced detail about the countries labour markets. Nevertheless, the narrow unemployment rate is now unambiguously the official series. Whenever a single number for South African labour market conditions is being sought – whether by international investors, for global comparisons or by academics using large-n data sets in their research – they will use one that has been fought over for decades, and which remains contested as a reflection of South African labour markets. ‘As far as I know, the debate about broad versus narrow is no longer particularly important,’ Neva Makgetla told us. Thus, as Desrosières (Citation1998) put it, the statistical measure of unemployment in South Africa has now become an established convention – ‘information’ – insofar as it has become reliable, even if it offers a skewed representation of reality.
What has driven this dynamic? It is worth noting first what we did not find. As pointed out above, alternative unemployment definitions and measures clearly have a racial dimension. An expanded rate emphasises the poor labour market conditions of Black South Africans much more clearly than a narrow definition does. Critics could have levelled the charge of (potentially inadvertent) racism at narrow unemployment measures.
In our interviews and document research, however, we found that actual debate in South Africa has accorded surprisingly little attention to this issue. Presumably this relative silence is explained by the ANC’s grip on political power since the end of Apartheid. With its roots in the Black South African community, the party might have an incentive to highlight racial biases in political institutions such as official statistics. However, it also has a political track record to defend, and for that, the expanded rate is counterproductive. The charge of racial bias might have been much more prominent if other political actors would have wielded power in South Africa.
Instead, our analysis highlights the counterintuitive role of international statistical harmonisation. The high speed of statistical (and concurrent democratic) construction in the country since the end of apartheid has engendered a direct need to legitimize the new ways of measuring South Africa’s social and economic conditions. In line with our expectations, this legitimacy was first sought internationally. Compliance with international standards increasingly functioned as a seal of approval and quality, insulating figures against claims of political bias.
This finding is not as obvious as it may seem. We have argued above that unemployment indicators are fundamentally ambiguous; there never is one obviously correct measurement, and the merits of alternative standards vary across countries. That may seem to make international standards both harder to achieve and less attractive, because no single size fits all. Instead, we find ambiguity to have the opposite effect: it incentivizes national statistical agencies to sign up to international standards as buffers against domestic criticism, which itself feeds on the indicator ambiguity. International harmonisation may thus be alluring not in spite, but because of the indeterminacy of statistical measures and their inevitable political weight.
Acknowledgements
This research is part of the FICKLEFORMS project at the University of Amsterdam. We are grateful to the team members for their support and helpful comments.
Disclosure statement
No potential conflict of interest was reported by the authors.
Notes on contributors
After a PhD in France, Juliette Alenda-Demoutiez is now a Post-doctoral Fellow at the University of Amsterdam, working on the history of macroeconomics indicators in South Africa. Her research interests are, besides in political economy of statistics, in development and social protection, still in Sub-Saharan Africa.
Daniel Mügge is Professor of Political Arithmetic at the University of Amsterdam. Together with a team of researchers, he studies the political roots of macroeconomic indicators and their political baggage.
Additional information
Funding
Notes
1 The label ‘developing countries’ carries regrettable connotations, for example differences in countries’ advancement along a single ‘development’ path or a materialist conception of national progress. We don’t endorse those connotations. Lacking better alternatives, we simply use it, reluctantly, to designate relatively poor, non-Western countries.
2 Early in 2018, there were approximately 5.9 million officially unemployed in South Africa (actively searching for a job) as well as 2.7 million discouraged work-seekers out of a population of somewhat below 60 million (Stats SA, Citation2018).
3 10 years after the establishment of the Representation of Native Act in 1936, the ethnic homelands (or Bantustans) were created to assign black Africans.
4 At the time, the four largest of those conglomerates controlled 83 per cent of the companies listed on the Johannesburg Stock Exchange before apartheid ended. Their close links to the state made for a highly coordinated ‘national’ approach to economic policy.
5 Two central characters in the evolution of South African statistics have been Mark Orkin, then the Head of CSS and later the first Statistician-General of Statistics SA, and Trevor Manuel, the first post-1994 Minister of Finance.
6 One of the designers of the OHS, which initially underpinned unemployment figures, and Statistician General for a short period after Mark Orkin and before Pali Lehohla at Stats SA.
7 Linguistic difference can complicate things further. In some official languages, ‘interviewers would have translated ‘unemployed’ as ‘looking for work, [..] others [..] simply as not working’ (Stats SA, Citation1998, 64).
8 All the reports (OHS, LFS, QFLS) have three parts: the highlighted results, which are a table summarising the principle results of the study; some principal results, regarding employment, unemployment, and other specific information; the annexes, were all the rest of the information is delivered in tables.
9 Henceforth, the unemployed were those people, within the economically active population, who did not work during the seven days prior to the interview, want to work and are available to start work within a week of the interview, and have taken active steps to look for work or to start some form of self-employment in the four weeks prior to the interview.
10 Senior Economist at the Trade & Industrial Policy Strategies institute. She has been head of the COSATU Policy Unit, and has been involved at the Development Bank of Southern Africa and at the Economic Development Department.
References
- Adelzadeh, A., 1996. From the RDP to GEAR: the gradual embracing of neo-liberalism in economic policy. Transformation, 31, 66–95.
- Bangane, T., 1999. The unemployment problem in South Africa with specific reference to the LVTMA. Johannesburg: Magister Dissertation.
- Barchiesi, F., 2011. Precarious liberation: workers, the state, and contestes social citizenship in post-apartheid South Africa. Albany, NY: SUNY Press.
- Baxandall, P., 2004. Constructing unemployment: the politics of joblessness in east and west. Hoboken, NJ: John Wiley & Sons.
- Broome, A., Homolar, A., and Kranke, M., 2018. Bad science: international organizations and the indirect power of global benchmarking. European journal of international relations, 24 (3), 514–539. doi: 10.1177/1354066117719320
- Broome, A. and Quirk, J., 2015. Governing the world at a distance: The practice of global benchmarking. Review of international studies, 41 (5), 819–841. doi: 10.1017/S0260210515000340
- Carmody, P., 2002. Between globalisation and (post) apartheid: The political economy of restructuring in South Africa. Journal of Southern African studies, 28, 255–275. doi: 10.1080/03057070220140694
- Chandra, V., Nganou, J., and Noel, C., 2002. South Africa - constraints to growth in Johannesburg's black informal sector - evidence from the 1999 informal sector survey. Washington, DC: World Bank.
- Clegg, L., 2010. Our dream is a world full of poverty indicators: the US, the world bank, and the power of numbers. New political economy, 15 (4), 473–492. doi: 10.1080/13563461003763170
- Cling, J.-P., 1999. La politique économique sud-africaine face à la mondialisation. Politique africaine, 73 (73), 146–158. doi: 10.3917/polaf.073.0146
- Cooley, A. and Snyder, J. eds., 2015. Ranking the world. Grading states as a tool of global governance. New York: Cambridge University Press.
- Cousins, B., et al., 2018. Social reproduction of ‘classes of labour’ in the rural areas of South Africa: contradictions and contestations. The Journal of Peasant studies, 45 (5–6), 1060–1085. doi: 10.1080/03066150.2018.1482876
- CSS, 1996. Living in South Africa, selected findings of the 1995 October household survey. Pretoria: CSS.
- Davis, K., et al., 2012. Governance by indicators: global power through quantification and rankings. New York: Oxford University Press.
- Desrosières, A., 1998. The politics of large numbers: A history of statistical reasoning. Cambridge, MA: Harvard University Press.
- Du Toit, A. and Neves, D., 2014. The government of poverty and the arts of survival: mobile and recombinant strategies at the margins of the South African economy. Journal of peasant studies, 41 (5), 833–853. doi: 10.1080/03066150.2014.894910
- Ferguson, J., 2015. Give a Man a Fish: reflections on the new politics of distribution. Durham, NC: Duke University Press Books.
- Finance Standing Committee, 2002. minutes can be found on the archives of the website of the Parliamentary Monitoring Group. Available from: https://pmg.org.za/committee-meetings/.
- Finance Standing Committee, 2005. Minutes can be found on the archives of the website of the Parliamentary Monitoring Group. Available from: https://pmg.org.za/committee-meetings/.
- Finance Standing Committee, 2008. Minutes can be found on the archives of the website of the Parliamentary Monitoring Group. Available from: https://pmg.org.za/committee-meetings/.
- Finance Standing Committee, 2013. Minutes can be found on the archives of the website of the Parliamentary Monitoring Group. Available from: https://pmg.org.za/committee-meetings/.
- Fioramonti, L., 2013. Gross domestic problem. The politics behind the world’s most powerful number. London: Zed Books.
- Garraty, J.A., 1979. Unemployment in history. Toronto: Fitzhenry and Whitheside Limited.
- Gautié, J., 2002. De l’invention du chômage à sa deconstruction. Genèses, 46 (46), 60–76. doi: 10.3917/gen.046.0060
- Gerson, J., 1981. The question of structural unemployment in South Africa. South African journal of economics, 49 (1), 7–15. doi: 10.1111/j.1813-6982.1981.tb00685.x
- Green, A., 2000. Problems of measuring participation in the labour market. In: D. Dorling, and S. Simpson, ed. Statistics in society: the Arithmetic of politics. London: Arnold, 312–323.
- Green, P., 2008. Choice, not fate. The life and times of trevor manuel. Johannesburg: Penguin books.
- Hamilton, L., 2014. Are South Africans Free? London: Bloomsbury Academic.
- Harding, A., 2014. South African unemployment: Lies and statistics. BBC, 14 November. Available from: http://www.bbc.com/news/world-africa-20324189.
- Hoskyns, C. and Rai, S., 2007. Recasting the global political economy: couting women’s unpaid work. New political economy, 12 (3), 297–317. doi: 10.1080/13563460701485268
- Hussmanns, R., Mehran, F., and Verma, V., 1990. Surveys of economically active population, employment, unemployment and underemployment: An ILO manual on concepts and methods. Geneva: ILO.
- IOL, 2005. Manuel is too glib about unemployment. Available from: https://www.iol.co.za/business-report/opinion/manuel-is-too-glib-about-unemployment-749442.
- Isaacs, G., 2016. A national minimum wage for South Africa. Johannesburg: NMW-RI.
- Jany-Catrice, F., 2012. La performance totale: nouvel esprit du capitalisme? Villeneuve d’Ascq: Presses universitaires du Septentrion.
- Jerven, M., 2013. Poor numbers: how we are misled by African development statistics and what to do about it. Ithaca: Cornell University Press.
- Kantor, B., 1980. Blacks: Is there unemployment? Businessmen’s law, 9 (104-7), 143–144.
- Kelley, J.G., 2017. Scorecard diplomacy. Grading states to Influence their reputation and behavior. Cambridge: Cambridge University Press.
- Khan, A., Wales, J., and Stuart, E., 2015. Country priorities for data development: what does history tell us? London: ODI.
- Kingdon, G. and Knight, J., 2001. What have we learnt about unemployment from microdatasets in South Africa? Social Dynamics, 27 (1), 79–95. 10.1080/02533950108458705.
- Koelble, T.A., 2004. Economic policy in the post-colony: South Africa between Keynesian remedies and neoliberal pain. New political economy, 9 (1), 57–78. doi: 10.1080/1356346042000190385
- Lehohla, P., 2002. The National Statistics System: Our Challenge. Presentation at Paris21.
- Lepenies, P., 2013. Die Macht der einen Zahl: eine politische Geschichte des Bruttoinlandsprodukts. Frankfurt: Suhrkamp Verlag.
- Linsi, L. and Mügge, D., 2019. Globalization and the growing defects of international economic statistics. Review of international political economy, DOI:10.1080/09692290.2018.1560353.
- Lloyd, N. and Leibbrandt, M. 2013. How do the non-searching unemployed feel about their situation? On the definition of unemployment. Econ3(3, 25 June. Available from: http://www.econ3(3.org/article/how-do-non-searching-unemployed-feel-about-their-situation-definition-unemployment.
- Masood, E., 2016. The great Invention. The story of GDP and the making and unmaking of the modern world. New York: Pegasus Books.
- Mbeki, T., 2005. Letter from the president. ANC today, 5 (20), 20–26. May.
- Merten, M., 2016. SA Unemployment and the community survey: it’s complicated. Daily Maverick, 24 March. Available from: https://www.dailymaverick.co.za/article/2016-03-24-sa-unemployment-and-the-community-survey-its-complicated/.
- Meth, C., 2009. Why waste money on quarterly labour force Surveys? Waste it on youth development instead!. Transformation critical perspectives on Southern Africa, 71 (1), 76–102. doi: 10.1353/trn.0.0046
- Moon, J. and Richardson, J., 1985. Unemployment in the UK: politics and policies. London: Gower.
- Mügge, D., 2019. International economic statistics: biased Arbiters in global affairs? Fudan journal of humanities and social sciences, https://doi.org/10.1007/s40647-019-00255-5.
- PCAS, 2003. Towards a ten year review, synthesis report on implementation of government programmes. Pretoria: Office of the Presidency.
- Porter, T., 1995. Trust in numbers. The Pursuit of objectivity in Science and public life. Princeton: Princeton University Press.
- Posel, D., Casale, D., and Vermaak, C., 2014. Job search and the measurement of unemployment in South Africa. South African journal of economics, 82, 66–80. doi: 10.1111/saje.12035
- Rogan, M. and Reynolds, J., 2015. The working poor in South Africa, 1997–2012. Grahamstown: Institute of Social and Economic Research, Rhodes University.
- Rogerson, C.M., 1992. The absorptive capacity of the informal sector in the South African City. In: D. M. Smith, ed. The apartheid city and beyond. London: Routledge, 161–172.
- Salais, R., Baverez, N., and Reynaud, B., 1986. L’invention du chômage. Paris: Puf.
- Scully, B., 2016. From the shop floor to the kitchen table: the shifting centre of precarious workers’ politics in South Africa. Review of African political economy, 43 (148), 295–311. doi: 10.1080/03056244.2015.1085378
- Sengenberger, W., 2011. Beyond the measurement of unemployment and underemployment. Geneva: ILO.
- Simkins, C., 1982. Structural unemployment revisited. SALDRU Fact Sheet No. 1, University of Cape Town.
- Standing, G., Sender, J., and Weeks, J., 1996. Restructuring the labour market, The South African challenge. Geneva: ILO.
- Stapleford, T., 2009. The cost of living in America: A political history of economic statistics, 1880–2000. Cambridge: Cambridge University Press.
- Stats SA, 1998. Unemployment and employment in South Africa. Pretoria.
- Stats SA, 1999. Annual report. Pretoria.
- Stats SA, 2009. Annual report. Pretoria.
- Stats SA, 2018. Quarterly labour force Survey, 1st quarter. Pretoria.
- Taylor, M., 2016. The Political Economy of Statistical Capacity: A Theoretical Approach (Discussion Paper IDB-DP-471). Washington, DC: Inter-American Development Bank.
- Terreblanche, S., 2002. A history of inequality in South Africa, 1652–2002. Scottsville: University of Natal Press, KMM Review.
- Topalov, C., 1994. Naissance du chômeur, 1880–1910. Paris: Albin Michel.
- Van der Berg, S., 2013. Adcorp’s employment and unemployment figures are not taken seriously by researchers – yet they can do much harm. Econ3(3, 12 February. Available from: http://www.econ3(3.org/article/adcorp%E2%80%99s-employment-and-unemployment-figures-are-not-taken-seriously-researchers-%E2%80%93-yet-they.
- Ward, M., 2004. Quantifying the world: UN ideas and statistics. New York: Indiana University Press.
- Wittenberg, M. and Kerr, A. 2012. Criticisms of the adcorp employment index. DataFirst, University of Cape Town, February. Available from: http://nationalminimumwage.co.za/wp-content/uploads/2015/08/0033-Criticisms-of-the-Adcorp-index.pdf.
- Yu, D., 2009. The comparability of labour force survey and quarterly labour force survey. Department of economics, Bureau for economic research, University of Stellenbosch.
- Zimmermann, B., 2006. Arbeitslosigkeit in Deutschland. Zur Enstehung Einer Sozialen Kategorie. Frankfurt am Main: Campus Verlag.