
ABSTRACT
It is widely believed that China's socialist economy had relatively high rates of extreme poverty while the capitalist reforms of the 1980s and 1990s delivered rapid progress. This narrative relies on World Bank estimates of the share of people living on less than $1.90 a day (2011 PPP), which show a sharp decline from 88 per cent in 1981 to zero by 2018. However, the World Bank’s poverty line has been critiqued for ignoring variations in the actual cost of meeting basic needs. In this paper we review data published by the OECD on the share of people unable to afford a subsistence basket. These estimates indicate that from 1981 to 1990, when most of China’s socialist provisioning systems were still in place, the country’s extreme poverty rate was on average only 5.6 per cent, substantially lower than in capitalist economies of comparable size and income at the time: 51 per cent in India, 36.5 per cent in Indonesia, and 29.5 per cent in Brazil. China's comparatively strong performance is corroborated by data on other social indicators. Moreover, extreme poverty in China increased during the capitalist reforms of the 1990s, reaching a peak of 68 per cent, as privatisation inflated the prices of essential goods and thus deflated the incomes of the working classes. These results indicate that socialist provisioning policies can be effective at preventing extreme poverty, while market reforms may threaten people's ability to meet basic needs.
Introduction
The standard narrative about poverty in China holds that the government’s post-1978 capitalist reforms delivered a dramatic reduction in extreme poverty. As the former World Bank economist Martin Ravallion (Citation2021, p. 15) puts it: ‘China has made enormous progress against poverty since Deng Xiaoping unleashed the country’s pro-market reform.’ ‘A large share of China’s success following Deng’s reforms reflected the prior failure of the Maoist economic-policy model’ (ibid., p. 3). This argument has been widely promoted by influential figures such as Steven Pinker (Citation2018) and Steven Radelet (Citation2015), in addition to right-wing think tanks like the Cato Institute (Tupy Citation2015).
This narrative depends, in large part, on World Bank estimates of the share of the population living in extreme poverty (defined as less than $1.90 per day, 2011 PPP). This data shows that China’s poverty rate declined precipitously, from 88 per cent in 1981 at the end of the socialist period, down to virtually zero today, with the fastest gains achieved during the capitalist reforms of the 1980s and 1990s. However, a growing body of literature suggests that the World Bank’s PPP-based method suffers from a significant empirical limitation, in that it does not account for the cost of meeting basic needs in any given context (Reddy and Pogge Citation2010, Moatsos Citation2016, Citation2021, Allen Citation2017, Citation2020, Sullivan and Hickel Citation2022). This problem becomes particularly acute when comparing socialist and capitalist economies, and when assessing transitions from socialist to capitalist systems. Socialist policies of public provisioning and price controls may keep the cost of meeting basic needs quite low compared to capitalist contexts characterised by high levels of commodification and privatisation. This means that any given level of broad-gauge PPP income would have a greater welfare purchasing power – in terms of basic needs – under socialism than under capitalism; people would have better access to the key goods, such as food and housing, that are necessary for escaping extreme poverty. This is relevant to the question of China, given that China’s capitalist reforms systematically dismantled key public provisioning systems and price controls (Li Citation2016).
In recent years, scholars have developed an alternative approach to measuring extreme poverty, which compares incomes against the cost of basic needs in different contexts (Moatsos Citation2016, Allen Citation2017, Citation2020). In 2021, the OECD published estimates of the share of the population below this ‘basic needs poverty line’ (BNPL), for all countries with available household survey based data from 1981 to 2008 (coverage varies by country; also see footnote 2) (Moatsos Citation2021). This dataset marks a significant improvement over the World Bank’s extreme poverty figures. Yet, to our knowledge, no study has yet used this data to assess the effects of China’s capitalist reforms.
Drawing on the BNPL data, we show that between 1981 and 1990, China’s poverty rate was considerably lower than in capitalist economies of similar size and income. On average, during this period only 5.6 per cent of the Chinese population lived in extreme poverty, compared to 51 per cent in India, 36.5 per cent in Indonesia, and 29.5 per cent in Brazil. Furthermore, we find that during the capitalist reforms of the 1990s, China’s poverty rate increased dramatically, reaching a peak of 68 per cent in 1995. While China’s poverty rate gradually recovered during the 2000s, rough estimates for 2018 indicate that it remains at roughly the same level as during the 1980s.
We assess the validity of the BNPL results by comparing China’s performance on poverty to its performance on 18 empirical indicators of human capabilities, including life expectancy, the death rate from malnutrition, and access to electricity, in the years 1981 and 1990. We show that socialist China’s impressive performance on BNPL-poverty was mirrored by its performance on these other key social indicators. By contrast, the World Bank’s estimates of poverty in China do not align with empirical indicators of human welfare.
By focusing on China as a case study, this paper contributes to critiques of the World Bank’s PPP-based approach to poverty measurement, and demonstrates the usefulness of the BNPL in the study of global poverty from a comparative perspective. Our findings also have important implications for global development policy. The data we present here indicate that the dismantling of China’s public provisioning systems caused the prices of essential goods to rise, thus forcing much of the population to curtail their consumption. This pattern confirms Patnaik and Patnaik’s (Citation2017) argument that market reforms tend to reduce the purchasing power of the poor vis-à-vis foodstuffs – a process they refer to as ‘income deflation.’ Public provisioning and social guarantees may be more effective at combating food insecurity and extreme poverty, and should be considered in development policy.
The World Bank’s poverty line and the question of public provisioning
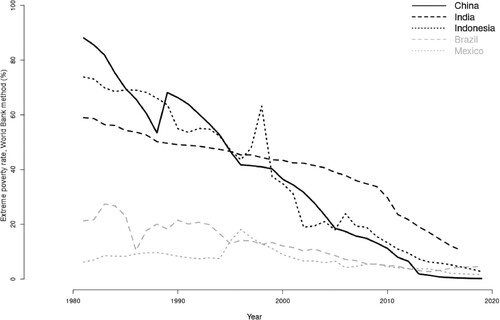
Here we review the World Bank’s PPP-based approach to measuring poverty and the problems associated with it. shows the World Bank’s figures for China and select countries. The data indicates that at the end of the socialist period in the early 1980s, extreme poverty was more severe in China than in the other populous low-income Asian states (India and Indonesia), and much higher than in the middle-income countries of Latin America (Mexico and Brazil). Poverty then appears to decline precipitously during the capitalist reforms, which reached their crescendo during the privatisation drive of the 1990s. According to this data, it would seem that China’s socialist economy had relatively high extreme poverty rates, while capitalist reforms delivered unprecedented progress.
Figure 1. Share of population living below the World Bank’s Poverty Line ($1.90-a-day, 2011 PPP), 1981–2018. Source: World Bank, Povcalnet.
The World Bank’s poverty line (WBPL) suffers from a significant empirical limitation, however, which scholars have recognised now for more than a decade (Reddy and Pogge Citation2010). The purchasing power parity (PPP) exchange rates that undergird the WBPL are calculated on the basis of prices across the entire economy – including commercial airfares, sports cars, and meals at high-end restaurants – rather than the prices of goods that people need in order to meet basic needs, such as food and shelter (Moatsos Citation2016, Citation2021, Allen Citation2017, Citation2020). When it comes to measuring poverty, what matters is not income as such but rather what that income can buy in terms of access to essential goods; in other words, what matters is the welfare purchasing power of income. Allen (Citation2017) analyses commodity prices around the world in 2011 and finds that the cost of meeting basic needs, measured in PPP terms, changes depending upon the price of food and shelter relative to prices across the rest of the economy. In Zimbabwe a person’s subsistence needs can be met with $1.74, PPP (ibid., p. 3713). But purchasing a similar basket would cost $3.19 in Egypt, and $4.02 in France (ibid., p. 3713). Because the WBPL does not account for the variable cost of meeting basic needs in different countries, it cannot be used to establish meaningful estimates of poverty.
The problems with the WBPL become particularly acute when comparing socialist states like pre-reform China to capitalist states such as India or Brazil. Socialist states tend to invest in public provisioning systems to provide people with access to essential goods (Cereseto and Waitzkin Citation1986, Navarro Citation1993, Li Citation2016). In such cases, the cost of meeting basic needs is generally quite low. In capitalist states, with high levels of commodification or privatisation, the same goods may be significantly more expensive. Therefore, a dollar of income (in broad-gauge PPPs) is likely to have a stronger welfare purchasing power in socialist states than in capitalist states.
It is necessary to keep this dynamic in mind when it comes to assessing poverty trends in China. During the socialist period, China sought actively to eradicate poverty through public provisioning and price controls. As Jean Drèze and Amartya Sen summarise:
As far as support-led security is concerned, the Chinese efforts have been quite spectacular. The network of health services introduced in post-revolutionary China in a radical departure from the past – involving cooperative medical systems, commune clinics, barefoot doctors, and widespread public health measures – has been remarkably extensive … Similar [considerations] hold in the distribution of food through public channels and rationing systems, which have had an extensive coverage in China (except in periods of economic and political chaos, as during the famine of 1958–61) … Food distribution is, in fact, part of a far-reaching programme of social security that distinguishes China from India. The impact of these programmes on protecting and promoting entitlements to food and basic necessities, including medical care, is reflected in the relatively low mortality and morbidity rates in China (Drèze and Sen Citation1989, p. 209).
The use of the WBPL is further problematic because China’s public provisioning and price control systems were dismantled during the capitalist reform period (Liu Citation2015, Li Citation2016). In the early 1980s, the reform leadership privatised the health care system. This led to a marked reduction in the number of medical workers available in rural areas, and was associated with a deterioration in life expectancy and child mortality (Drèze and Sen Citation1989, pp. 215–221). These neoliberal policies were then extended to the rest of the economy in the early 1990s, as the state became committed to privatising the industrial SOEs. Some $5 trillion USD worth of assets were transferred from state and collective institutions to private enterprises (Li Citation2016, p. 34). As a result, by 1995, government revenues – which were essential for maintaining China’s extensive public support networks – dropped to their lowest recorded point as a share of GDP (Liu Citation2015, p. 47). The privatisation of the SOEs meant the government could no longer support the ‘Iron Rice Bowl,’ a system of social security that guaranteed the urban population full employment and generous welfare benefits (Li Citation2016, Citation2008, pp. 51, 60–65, Liu Citation2015, pp. 48–49). In 1992, the government removed price controls on basic necessities, including grain, clothing, detergents, and coal (Chai Citation1997, p. 115).
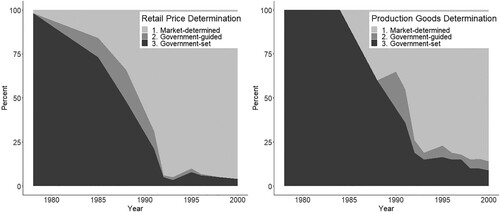
The share of retail prices set or guided by the state declined from close to 100 per cent in 1980, to a nadir of 10 per cent around 1993, with the steepest decline occurring after 1990 (see ). The state’s role in setting producer goods prices – which was important both for ensuring cheap inputs into the basic needs sector, and for raising revenues on non-essential industrial outputs (Weber Citation2021, p. 102) – was maintained throughout the first half of the 1980s (). Prices were then rapidly liberalised after 1985, with a steep decline from 1990 to 1993. In light of this, we should expect $1.90 (2011 PPP) to have deteriorating purchasing power over essential goods as China’s capitalist reforms progressed. Moreover, these institutional changes imply a dramatic change in the price structure of China’s economy during the second half of 1980s and early 1990s, which violates a key PPP assumption (Deaton and Dupriez Citation2009).
Figure 2. Price determination of retail products and producer goods in China, 1978–2004. Source: Weber (Citation2021), pp. 8–9.
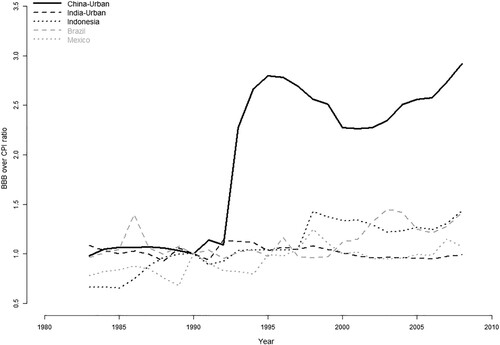
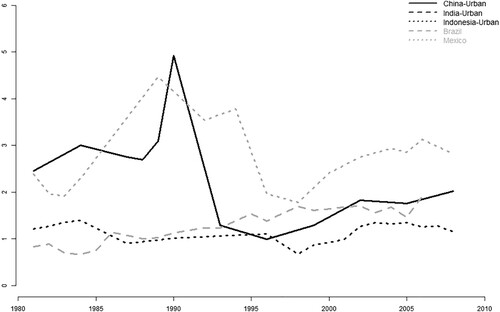
Indeed, this is confirmed by , which shows the ratio of the ‘bare bones basket’ price index, which is based on the price of essential goodsFootnote1, over the general consumption price index. For China and India these prices are available for urban areas only. We see that during China’s capitalist reform period the cost of basic necessities grew much more rapidly than the general price level. The sudden jump in the costs of basic necessities in China coincides with the minimisation of the government-set or -guided prices in the Chinese economy, as shown in . This suggests that broad-gauge PPP exchange rates, calculated with economy-wide prices, are ill-suited to measure purchasing power over essential goods during China’s reforms. The WBPL therefore cannot be used to infer that poverty was declining during the reform period.
Figure 3. Evolution of the BBB price index over CPI ratio for selected countries, 1983–2008; both series use 1990 as the base year. Source: adapted from Moatsos (Citation2016).
Poverty using a ‘cost of basic needs’ basket
An alternative method for estimating extreme poverty has been proposed by the economic historian Robert C. Allen (Citation2017, Citation2020). Allen calculates what he calls a ‘basic needs poverty line’ (BNPL) in all countries with available data in the year 2011. This poverty line is based on the local price of purchasing 2,100 calories per day, plus 50 g of protein, 34 g of fat, various vitamins and minerals, some clothing and heating, and 3 square metres of housing. Allen then applies these poverty lines to the World Bank’s income data, to estimate the share of the population that is unable to meet their basic needs. In a recent paper published by the OECD, Moatsos (Citation2021) extended Allen’s estimates, with robust data for the years between 1981 and 2008, although precise coverage varies by country.Footnote2 To do this, Moatsos used data from the ILO October Inquiry (which collected food prices from 1924 to 2008) to estimate the cost of meeting basic calorie, protein, and fat requirements. Data for certain items are not available in all years, however, so Moatsos interpolates to missing years under the assumption that the prices of these goods moved in line with the CPI. Because the prices of vitamins and non-food items are not available from the October Inquiries, Moatsos assumes that the share of these prices in the full basket was the same as in Allen’s (Citation2017) calculations.Footnote3 Given these assumptions, the OECD figures need to be treated with caution. Nonetheless, inasmuch as this data directly accounts for the variable cost of food, it better captures changes in the welfare of those in extreme poverty than the World Bank’s figures and, as we will see below, it is corroborated by empirical evidence on several key social indicators.
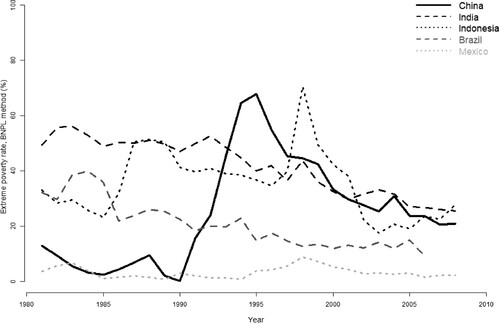
shows the extreme poverty rate, as estimated by Moatsos (Citation2021), for the same five countries included in . The data markedly contradicts the standard narrative that post-revolutionary China had a higher poverty rate than other populous low-income countries. In fact, during the 1980s, China’s basic needs poverty rate was considerably lower than India’s, Indonesia’s, and Brazil’s. China’s performance was rivalled only by Mexico, a much wealthier country. In the year 1990, China’s poverty rate appears to have been around 0.2 per cent. For perspective, the extreme poverty rate in the United States at that time was 0.5 per cent. Of course, given the limitations of the OECD dataset, we cannot assume precision at the fractional level. The evidence is best interpreted as indicating that China’s poverty rate was very low, although precisely how low is difficult to say. It is also worth noting that the BNPL does not account for the price of health care (in this sense it is similar to the WBPL, which in most contexts is far too low to access modern health facilities). It is possible that if health care was accounted for, we would find that poverty rose during the 1980s, when China’s public health system was dismantled. What is clear however is that, prior to the mass privatisation of SOEs in the early 1990s, China’s poverty rate appears to have been substantially lower than the WBPL suggests.
Figure 4. Share of the population unable to purchase a subsistence basket, 1981–2008. Source: Moatsos (Citation2021).
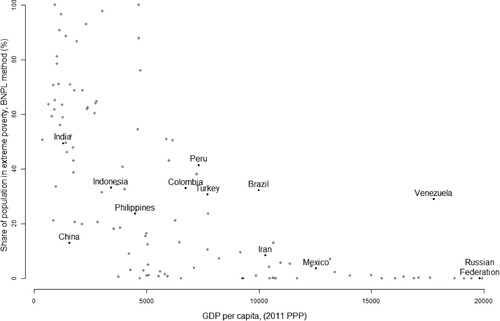
shows the rate of extreme poverty in 1981 compared to GDP per capita (2011 PPP) in that year. We see that China’s performance was exceptional compared to countries at a similar level of economic development. China had the lowest poverty rate of all countries with a GDP per capita of less than $3,500, while it only had slightly more than $1,500 itself. In fact, China’s performance was even better than many countries with much higher incomes. China achieved a considerably lower extreme poverty rate than Turkey and Peru, with less than a third of the income. With only a tenth of Venezuela’s income, revolutionary China enjoyed half the rate of poverty. Contrary to the claims made by Ravallion (Citation2021) and Pinker (Citation2018), China’s socialist provisioning systems appear to have worked exceptionally well at avoiding extreme deprivation even at very low levels of economic development. This is because China’s extensive system of public provisioning and price controls kept the price of food low relative to other goods. In 1983, the BNPL was only $0.53 (2011 PPP) in China, compared to a global average of $2.4 (2011 PPP, excluding China).
Figure 5. Share of the population unable to purchase a subsistence basket vs GDP per capita (2011, PPP), 1981. Source: for the poverty rate see, Moatsos (Citation2021); for GDP per capita see, Bolt et al. (Citation2018) and Feenstra et al. (Citation2015).
also indicates that extreme poverty increased in China during the capitalist reforms. The privatisation of China’s socialist provisioning systems caused a major subsistence crisis, with the share of the population unable to meet their basic needs rising dramatically to a peak of 68 per cent in 1995. This rise in extreme poverty was driven by a surge in the relative price of food. China’s BNPL rose from $0.35 in 1990, to $2.7 in 1995. In other words, while the World Bank’s $1.9 threshold overstates the level of extreme poverty during China’s socialist period, it understates the level of extreme poverty during the capitalist reforms.
The extreme poverty rate declined steadily in the late 1990s and 2000s. Food price data is available from the Chinese government’s statistical yearbook until 2014, and suggests the basic-needs poverty rate had declined to 9.9 per cent by that year (Moatsos Citation2021). If we assume food prices moved in line with the CPI thereafter, China’s poverty rate would be 5.4 per cent in 2018 (ibid). While the lack of direct price data means this figure must be treated cautiously, it is clear that China has experienced notable progress in recent decades. This is attributable to several factors. China’s rapid economic expansion has increased employment and depleted reserves of rural surplus labour, which has led to an increase in the bargaining power of the working class (Li Citation2016). In the 2000s, China experienced a series of labour strikes, forcing employers and local governments to improve wages and other benefits (ibid). As Minqi Li puts it, ‘At a time when large parts of the world are suffering under the tyranny of neoliberal austerity, China may be the only large country where the working class is making significant gains’ largely because the ‘rural surplus labor force continues to be depleted’ (ibid., p. 29). But despite China’s strong economic growth and tight labour markets, the country’s performance on extreme poverty is scarcely better than during the socialist era of the 20th century. China’s economy has grown by over 300 per cent since 1990. Yet the country’s 2018 poverty rate (5.4 per cent) is virtually identical to its average poverty rate during 1981–90 (5.6 per cent).
Another way of measuring progress against poverty over time is to look at the ‘welfare ratios’ of the bottom 50 per cent of the population – that is, the ratio of the average income of the bottom 50 per cent of the population to the price of a subsistence basket, shown in (‘welfare ratios’ were first developed by Allen Citation2001). We see that in the 1980s, the poor in India, Indonesia, and Brazil had average incomes that were only just capable of achieving bare subsistence. By contrast, the population of China had incomes high enough to purchase up to five subsistence baskets, a figure that was on par with Mexico. Since food was rationed in China, it is unlikely that the Chinese population could actually purchase so many subsistence baskets, but it is clear that the poor had incomes substantially above subsistence, which would have provided security against economic shocks. For the poorest 50 per cent in India, Indonesia, and Brazil, by contrast, even a slight loss of income would have meant falling into extreme poverty (indeed, the bottom 50 per cent of these countries did fall into extreme poverty in several years over this period). This pattern changed, however, in the 1990s, when the welfare ratios of the poor in China and Mexico plummeted to subsistence levels. As of the most recent year of data, neither country has seen their real incomes return to their earlier peak (this finding still holds as of 2018, if we assume basic-needs prices have moved in line with the CPI).
Figure 6. Average income of the bottom 50 per cent of the population, measured in subsistence baskets, 1981–2008. Source: authors’ calculations with data from Moatsos (Citation2021).
Are the numbers valid?
The evidence reviewed above suggests that the standard narrative about the impact of China’s capitalist reforms on extreme poverty is incorrect. Prior to the privatisation drive of the 1990s, China had exceptionally low levels of extreme deprivation, rivalling much wealthier countries like Turkey, Peru, Venezuela, and Mexico. The capitalist reforms appear to have put an end to this, with China’s poverty rate increasing dramatically in the first half of the 1990s.
It is important to interrogate whether the BNBL figures are valid. In an earlier publication, Moatsos (Citation2021) questioned the results for China on the grounds that it is not clear whether goods were actually available at government-fixed prices in the required quantities. Shortages and suppressed inflation may have prevented people from accessing key goods, even if they could afford them in monetary terms (ibid., p. 193, 206, 209). Moreover, direct prices for non-food items are not available in the ILO dataset, and have been estimated as a percentage mark-up on the cost of food. This is a substantial limitation for all countries, but Moatsos noted that it may be particularly problematic for countries with low food prices: ‘If the food component is very low [as with China] then the multiplier may underestimate the additional costs’ (ibid., p. 215). Moatsos pointed out that if China’s implied non-food prices from 1995 (calculated as a percentage mark-up on the high food prices of that year) are applied to all years from 1990 to 1994 and then extrapolated into the 1980s with the CPI,Footnote4 China’s pre-reform poverty rate would have been around 100 per cent. Moatsos did not explore these issues in detail. Instead, by taking the average of the BNPL and this ‘high price’ poverty line, Moatsos speculated that China’s poverty rate may have been around 60 per cent during the 1980s. China is the only country for which Moatsos used this method – for all other countries he took the original price data at face value. Moatsos noted that his use of a different method for China ‘is far from resolving the problem,’ and he called for more research into the evolution of non-food prices and the validity of the BNPL estimates (ibid., p. 207–209).
The issues raised by Moatsos are addressed in the literature on China’s price controls and reform. Several prominent scholars, including Minqi Li (Citation2016, pp. 15–41) and Drèze and Sen (Citation1989), have argued that China’s public provisioning systems were effective at meeting basic needs, suggesting shortages were not a major problem. Furthermore, it seems that the prices of essential non-food items followed a similar trend to foodstuffs. In the early 1990s, China deregulated not only the price of food, but also a range of basic necessities that had been distributed through public channels during the socialist period, including cloth, cotton piece goods, detergents, and coal (Chai Citation1997, pp. 94–116). The government first raised the state-set prices of these goods towards the market rate, and then in 1992 abolished price controls altogether, triggering rapid inflation (ibid., pp. 114–115). The impact of these policy changes was so dramatic that in November of 1990 the Western press reported on ‘hoarding and price speculation among residents in Beijing’ after the Chinese government had ‘begun raising the state-set consumer prices of many daily necessities … home heating coal, liquid propane and cotton goods’ (L.A. Times Archives Citation1990).Footnote5 A similar story applies to the price of housing, which figures prominently in the BNPL. Pre-reform China’s housing stock was publicly owned, and distributed to the population at subsidised rates. According to the Asian Development Bank: ‘Until 1990, under [China’s] socialistic housing policy most urban families spent only 1–3 per cent of their total income on rent, with the average rent being only 6.5 per cent of the full-cost rent’ (Gao Citation2010, p. 2).Footnote6 This pattern changed between 1988 and 1992, when the government increased rents to full-cost and privatised the public housing stock (ibid). In other words, non-food essentials followed much the same trend as foodstuffs. Therefore, it is not valid to assume that 1995 prices applied to earlier years.
Here we assess the validity of China’s BNPL and WBPL poverty data against other social indicators, for the years 1981 and 1990, during the period when these two poverty lines show markedly different results. We choose these two years as benchmarks because household survey distributions for China are available at PovcalNet for both 1981 and 1990, and because several relevant indicators only become available from 1990 onward.
If by poverty we mean the inability to achieve certain minimum capabilities (to access basic amenities, live a long healthy life, etc.), then we should expect our measure of poverty to reflect empirical indicators of the share of the population achieving human capabilities. The WBPL suggests that in 1981 China had worse poverty rates than India, Indonesia, Brazil and Mexico (see, ). By contrast, the BNPL indicates China was rivalled only by Mexico. If China’s anti-poverty policies failed because shortages prevented the Chinese population from accessing food at official prices, or because non-food goods were too expensive, we should expect China to have lower levels of capability achievement than the other countries, as the WBPL suggests. By contrast, if China’s public provisioning systems were capable of delivering, as Li, Drèze and Sen argue, then we should expect China to have stronger capability-indicators than all countries other than Mexico.
Table 1. Indicators of poverty and of the share of the population unable to meet their basic physiological needs, 1981
shows each country’s performance on poverty (as calculated with both the BNPL and WBPL) alongside the infant mortality rate, the child mortality rate, and the crude death rate. These mortality data can be considered broadly representative of the relative share of people who are unable to meet their basic physiological needs for food, shelter, and fuel (Sen Citation1998). demonstrates that China performed better than the other countries on all three indicators. The World Bank’s method suggests that a larger share of people lived in poverty in China than in India, Indonesia, Brazil and Mexico. This is difficult to accept given that a smaller share of the Chinese population had to face an early death.
It is also worth looking at the share of the population achieving other, higher-order capabilities, such as education (). The prices of higher-order goods are not accounted for in the BNPL, just as the WBPL is generally too low to access anything beyond bare subsistence. It is plausible that a country could perform well on extreme poverty even though much of the population is unable to access these higher-order goods. By contrast, we can expect that access to higher-order goods is broadly indicative of relative freedom from extreme poverty; for instance, one can only pursue an education once their basic food needs are met.
Table 2. Indicators of poverty and of the share of the population achieving higher capabilities, 1981
shows data on literacy and primary school enrollment. We see that China's literacy rate was not as high as in the middle-income countries Mexico and Brazil, but China did outperform India and roughly matched Indonesia. This should be interpreted with some caution. The World Bank (Citation2022d) notes that different countries use different methods for measuring illiteracy, making comparisons difficult. Nevertheless, even taking the data at face value, the figures do not support the World Bank’s claim that poverty was worse in China than India during the 1980s. We see that 66 per cent of the Chinese population was literate, compared to only 41 per cent in India. Turning to the number of people enrolled in primary education (as a percent of the relevant age cohort), we see that China had the best performance in 1975 and the second-best performance in 1981. While China’s achievements on education were not as notable as its achievements in meeting basic physiological needs, comparative education data does not support the World Bank’s extreme poverty figures.
shows indicators of the average level of capability-achievement across the population. Since these figures are population-wide averages, it is difficult to make inferences about the capabilities of the poor. If resources were distributed unequally, high average figures may be unrepresentative of the living standards of those at the bottom of the distribution (a point to which we shall return below). Nevertheless, suggests that living standards were higher in China than the other countries. China outperformed the others on mean years of schooling, physicians per capita, and hospital beds per capita. On life expectancy, China tied with Mexico for first place, and on average adult male height (a good proxy for nutritional standards, see Baten and Komlos Citation1998, Koepke and Baten Citation2005), China was only narrowly surpassed by Brazil.
Table 3. Indicators of the average level of capability achievement in the population, 1981
The only indicator on which China did not perform well was per capita calorie availability. Here we have expressed the daily per capita calorie supply as a percentage of 2,100 calories, the threshold used in calculating the BNPL. We see that China’s calorie availability was not only lower than Mexico’s, Brazil’s, and Indonesia’s, it was barely sufficient to ensure the entire population’s needs were met. The extent to which total calorie supply usefully predicts prevalence of extreme poverty depends on the distribution of food, however. Unlike other countries, China’s extensive system of food rationing ensured that calorie output was distributed in such a way as to prioritise meeting human needs. This may explain why China was able to deliver better health outcomes and better nutrition (as indicated by average male height) than Mexico and Indonesia, despite having a lower calorie output. But China’s low calorie supply does help to explain why China’s poverty rate sat at 13 per cent in 1981 despite its public distribution systems. There was barely sufficient food in the country, at that time, to ensure all people had access to 2,100 calories per day, leaving no room for any food wastage or transportation failures (as we shall see, China overcame this problem by 1990).
shows three measures of inequality. We see that China had the lowest income inequality of the five countries, as indicated by a substantially lower Gini index and a greater share of national income going to the poorest 50 per cent. In terms of the distribution of education resources, China was second only to Mexico. In light of this, China’s high level of average capability achievement (presented in ) is unlikely to simply reflect high living standards at the top of the distribution. As Drèze and Sen (Citation1989, p. 209) comment, ‘[i]t is not only that China has more than twice as many doctors and nearly three times as many nurses per unit of population as India has. But also these and other medical resources are distributed more evenly across the country (even between urban and rural areas), with greater popular access to them than India has been able to organize.’
Table 4. Indicators of inequality, 1981.
Turning to the year 1990, shows various indicators of the share of the population unable to meet their basic physiological needs. We see that China’s performance on child mortality, infant mortality and crude mortality was second only to Mexico. It is interesting that China’s performance relative to Mexico deteriorated between 1981 and 1990, a trend which stands in contrast to China’s recorded basic needs poverty rate. This may reflect declining access to health care (the price of which is not included in the BNPL) as China’s rural health system was privatised during the 1980s. According to Drèze and Sen (Citation1989, pp. 215–221, Citation2015), the dismantling of China’s public health system caused a stagnation in progress against mortality, and perhaps even an actual increase in premature deaths in the first half of the decade. These changes may explain why China’s mortality rate deteriorated relative to Mexico, despite apparent improvements in access to food, as measured by the BNPL poverty rate.
Table 5. Indicators of poverty and of the share of the population unable to meet their basic physiological needs, 1990.
For 1990, data is available on the age-standardized death rates from energy-protein malnutrition and lack of access to sanitation facilities. We see that China was the strongest performer on both of these indicators. Data is also available for the share of children under the age of five who are ‘wasted’ (i.e. underweight for their height) which is an indicator of acute malnutrition. On this indicator, China was surpassed only by Brazil.
shows the proportion of the population achieving higher-order capabilities in the year 1990. We see that China had the highest rate of primary school enrolment, and the second highest rate of access to electricity. As for literacy, China’s achievement was not as impressive as on other social indicators. This result is surprising given China’s high mean years of schooling and its relatively equitable distribution of education resources. It should be recalled that different countries use different methods for measuring literacy, and the World Bank (Citation2022d) itself says this ‘data should be used cautiously.’
Table 6. Indicators of the share of the population achieving higher capabilities, 1990.
shows average levels of various capability achievements in 1990. On life expectancy and mean years of schooling, China’s achievements were second only to Mexico. China had the highest rate of physicians per capita of all countries, and was second only to Brazil in the number of hospital beds per capita. As in 1981, the only indicator on which China performed poorly (at least relative to the middle-income Latin American countries) was the per capita calorie supply. It is noteworthy, however, that by 1990 China’s food output had risen well above the basic-needs-threshold of 2,100 calories a day. This helps to explain why China’s price control systems were apparently able to ensure an extremely low poverty rate (of around 0 per cent if price data are taken at face value) in 1990 but not in 1981.
Table 7. Indicators of the average level of capability achievement in the population, 1990.
In sum, the empirical data on social indicators raises significant questions about the validity of the World Bank’s estimates of the poverty rate in China during the 1980s. In 25 out of 29 comparisons, China achieved the 1st or 2nd best score of the countries reviewed here, as we would expect from China’s relative performance on the BNPL. The remaining 4 comparisons were of the literacy rate and per capita calorie availability (on both indicators, China achieved 4th place in 1981 and 3rd place in 1990). However, as we have noted, because the methodologies for literacy may not be comparable across countries, and because the impact of calorie availability is mediated by distribution, these indicators may not adequately reflect China’s achievements in terms of access to basic need-satisfiers. Importantly, there is not a single comparison where China had the lowest level of capability achievement of the five countries, in contrast to what the World Bank’s poverty metric implies.
If the World Bank's poverty data suggests China was more impoverished than India, Indonesia, and Brazil – even though the Chinese population clearly had greater capabilities to live long, healthy lives, access electricity, visit a doctor, get an education, and avoid dying of malnutrition or poor sanitation – we must ask what the World Bank actually means by poverty. By its methodological nature, the World Bank’s PPP-based approach cannot deal with the enormous structural differences between China and other low-income countries, particularly those related to price formation. The BNPL data better reflects the prevalence of capability-deprivation in the Chinese population during the socialist period. Although the near-zero extreme poverty rate value for 1990 should be treated cautiously, the evidence reviewed here indicates that the BNPL can be regarded as a more accurate reflection of the extent to which the Chinese population had access to basic need-satisfiers, compared to the very high poverty estimate provided by the WBPL.
Implications for the millennium development goals
These results have broader implications for the question of global poverty. Millennium Development Goal 1 (MDG1) committed the world’s governments to halving the proportion of the global population living in extreme poverty between 1990 and 2015. If we measure poverty using the cost of basic needs approach, it becomes clear that this objective has not been achieved (this is consistent with Moatsos and Lazopoulos Citation2021). shows the proportion of the global population living below the BNPL. It should be noted that to create a global timeseries for all years to 2015, Moatsos (Citation2021) has extrapolated the food prices for each country using the CPI where direct food price data is unavailable, which is the case for most countries after 2008. As such, the post-2008 data must be treated with caution.
Figure 7. Share of the global population living in extreme poverty (unable to afford a subsistence basket), 1981–2015. Note: dotted line represents half of the 1990 figure, Source: data from Moatsos, (Citation2021) using the original prices for China.
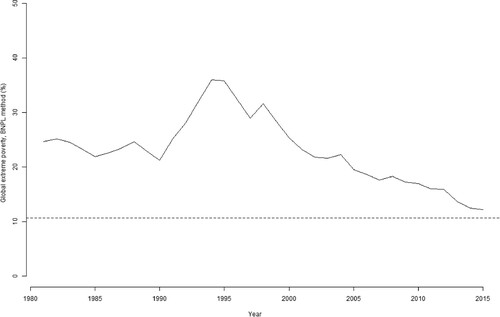
shows that the basic needs poverty rate was 21.2 per cent in 1990. To achieve MDG1 it would need to fall to 10.6 per cent by 2015. This threshold is represented by the dotted line on . According to the cost of basic needs approach, in 2015 the proportion of the global population living in extreme poverty was over 12 per cent, which is more than half of the 1990 estimate. Therefore, the target was missed, albeit narrowly. These results stand in contrast to the World Bank’s claims that the target was achieved much earlier, in 2010, and exceeded by a wide margin in 2015.
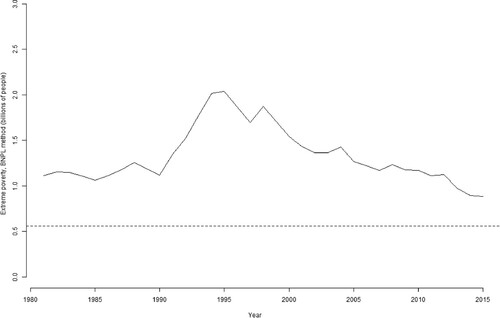
The failure of the international community to achieve MDG1 in terms of costs of basic needs is even more stark if we look at the absolute number of people in extreme poverty. In the final Millennium Development report, the United Nations declared that ‘globally, the number of people living in extreme poverty has declined by more than half.’ Indeed, halving the absolute number of poor people was the original goal outlined in the Rome Declaration of 1996. shows the number of people living below the BNPL. In 1990, the poverty headcount was 1.12 billion, half of which is 0.56 billion, a threshold represented by the dotted line. This target was not achieved by 2015. On the contrary, in 2015 the poverty headcount was 886 million people, only about halfway toward meeting the target set in the Rome Declaration.
Figure 8. Number of people living in extreme poverty (unable to afford a subsistence basket), 1981–2015. Note: dotted line represents half of the 1990 figure, Source: data from Moatsos, (Citation2021) using the original prices for China.
Discussion and conclusions
The standard narrative about extreme poverty in China holds that the socialist period was marked by some of the lowest living standards in the world, and that progress against extreme destitution began with the capitalist reforms. However, this narrative relies on the World Bank’s poverty line of $1.9-a-day, which fails to account for international differences in the relative price of food and other basic need-satisfiers. This is problematic because China’s extensive public provisioning and price control systems ensured that the price of essentials was low relative to other items. In this paper, we have instead looked at the ‘basic needs poverty line,’ as estimated by Moatsos (Citation2021), which allows us to directly assess whether the population could meet a set of minimum physiological needs. This approach yields results that contradict the dominant narrative. Data on basic needs reveals two things: First, that during the 1980s, when much of China’s socialist economy was still in place (see, ), China had some of the lowest extreme poverty rates in the developing world; and second, that China’s capitalist reforms, in particular the privatisation drive of the 1990s, caused a major rise in poverty.
This illuminates an important paradox. The World Bank data shows that broad-gauge PPP incomes were rising in China during the 1990s, but empirical evidence shows that people were nonetheless becoming poorer in terms of their ability to access basic need-satisfiers. This raises significant questions about the usefulness of the World Bank’s approach to measuring poverty. Any legitimate indicator of poverty must take account of the cost of basic needs, paying attention to how these change under different provisioning systems.
These results have important implications for development policy. The data we present here indicates that public provisioning systems can be powerful tools for reducing or preventing extreme poverty and hunger in developing countries, even at relatively low levels of GDP per capita. Indeed, this may be a faster and more efficient way of improving human development outcomes than relying on capitalist markets. This observation is supported by data showing that China’s basic needs poverty rate was markedly lower, and its performance on other social indicators was markedly better, than in capitalist developing economies of comparable size and income. These findings are consistent with previous studies. Cereseto and Waitzkin (Citation1986) analysed 10 quantitative indicators of human wellbeing for the year 1980, including life expectancy and the adult literacy rate. They found that at any given level of GDP per capita, socialist states tend to have superior outcomes to capitalist states. Similarly, in his detailed study of health indicators around the world, Navarro (Citation1993) concluded that socialist countries generally had superior population health standards. Navarro noted that socialist China had much higher life expectancy than capitalist India, while Cuba outperformed the rest of Latin America. ‘This international survey shows that at least in the realm of underdevelopment, where hunger and malnutrition are part of the daily reality, socialism rather than capitalism is the form of organisation of production and distribution of goods and services that better responds to the immediate socioeconomic needs of the majority of these populations’ (ibid., p. 23).
It is important to emphasise that the results outlined in this paper describe only extreme poverty. The BNPL as defined by Allen (Citation2017) is a very low threshold, providing only for very basic necessities. Like the World Bank’s $1.9 threshold, the BNPL is not sufficient for a ‘decent life’ (Kikstra et al. Citation2021). Research by Kikstra et al. (Citation2021) indicates that the share of the global population unable to access clean water, education facilities, mobile phones, televisions, and transportation systems is considerably higher than the share living in extreme poverty, as defined by both the WBPL and the BNPL. It is plausible that higher poverty lines (i.e. those that account for the price of education, information technology, transportation, and other goods), would lead to different conclusions from those we have arrived at here. China was a very low-income country in the 1980s, and it did not have the productive capacity at the time to deliver higher standards of living for all. Although access to food (as measured by the BNPL poverty rate) was better in China than in Brazil and perhaps even the U.S in 1990, Chinese living standards were clearly lower in other respects. China had only 0.6 telephone subscriptions per 100 people at that time, compared to 6.3 in Brazil and 54 in the United States (World Bank Citation2022g). Similarly, although basic needs poverty deteriorated in China during the 1990s, access to modern communications technologies appears to have improved: the number of telephone subscriptions per 100 people rose considerably, reaching 27 in 2006. Yet BNPL results highlight an important fact: the dismantling of China’s public provisioning systems led to a marked reduction in the ability of the poor to access the goods they require for survival, and therefore caused extreme poverty to rise.
These findings support the arguments put forward by the Indian economists Utsa Patnaik and Prabhat Patnaik (Citation2017). According to Patnaik and Patnaik, the imposition of neo-liberal economic policies in the global South since 1980 has led to a reallocation of resources away from the production of food for the poor, and towards the export sector. This leads to what the Patnaiks call ‘income deflation’: a reduction in the purchasing power of the poor vis-à-vis foodstuffs. The evidence reviewed in this paper suggests that China’s neo-liberal reforms and the related export boom were indeed associated with ‘income deflation.’
This is not to say that all aspects of China’s pre-reform political institutions were positive from the perspective of poverty alleviation. China’s strong emphasis on public provisioning allowed for important gains against deprivation, but the repressive nature of the Chinese political system seriously undermined these achievements. As Drèze and Sen (Citation1989, pp. 210–215) have argued, the lack of democracy and independent media in Maoist China led to the famine between 1958–1961, which killed millions of people. Nevertheless, Drèze and Sen acknowledge that, ‘every eight years or so more people die in India because of its higher regular death rate than died in China in the gigantic famine of 1958–61. India seems to manage to fill its cupboard with more skeletons every eight years than China put there in its years of shame … [T]he Chinese political commitment – not unrelated to the ideological predispositions of the Chinese political system – seems to have served the country well for combating endemic deprivation, despite its failure as a defence against famines’ (Drèze & Sen Citation1989, pp. 214–215). It is therefore important to note that outside of the famine years, socialist China achieved very low mortality rates for a low-income country (Hipgrace Citation2011, Babiarz et al. Citation2015).
In pointing out that the privatisation drive of the early 1990s caused a rise in extreme poverty, we are not arguing that every policy reform introduced in China since 1978 has negatively affected living standards. Some elements of agricultural reform, for instance, may well have had a positive impact. During the Maoist period, the Chinese state intentionally set the terms of trade in favour of the industrial sector, creating a system of ‘unequal exchange’ whereby the rural economy furnished industry with cheap goods (Weber Citation2021, pp. 91 - 98). This policy was based on the ideas of the Soviet economist Yevgeni Preobrazhensky (Citation1965 [1926]), who argued that socialist states should finance industrialisation by emulating forms of colonial exploitation practiced by western Europe during its industrial revolution. Since the socialist states did not have colonies, Preobrazhensky believed they should extract surplus from their own countryside. He described this policy as ‘primitive socialist accumulation,’ drawing a direct parallel to the term Karl Marx gave to colonial plunder and enclosure: ‘primitive accumulation of capital’ (Christian Citation2018, pp. 354–357; Goldman Citation2022). Joseph Stalin executed this policy brutally after 1928, by concentrating peasants in government-controlled ‘collective farms’ where their produce could be forcibly requisitioned by the state (Allen Citation2003, Gregory Citation2004). These exploitative policies are widely believed to have caused the Soviet famines of 1932–33 and 1947, as well as the Chinese famine of 1958–61 (Ellman Citation2000, Meng et al. Citation2015, O’Grada Citation2015, Christian Citation2018).
In the 1980s, the Chinese reform leadership put an end to these policies by raising the government purchase price of farm products,Footnote7 and by encouraging peasant production for local markets on family plots and in cooperatively owned ‘Township and Village Enterprises’ (Ang Citation2016, pp. 77–81). Many scholars have argued that these reforms increased the incentives for peasants to improve their productivity, leading to the increase in calorie supply during the 1980s which we discussed above (ibid; Ravallion Citation2021, Weber Citation2021, Drèze and Sen Citation1989, p. 215). This has been challenged by Zhun Xu (Citation2018, pp. 39–55), who argues gains in food production at that time were due primarily to the introduction of new technologies, most notably chemical fertilisers and machine tools, by the Chinese state.Footnote8 Even so, agrarian reforms may well have had a positive impact on living standards by improving the terms of trade for, and incomes of, the peasantry. Policies supporting peasant agriculture and the autonomy of the rural population have been promoted for over a century by a diverse array of socialist thinkers, including anarchists (Bakunin Citation1870, Malet Citation1982, Chomsky Citation2005), agrarian socialists (Perrie Citation1976, White Citation2005, Borras Jr Citation2023), and anti-colonial Marxists (Fanon Citation1961, Amin Citation2011, pp. 101–128, Patnaik Citation2019). Such policies had the potential to strengthen China’s socialist system, by allowing peasant smallholders and agricultural cooperatives to provide goods not available through public distribution networks. This is precisely what has taken place, for instance, in contemporary Cuba, where the state continues to control the industrial sector and invest in the public distribution of food, while cooperatives, smallholders, and self-employed workers provision additional goods in local markets (Rosset Citation2011, DuRand Citation2017, Yaffe Citation2020, Blue et al. Citation2021).Footnote9
Yet the possibility that China could move toward a more enlightened form of socialism, respecting the rights of small farmers and making sensible use of markets where appropriate, was dashed by the privatisation of the SOEs and the abolition of most price controls in the late 1980s and early 1990s. Any gains that were made by improving agriculture’s terms of trade were outstripped by the dismantling of China’s public distribution systems. As we have seen, the decision to pursue wholescale capitalist reform was associated with a staggering increase in the basic needs poverty rate from 13 per cent in the earliest year of survey data, to around 68 per cent in the mid-1990s, overshadowing any increase in peasant incomes owing to agrarian reform.
One might argue that while China’s capitalist reforms increased extreme poverty in the short to medium term, they were nevertheless necessary for longer term improvements in living standards. As we have noted, China in the 1980s was a low-income country which lacked the productive capacity to ensure higher-order ‘decent living’ for its population. Perhaps the capitalist reforms were necessary to increase productive capacity, expand industrial output, and provide the material prerequisites for higher living standards. Ultimately, however, that argument is unconvincing. There is limited evidence that public involvement in the economy is inconsistent with strong growth rates. Allen (Citation2003) has compared the Soviet Union’s growth performance to countries that started from a similar level of development. He concludes that between the adoption of economic planning in 1928 and the collapse of the Soviet bloc in 1989, the USSR grew faster than ‘all major non-OECD countries with the exception of Taiwan and South Korea – the leaders of the East Asian miracle’ (ibid., p. 7). Furthermore, Taiwan and South Korea’s strong growth performance is itself attributable to extensive government involvement in protecting infant industries from foreign competition (Chang Citation2007). Amartya Sen (Citation1981, p. 298) quotes Datta-Chaudhuri that ‘no state, outside the socialist bloc, ever came anywhere near [South Korea’s] measure of control over the economy’s investable resources.’ This suggests that socialist China may have been able to grow its output to sufficient levels without dismantling its public provisioning systems. Given the negative impact that China’s capitalist reforms appear to have had in terms of extreme poverty, this possibility should be seriously considered when formulating development policies in the future.
It is important to be aware of the limitations of this study. The OECD data used in this paper relies on assumptions about trends in prices where direct data is not available. While the BNPL approach is a major improvement over the World Bank’s methodology, future research should be directed towards gathering additional price data for a larger number of items and years. Nevertheless, while the rate of extreme poverty cannot be stated with absolute certainty, the results yielded by the BNPL data are corroborated by empirical indicators of human welfare. These indicators demonstrate that the BNPL provides a more realistic measure of living standards than the WBPL methodology that underpins the standard narrative about poverty in China.
Disclosure statement
No potential conflict of interest was reported by the author(s).
Additional information
Funding
Notes on contributors
Dylan Sullivan
Dylan Sullivan is an Adjunct Fellow and PhD student in the School of Social Sciences, Macquarie University. His research focuses on global inequality, colonial history, and the economics of socialist planning.
Michail Moatsos
Michail Moatsos is Assistant Professor at School of Business and Economics, Maastricht University, and postdoctoral fellow at the Department of International Development, King's College London. His research focuses on global poverty, income and wealth distribution, and real wages.
Jason Hickel
Jason Hickel is Professor at ICTA-UAB and a Fellow of the Royal Society of Arts. His research focuses on global inequality, international development and ecological economics.
Notes
1 See Moatsos (Citation2016) for a definition of the bare bones basket. In short, it contains the price of a main staple and beans or peas sufficient to meet FAO recommendations for calories and protein, in addition to 3 kg of meat, 3 kg of butter and 2 kg of sugar, which would allow for some very limited dietary diversity (for instance, in practical terms this might mean consuming meat once per month). The BBB basket also includes 1.3 L of lamp oil, 1.3 kg of soap, 1.3 kg of candles, enough energy for heating and cooking, and a 5 Per cent (+/-2 Per cent) markup for rent and an 8 Per cent (+/- 2 Per cent) markup for clothing and footwear.
2 Moatsos (Citation2021) also estimated the poverty rate from 1820 to 2018. However, the pre-1981 figures rely on national accounts statistics that do not adequately represent changes in non-commodity forms of consumption (see, Sullivan and Hickel Citation2022). Moreover, in most cases the post-2008 figures are calculated on the assumption that food prices moved in line with the CPI, as direct price data was not available for that period. Unless otherwise noted, this paper only analyses the figures based on direct estimates of household consumption and food prices, and only on the estimates that use the original price data for China (‘CBN: original prices’ on figure 9.13 (ibid)).
3 The share of non-food prices in the BNPL tends to increase with GDP per capita, largely because the process of economic development tends to drive-up housing costs. Moatsos (Citation2021) accounts for this in his calculations.
4 The logic of this approach is that China’s food prices increased much more dramatically than the CPI over this period, so, it is theoretically plausible that China’s entire inflation rate can be accounted for by increases in food prices, while other prices remained constant.
5 Beijing residents reported that ‘price hikes in other basic goods were in the works,’ and that an increase in the price of cotton cloth by 20 per cent in a single day, had ‘sent droves of worried shoppers to state-run stores where they snapped up cotton goods by the bale’ (ibid).
6 The ADB argues that these policies disincentivised investment in housing construction and maintenance, leading to a national housing shortage. While a full assessment of this argument falls outside the scope of the present paper, it is worth noting that the ADB’s data indicates China’s urban housing space increased from 4.5m2 per person in 1950, to 6.7m2 in 1978, and then to 13.7m2 in 1990 (Gao Citation2010, p. 6). While these figures are low relative to the standards enjoyed in high income countries, they are consistent with the threshold used in the BNPL (3m2).
7 Since producer and retail prices are only loosely connected in a planned economy, rising farm prices did not lead to a substantial increase in the cost of basic staples for consumers in the first half of the 1980s. While the state sold basic necessities at below cost, it could recuperate its losses through revenues from the sale of cigarettes, electricity, and luxury goods. It was only with the comprehensive price liberalisation of the late 1980s and early 1990s that rising farm prices were passed on to consumers (Chai Citation1997, pp. 103-115).
8 Indeed, the Soviet Union increased its daily per capita calorie supply from around 2,100kcal prior to World War I, to 3,400kcal in 1960, suggesting Preobrazhensky’s policy did not necessarily inhibit agricultural productivity (Allen Citation2003, pp. 134–135).
9 Cuba’s policy mix has been remarkably successful at ensuring access to basic needs. Research by Allen (Citation2020, p. 121) suggests that an unskilled laborer in Cuba can purchase 6.58 subsistence baskets, the highest figure of all low- and middle-income countries. For perspective, a Brazilian labourer can only purchase 1.2 baskets, and a Russian labourer can only purchase 3. As of 2019, Cuba’s age-standardized death rate from energy-protein malnutrition is only 0.3 per 100,000 people, compared to 14.6 in low income countries; 3.3 in lower-middle income countries; 0.9 in the United States; and 0.6 in western Europe (Global Burden of Disease Collaborative Network Citation2019, Sullivan and Hickel Citation2022b).
References
- L.A. Times Archives., 1990. China Raises Price of Staples in Risky Reform. Los Angeles Times, 2 November 1990. Available from: https://www.latimes.com/archives/la-xpm-1990-11-02-fi-3964-story.html.
- Allen, R.C., 2001. The great divergence in European wages and prices from the middle ages to the first world War. Explorations in economic history, 38, 411–477.
- Allen, R.C., 2003. Farm to factory: a reinterpretation of the Soviet industrial revolution. Princeton: Princeton University Press.
- Allen, R.C., 2017. Absolute poverty: when necessity displaces desire. American economic review, 107 (12), 3690–3721.
- Allen, R.C., 2020. Poverty and the labor market: today and yesterday. Annual review of economics, 12, 107–134.
- Amin, S., 2011. Ending the crisis of capitalism or ending capitalism? Cape Town: Pambazuka Press.
- Ang, Y.Y., 2016. How China escaped the poverty trap. Ithaca: Cornell University Press.
- Babiarz, K.S., et al., 2015. An exploration of China’s mortality decline under Mao: A provincial analysis, 1950–80. Population studies, 69 (1), 39–56.
- Bakunin, M. 1870. Letters to a Frenchman on the Present Crisis. Marxist Internet Archives, https://www.marxists.org/.
- Baten, J., and Blum, M. 2013. Male height equivalent in cm [dataset]. Clio-Infra. Available from: https://clio-infra.eu/Indicators/Height.html.
- Baten, J., and Komlos, J., 1998. Height and the standard of living. The journal of economic history, 58 (3), 866–870.
- Blue, S.A., et al., 2021. Food sovereignty and property in Cuba and the United States. The journal of peasant studies, 49 (5), 1019–1036.
- Bolt, J., et al. 2018. Rebasing ‘Maddison’: new income comparisons and the shape of long-run economic development. Maddison Project Working Paper, nr. 10.
- Borras Jr, S.M., 2023. La Via Campesina – transforming agrarian and knowledge politics, and co-constructing a field: a laudatio. The Journal of Peasant Studies, 50 (2), 691–724.
- Cereseto, S., and Waitzkin, H., 1986. Economic development, political-economic system, and the physical quality of life. American journal of public health, 76 (6), 661–666.
- Chai, J.C.H., 1997. China: transition to a market economy. Oxford: Clarendon Press.
- Chang, H.-J., 2007. Bad samaritans: the myth of free trade and the secret history of capitalism. New York: Bloomsbury Press.
- Chomsky, N., 2005. On anarchism. Edinburgh: AK Press.
- Christian, D., 2018. A history of Russia, Central Asia, and Mongolia: volume II, inner Eurasia from the Mongol Empire to today, 1260–2000. Hoboken: Wiley-Blackwell.
- Deaton, A.S., and Dupriez, O. 2009. Purchasing power parity exchange rates for the global poor. Working Paper.
- Drèze, J., and Sen, A., 1989. Hunger and public action. Oxford: Clarendon Press.
- Drèze, J., and Sen, A., 2015. An uncertain glory: India and its contradictions. Princeton: Princeton University Press.
- DuRand, C., 2017. Cuba’s new cooperatives. Monthly review, 69 (6), 52–52.
- Ellman, M., 2000. The 1947 Soviet famine and the entitlement approach to famines. Cambridge Journal of Economics, 24, 603–630.
- Fanon, F., 1961. The wretched of the earth. New York: Grove Press.
- Feenstra, R.C., Inklaar, R., and Timmer, M.P., 2015. The next generation of the penn world table. American economic review, 105 (10), 3150–3182.
- Food and Agriculture Organization of the United Nations. 2021. Food Balances (2013, old methodology and population [dataset]. FAOSTAT. Available from: http://www.fao.org/faostat/en/#data/FBSH [Accessed 30 July 2021].
- Gao, L., 2010. Achievements and challenges: 30 years of housing reforms in the People’s Republic of China. Mandaluyong: Asian Development Bank.
- Global Burden of Disease Collaborative Network. 2019. Global Burden of Disease Study 2019 (GBD 2019) Results [dataset] Institute for Health Metrics and Evaluation (IHME). Available from: http://ghdx.healthdata.org/gbd-results-tool [Accessed 15 August 2021].
- Goldman, W.Z., 2022. Introduction: primitive accumulation and socialism. International Review of Social History, 67 (2), 195–209.
- Gregory, P., 2004. The political economy of Stalinism: evidence from the Soviet secret archives. Cambridge: Cambridge University Press.
- Hipgrace, D., 2011. Communicable disease control in China: from Mao to now. Journal of global health, 1 (2), 224–238.
- Kikstra, J.S., et al., 2021. Decent living gaps and energy needs around the world. Environmental Research Letters, 16 (9), 095006.
- Koepke, N., and Baten, J., 2005. The biological standard of living in Europe during the last two millennia. European Review of Economic History, 9, 61–95.
- Li, M., 2008. The rise of China and the demise of the capitalist world-economy. London: Pluto Press.
- Li, M., 2016. China and the 21st century crisis. London: Pluto Press.
- Liu, L., 2015. Capitalist reform, the dismantling of the iron rice bowl and land expropriation in China: A theory of primitive accumulation and state power. Sociology mind, 5, 41–60.
- Malet, M., 1982. Nestor Makhno in the Russian civil war. London: the Macmillan Press.
- Meng, X., Qian, N., and Yared, P., 2015. The institutional causes of China’s great famine, 1959–1961. Review of economic studies, 82, 1568–1611.
- Moatsos, M., 2016. Global absolute poverty: behind the veil of dollars. Journal of globalization and development, 7 (2), 20160033.
- Moatsos, M., 2021. Global extreme poverty: present and past since 1820. In: OECD, ed. How was life? Vol. II: new perspectives on well-being and global inequality since 1820. Paris: OECD Publishing, 186–212.
- Moatsos, M., and Lazopoulos, A., 2021. Global poverty: a first estimation of its uncertainty. World development perspectives, 22, 100315.
- Navarro, V., 1993. Has socialism failed? An analysis of health indicators under capitalism and socialism. Science & Society, 57 (1), 6–30.
- O Grada, C., 2015. Eating people is wrong, and other essays on famine, its past, and Its future. Princeton: Princeton University Press.
- Our World in Data, 2023. Average years of schooling: average number of years people aged 25+ participated in formal education [dataset]. Our World in Data. Available from: https://ourworldindata.org/grapher/mean-years-of-schooling-long-run?tab=char. [Accessed May 26 2023].
- Patnaik, P., 2019. Capitalism, socialism, and petty production. Marxist, XXXV (1), 28–43. Available at: https://cpim.org/sites/default/files/marxist/201901-marxist-prabhat-patnaik-capitalism-socialism.pdf.
- Patnaik, U., and Patnaik, P., 2017. A theory of imperialism. New York: Columbia University Press.
- Perrie, M., 1976. The agrarian policy of the Russian Socialist-Revolutionary Party from its origins through the revolution of 1905-1907. Cambridge: Cambridge University Press.
- Pinker, S., 2018. Enlightenment Now: the case for reason, science, humanism, and progress. New York: Random House.
- Preobrazhensky, Y., 1965 [1926]. The new economics. Translated by Brian Pearce. London: Oxford University Press.
- Radelet, S., 2015. The great surge: The ascent of the developing world. New York: Simon & Schuster.
- Ravallion, M. 2021. Poverty in China Since 1950: a counterfactual perspective, National Bureau of Economic Research. Available from: https://www.nber.org/system/files/working_papers/w28370/w28370.pdf [Accessed 26 Jan. 21].
- Reddy, S.G., and Pogge, T., 2010. How Not to count the poor. In: Sudhir Anand, Paul Segal, and Joseph E. Stiglitz, eds. Debates on the measurement of global poverty. Oxford: Oxford Scholarship Online, 42–85.
- Rosset, P.M., et al., 2011. The Campesino-to-Campesino agroecology movement of ANAP in Cuba: social process methodology in the construction of sustainable peasant agriculture and food sovereignty. The Journal of Peasant Studies, 38 (1), 161–191.
- Sen, A., 1981. Public action and the quality of life in developing countries. Oxford bulletin of economics and statistics, 43 (4), 287–319.
- Sen, A., 1998. Mortality as an indicator of economic success and failure. The economic journal, 108, 1–25.
- Solt, F., 2020. Measuring income inequality across countries and over time: the standardized world income inequality database. Social Science Quarterly, 101 (3), 1183–1199.SWIID Version 9.4, November 2022. Available at: https://fsolt.org/swiid/.
- Sullivan, D., and Hickel, J. 2022b. 16 Million and counting: the collateral damage of capital. New internationalist.
- Sullivan, D., and Hickel, J., 2022. Capitalism and extreme poverty: a global analysis of real wages, human height, and mortality since the long 16th century. World development, 161, 106026.
- Tupy, M.L. 2015. Global poverty’s defeat is capitalism’s triumph. Cato Institute. Available from: https://www.cato.org/commentary/global-povertys-defeat-capitalisms-triumph.
- van Leeuwen, B., van Leeuwen-Li, J., and Foldvari, P. 2013. Educational inequality gini coefficient [dataset]. ClioInfra. Available from: https://clio-infra.eu/Indicators/EducationalInequalityGiniCoefficient.html [Accessed 14 March 2022].
- Weber, I.M., 2021. How China escaped shock therapy: the market reform debate. London: Routledge.
- White, E., 2005. The emigre Socialist Revolutionary Party and the Russian peasantry during NEP. Revolutionary Russia, 18 (1), 47–70.
- World Bank. 2021a. Life expectancy (years) [dataset]. World Bank DataBank. Available from: https://data.worldbank.org/indicator/SP.DYN.LE00.IN [Accessed: 30 July 2021].
- World Bank. 2021b. Physicians (per 1,000 people) [dataset]. World Bank DataBank. Available from: https://data.worldbank.org/indicator/SH.MED.PHYS.ZS [Accessed 30 July 2021].
- World Bank. 2021c. Hospital beds (per 1,000 people) [dataset]. World Bank DataBank. Available from: https://data.worldbank.org/indicator/SH.MED.BEDS.ZS [Accessed 30 July 2021].
- World Bank. 2021d. WDI Database Archives. Country: All. Series: Access to electricity (% of population). Time: All. Version: April 2019 [dataset]. World Bank DataBank. Available from: https://databank.worldbank.org/source/wdi-database-archives-(beta) [Accessed 4 September 2021].
- World Bank. 2022a. Mortality rate, infant (per 1,000 live births) [dataset]. World Bank DataBank. [Accessed 16 Feb. 2022].
- World Bank. 2022b. Mortality rate, under-5 (per 1,000 live births) [dataset]. World Bank DataBank. [Accessed 16 Feb. 2022].
- World Bank. 2022c. Death Rate, crude (per 1,000) [dataset]. World Bank DataBank. [Accessed 15 March 2022].
- World Bank. 2022d. Literacy rate, adult total (% of people ages 15 and above) [dataset]. World Bank DataBank. Available from: https://data.worldbank.org/indicator/SE.ADT.LITR.ZS [Accessed 15 March 2022].
- World Bank. 2022e. School enrolment, primary (% gross) [dataset]. World Bank DataBank. Available from: https://data.worldbank.org/indicator/SE.PRM.ENRR?end = 2020&start = 1970&view = chart&year = 1983 [Accessed 15 March 2022].
- World Bank. 2022f. Prevalence of wasting, weight for height (% of children under 5) [dataset]. Available from: https://data.worldbank.org/indicator/SH.STA.WAST.ZS [Accessed 27 Jan. 2022].
- World Bank. 2022g. Fixed telephone subscriptions (per 100 people) [dataset]. World Bank DataBank. Available from: https://data.worldbank.org/indicator/IT.MLT.MAIN.P2 [Accessed 8 Feb. 2022].
- World Inequality Database, 2023. Bottom 50% national income share [dataset]. World Inequality Database. Available from: https://wid.world/world/#sptinc_p0p50_z/CN;IN;ID;MX;BR/last/eu/k/p/yearly/s/false/4.295/30/curve/false/country [Accessed 30 May 2023].
- Xu, Z., 2018. From commune to capitalism: how China’s peasants lost collective farming and gained urban poverty. New York: Monthly Review Press.
- Yaffe, H., 2020. We Are Cuba: how a revolutionary people have survived in a post-Soviet world. Cornwall: Yale University Press.