
 ?Mathematical formulae have been encoded as MathML and are displayed in this HTML version using MathJax in order to improve their display. Uncheck the box to turn MathJax off. This feature requires Javascript. Click on a formula to zoom.
Abstract
We analyze the effect of the European Union Competition Authority’s block exemption towards R&D cooperatives in a horizontal market structure, valid as long as the combined product market share is not too large. Two less efficient firms attempt to catch up with a technological leader, and may use the safe harbour provided by the legislation. We consider when the incentives of the R&D-performing firms are aligned with those of consumers, and when increases in the market share limit improves welfare. We show that an effective policy within this framework might be elusive. The market share restriction must be set in order that it is optimal for firms to use the safe harbour, and that this leads to more R&D than under competition. Even in this case, further increases in the market share restriction can harm welfare. This has widespread implications for how the EU Competition authority should respond to calls for an increase in the market share restriction.
1. Introduction
In 2002, European ministers announced a goal of turning the EU into the most competitive knowledge-based economy in the world, with R&D spending of 3% of GDP by 2010. The desired level of R&D spending was not reached, so the time frame was extended to 2020 (Sheehan and Wyckoff Citation2003). This goal still lies far ahead; the R&D intensity in the EU was 2.07 in 2017, with two-thirds of this spent in the business enterprise sector.Footnote1 One instrument for encouraging R&D spending within the European Union is to allow product market competitors to form cooperative R&D agreements if they fulfill the criteria of the block exemption laid out in Commission Regulation (EU) No. 1217/2010. The block exemption defines the parameters for a safe harbour within which cooperative agreements are deemed to comply with EU competition law without the need to analyze the effect on competition. One of the provisions here is that horizontal firms can join together in an R&D cooperative if they ex ante do not possess more than 25% of total market share, and if the firms’ market share arising out of the R&D cooperation (ex post), within the relevant market for products, services or technologies, does not become too high. Indeed, with an ex post market share of up to 25%, firms can benefit from the block exemption for seven years, whereas the exemption period is two years for market shares of 25–30%, and one year for an ex post market share above 30%. The period of validity of this regulation started from January 1st 2011 and shall expire on December 31st 2022.Footnote2 The introduction of a market share limit is supposed to maintain the balance between product market competition and R&D investments, where agreements falling within the block exemption are assumed to be such that the positive effect from R&D outweighs the negative effect that increased concentration in the product market might have.Footnote3 The onus is on the cooperating firms to self assess any potential agreement in order to be sure that the safe harbour applies, and many legal guides are readily on offer to aid the evaluation.Footnote4
In this paper, we analyze the implications of the R&D block exemption, and how the application of the market share limit influences incentives to use the safe harbour, and how changes in this limit can affect profits, consumer surplus and hence welfare. Our main model involves R&D active firms that compete with a technological leader, investing in R&D to make their production more efficient in order to capture a larger share of the product market.Footnote5 Assuming initially that the leader does not perform R&D, we derive conditions under which the laggards prefer to cooperate under the block exemption, and when this increases R&D investment in line with the desired EU outcome. We also demonstrate how the market share limit should be set to maximize welfare in the market in question. The model is then extended to the case in which the leader actually does perform R&D to demonstrate the wider applicability of our conclusions. This case is interesting from a strategic point of view since the adherence to the market share limit by cooperating laggards can be used by the leader to calculate its optimal R&D investment. The analysis thus provides input to policy makers who must decide whether the block exemption should be renewed and/or adjusted when the current period expires.
The results reflect a nuanced view of the R&D block exemption policy. In previous literature, it is well known that most R&D will be performed by firms that do not cooperate on this activity when there are low spillovers between firms in the industry.Footnote6 When the spillovers are larger, we show that when firms choose to take advantage of the safe harbour, that this gives more actual R&D than competition would have yielded. Furthermore, since consumer surplus is increasing in R&D, this strategy by the firms also benefits the consumers. Hence, when firms decide to operate within the block exemption, this automatically fulfills the aims of the policy relating to R&D effort and being of benefit to consumers. In our welfare analysis, we show that the relationship between total welfare and the market share limit is not monotonic. Increasing the market share limit is beneficial in the sense that it allows firms to perform more R&D without moving away from the legal security given by the safe harbour. More R&D is efficiency-enhancing in itself; on the other hand, increasing the market share limit allows less efficient firms to serve a larger part of the market which is not efficient. In extending our analysis to the case in which the technological leader also can perform R&D, we show that investment of the cooperating firms and in total can be reduced when the market share limit increases.
Asymmetry is a key feature of our model, building on the framework of Halmenschlager (Citation2004), and several cases provide motivation for our asymmetric model. One is the cooperation between GlaxoSmithKline and Pfizer in 2009, who intended to challenge Gilead Sciences, the leader in HIV-drug development and marketing.Footnote7 Gilead was at the time the market leader in HIV treatment with a drug called Truvada, whilst Glaxo marketed two drugs, Combivir and Epzicom. The Financial Times reported that the cooperative venture would have a 19% share of the global HIV market, and GSK’s chief executive, Andrew Witty, is quoted as saying:” This is a new and unique way of incentivising research success and deciding how to allocate research and development capital”.Footnote8 Lee (Citation2016) notes that catching up is a common phenomenon in technological industries where laggards attempt to emulate existing technologies, and make production cost-effective, mentioning the case of dynamic RAM chips in which” Incumbent leading firms are less strongly inclined to initiate next generation chip development since they want to fully exploit profits from the current generation chip” (Lee Citation2016, 185). Intel was a leading firm that behaved in this way, and Samsung a late entrant attempting to catch up. In an analysis of high-tech manufacturing in the US 1972–99, Coad (Citation2011) finds a high positive correlation between R&D performed by leading firms and their market value, whereas innovative activity is not so valuable for laggards. He suggests that laggards should achieve productivity growth through efficient exploitation and imitation of existing technology; furthermore, he notes that there are certain ”advantages of backwardness” that allow the laggard to catch up such us access to the frontier production technology, and the ability to learn from the leader’s mistakes.
Prior to the revision of the original legislation for the block exemption on R&D cooperation in 2010, a public consultation of stakeholders was held. Footnote9 Many of the responses show that the R&D block exemption can be an important instrument to facilitate cooperation, but that attitudes to the 25% market limit were varied. In its answer to the consultation, the communications company Alcatel Lucent stated: ”Cooperation with other parties in research and development has been an important means for Alcatel Lucent (ALU) to bring innovative new products to the market…. Since it came into force in 2001, (….), the research and development block exemption regulation has been critical in providing the legal security that ALU requires before it can commit to joint R&D projects”. At the other end of the scale, Licensing Executives Society Inc - the largest professional organization in the field of intellectual property - queries the utility of the R&D block exemption, asking if such an instrument is necessary. Further, some stakeholders such as Google and The European Chemical Industry Council suggested that the market share threshold is too low, whilst the American Bar Association suggested a market share cap of 35%. This view was shared by the International Bar Association who also emphasized the relationship between the guidelines and the Lisbon strategy: ”the review process should focus on simplifying and streamlining those texts and put them more in line with the objectives of the Lisbon Agenda, in particular by removing any disincentive against stimulation of competitiveness, innovation and growth”. In addition, economists also debate informally the setting of the market share limit, although little analysis has appeared in the formal literature.Footnote10
As the current period of legislation is drawing to a close, the European Commission has once again held a public consultation to examine whether the regulation should be allowed to lapse, be prolonged, or revised.Footnote11 There were 77 stakeholders who responded to the survey, of which 25 provided detailed replies. Eight of these relied on the R&D block exemption, including Volkswagen, Nokia and BASF, the world’s leading chemical company. In all, 70% of all respondents had cause to check the R&D block exemption guidelines often or occasionally, and the main benefits of the legislation were reported to be the legal certainty that it grants since it is enforceable in the whole EU area; this increases the scope for cross-border R&D and also lowers the cost of entering collaborative agreements. Of the respondents who expressed an opinion, 19 of 29 thought that the market share restriction is too low; the European Competition Lawyers Forum suggests ”that the threshold of the R&D Block Exemption should be raised, or even abolished, given the largely positive effects of joint R&D. The current cap of 25% is not indicative of market power: market shares at that level rarely raise significant antitrust concerns, particularly with regard to R&D and innovation”. We attempt to provide some formal advice as to how this limit should be set, also in the light of the fact that the current period for the legislation is drawing to an end.
1.1. Related literature
Ruble and Versaevel (Citation2014) offer a comprehensive analysis of the R&D block exemption for the case of symmetric firms in Cournot oligopoly, some of which may form an R&D joint venture. Their focus is on the effects that this has on the R&D level and hence consumer surplus. In the version of the model that most closely resembles ours,Footnote12 the authors reiterate the result of D’Aspremont and Jacquemin (Citation1988) that for large enough spillovers, R&D agreements are desirable for any level of market share. Furthermore, they show that restricting market share can rule out some cases in which cooperation would be desirable. Whilst our model limits the number of participating firms, an important asymmetry is introduced which means that less efficient firms can perform R&D to attempt to catch up with the market leader.Footnote13 Such R&D is not necessarily welfare-enhancing, and cooperation within the block exemption may not be socially desirable even when knowledge spillovers are high; this follows since costly R&D allows less efficient producers to serve a larger share of the market. In Ruble and Versaevel (Citation2014) all firms benefit from R&D whether they are innovators, or simply passively receive spillovers (imitators); furthermore, their work covers the case in which R&D collaborators fulfill the market share restriction ex ante, but do not consider the market ex post of R&D investment. Since the block exemption regulation introduces time restrictions on agreements that violate the market share criterion ex post, we explicitly consider this in our analysis. Specifically, we consider R&D agreements that are sustainable in the sense of not exceeding the specified market share in the ex post production market.Footnote14
The literature on cooperative R&D agreements (starting with Katz Citation1986) has grown extensive over the years. Policy makers are of course interested in assessing to what extent value is created by a joint R&D venture, and to what extent it is lost due to less competition. Scott (Citation2008, 1306) takes an overall big-picture view ”that for a broad range of circumstances there would be less R&D investment as competitive pressure is lessened”. Hence, the R&D block exemption would seem to be at odds with the aim of increasing R&D activity. There are several hindrances that may serve to make the R&D level of firms lower than that desired by the EU at the macro level. De Bondt (Citation1997) notes that firms’ private incentives to invest in R&D are negatively affected by uncertainty from the R&D process, and Hagedoorn (Citation1993) claims that increasing speed of technological development leaves firms with less time to recover their costs. In addition, high costs associated with the development of new products and technologies also deters firms from investing on their own (Galbraith Citation1952 and Kamien, Muller, and Zang Citation1992), which is supported by the empirical findings of Cohen and Klepper (Citation1996) showing a positive relationship between process R&D and firm size.Footnote15 With positive externalities in product innovation, R&D competition involves a free-rider problem. In this case, Besanko and Wu (Citation2013) show that R&D competition results in lower or equal ex ante investment than under research cooperation, and that R&D cooperation can be welfare improving independent of the technology spillover. With this background, Hewitt-Dundas (Citation2006) suggests that policy initiatives to encourage more firms - and especially small firms - to innovate should involve less legislative and regulatory constraints, and less red tape. The EU block exemption on cooperative R&D arrangements can be seen as a step in this direction. On the other hand, one sees the view that cooperative R&D agreements among product market competitors may increase the possibility of product market collusion (Motta Citation2004; Suetens Citation2008). The market share limit of the block exemption can limit this effect, however.
A different institutional setup is considered by Ferrett and Poyago-Theotoky (Citation2016) who explicitly compare a full merger situation (common R&D and production) with a Research Joint Venture that may not be enforceable and not generate knowledge spillovers between the parties. With identical firms, a horizontal merger is preferred by participants if there are few actors in the market (due to increased market power); this however, may provoke aggressive behaviour in the product market from competitors who are outside of the merger. The gain from merging is smaller when the cost of R&D is high, since less R&D is performed; this, together with better contract quality leads to an RJV being preferred by the cooperating firms as well at to society as a whole. Similar to Ferrett and Poyago-Theotoky (Citation2016), we consider the optimal choice of participating firms, but do not always find that some form of cooperation will be entered in to: in our case cooperation is limited by the market share constraint which may make it infeasible. We also consider firms that are different ex ante.
The rest of the paper is organized as follows: In Section 2, the main model is presented, and the cases of R&D competition, free R&D cooperation and R&D cooperation restricted by the market share limit are derived. In Section 3, we present our main analysis in which we seek to look at the following research questions: i) when will firms want to use a block exemption to facilitate R&D cooperation?, ii) when is this the most profitable strategy for firms?, iii) when is this welfare-enhancing for consumers?, iv) how is welfare affected by the market share limit? Section 4 presents an extension of the basic model in which also the market leader may perform R&D. Section 5 concludes.
2. The model
In the basic model - adapted from Halmenschlager (Citation2004) - there are three firms in the market producing a homogenous product, and there is production cost asymmetry between the market leader, who does not conduct any R&D, and two lagging firms (laggards). Halmenschlager (Citation2004) justifies the assumption of no R&D by the leader by suggesting that this firm considers its cost advantage large enough, or that it has adopted all existing new processes. Footnote16 The inverse market demand function is linear and given by:
(1)
(1)
where P is the product price and Q is total quantity produced. The firms have constant production cost, and the technological leader holds a cost advantage over the symmetric laggards; the leader’s production cost is normalized to zero. The two lagging firms have cost function:
(2)
(2)
where xi denotes firm i’s R&D effort, β is the exogenous spillover parameter from the R&D process, with
and the ex ante unit production cost,
Footnote17 The firms’ R&D costs are assumed to take the form
i = 1, 2, with
representing R&D efficiency, and F is an avoidable fixed cost. To satisfy the criterion laid out in Amir et. al (2008) that one laboratory should be more efficient at the same level of spending than two, we assume
Footnote18 The leader is assumed to have adopted all new processes available, and there are no R&D spillovers leaking from or to the leader.
In this two stage game, the laggards choose their R&D investment, x1 and x2 respectively, at the first stage. In the second stage the three firms engage in Cournot competition; the laggards produce q1 and q2 and the technological leader q3 so that
The game is solved through backwards induction, calculating the subgame-perfect Nash equilibrium. This reveals the second stage profit functions for the laggards and the technological leader respectively:
(3)
(3)
(4)
(4)
Maximizing profit at the second stage for the three firms, reveals the Nash equilibrium quantity output for the firms:
(5)
(5)
(6)
(6)
From Equation(5)(5)
(5) we see that the threshold at which laggards benefit from the other firm’s R&D efforts is found at
That is, an increase in firm j’s R&D spending would increase firm i’s equilibrium quantity level.
In order to be able to cooperate on R&D within the block exemption, the combined ex ante market share of the laggards cannot exceed
(7)
(7)
Suppose that each laggard firm has a symmetric amount of R&D in equilibrium, Then the total quantity produced is strictly increasing in the R&D level and equal to:
(8)
(8)
Hence, we can see that consumer surplus defined by is increasing in the amount of R&D performed.Footnote19
At the first stage of the game we consider three different scenarios in which the lagging firms can choose their R&D effort. First is R&D competition where firms maximize individual profit:
(9)
(9)
The second possibility is free R&D cooperation, where the laggards set their R&D efforts cooperatively, in separate labs, in order to maximize joint profits.Footnote20 Using Equation(5)(5)
(5) and Equation(9)
(9)
(9) the joint profit maximization at stage 1 is:
(10)
(10)
The third possibility is restricted cooperation where the cooperating firms’ set R&D so that their combined market share does not exceed a share of the total market for the product:
(11)
(11)
where
from Equation(5)
(5)
(5) and Equation(6)
(6)
(6) .Footnote21 Proposition 1 gives the amount of R&D, output and profits for each scenario. To make sure that all of the solutions exist, and are well defined we assume the following relationship between the parameters of the model:Footnote22
(12)
(12)
The following proposition characterizes equilibrium for each case (see Appendix A for proof).Footnote23
Proposition 1.
For each type of R&D scenario, symmetric equilibrium is characterized by the following: i) R&D competition:
(13)
(13)
(14)
(14)
(15)
(15)
ii) Free R&D cooperation is possible for
giving
(16)
(16)
iii) Restricted R&D cooperation is possible for
, entailing
(17)
(17)
(18)
(18)
(19)
(19)
(20)
(20)
(21)
(21)
We assume that F is small enough to ensure positive profits in all cases. Note that when Equation(12)
(12)
(12) holds.
In the case of R&D competition, firms set their R&D efforts individually, without knowing the effort of the rival. When the laggards cooperate freely on R&D investment, the condition in part (ii) ensures that the laggards can achieve the optimal cooperative R&D investment without violating the market share condition. When this is not possible, the laggards get as close as possible to the cooperative solution by setting R&D so that they exactly fulfill the allowed market share (restricted cooperation).
The condition in part (iii) ensures that free R&D cooperation is not possible, and that the ex ante market share of the laggards is not too large as to discount some sort of R&D collaboration.Footnote24 The restricted level of R&D is affected negatively by an increase in spillover (i.e.
), since the firms have to limit their investments in order to stay within the market share constraint. As expected,
since an increase in the market share limit would leave firms with a higher range of possible R&D investments without violating this constraint. Note also that - in contrast to the other cases - the level of restricted R&D is increasing in original production cost, c. For any given market share limit, k, more R&D is required to get to this market share, the less efficient are the partners initially.
From Equation(20)(20)
(20) , we can deduce that laggard profit is strictly increasing in k for
Additionally
we assume that the fixed cost of R&D is small enough to make this positive, and hence profit is positive for all
Whether the profit function in the case of restricted cooperation is convex or concave in k is parameter-specific.
3. Analysis
3.1. R&D levels
From Halmenschlager (Citation2004) we know that if, and only if,
When spillovers between firms are relatively low (
) there will always be more R&D investments in R&D competition compared to the case with free cooperation. This is due to the low effect from the internalization of the spillover externality, leaving R&D investments as strategic substitutes. On the other hand, when the spillover rate is larger (
), R&D investments become strategic complements as we can see from Equation(5)
(5)
(5) . We are, however, interested in comparing R&D cooperation that is restricted by the market share limit with R&D competition. In the following Proposition we provide the conditions where restricted R&D cooperation leads to higher investments than R&D competition; here we define
such that
In the following, we often drop the dependence of
and
on the model parameters for ease of reading.
Proposition 2.
i) For . ii) For
and
then
if
, and
if
This result is derived simply by comparing the expressions for and
for
When
and there is no value of the market share limit that equates the two expressions. Part ii) of Proposition 2 is visualized in . Compared with the competitive R&D situation, offering a safe harbour will increase investments if there are sufficient spillovers in the R&D technology, and if the market share limit is sufficiently large. In other cases, the block exemption regulation will not foster R&D investment. It is easily verified that the R&D level
and the cost of R&D
are strictly increasing and strictly convex in k.
Figure 1. Relative R&D levels,
![Figure 1. Relative R&D levels, β∈(13,1].](/cms/asset/2eb2db2f-bdb2-409e-8a10-c666d2a58de3/cijb_a_1823188_f0001_b.jpg)
For the block exemption regulation to actually increase R&D as compared to a fully competitive situation, it must also be in the interests of the firms to cooperate in this manner. We turn now to when restricted cooperation is an optimal R&D strategy from the perspective of the laggards.
3.2. Optimal R&D strategy
Firms’ R&D investments are driven by the search for profits. If the market share limit is set so that restricted cooperation is a feasible strategy, the firms might still choose to compete in R&D if this gives the largest profits. Therefore the difference in profits between R&D competition and the restricted R&D cooperative determines the laggards’ economic incentives to engage in R&D agreements.Footnote25 The following proposition characterizes the optimal R&D strategy of the laggards.
Proposition 3.
and
for
and
Proof.
Recall that and that
is independent of k. It is straightforward to verify that
given that
and
As k is increased, the difference
falls monotonically, reaching zero at
(implying
). As k is increased further towards
we have that
□
With the results in Propositions 2 and 3, parameter combinations can be identified such that the incentives of the EU (who desire more R&D, and higher consumer surplus) and laggard firms (who seek profit) are aligned and when they are mismatched. This is depicted in , where we suppress arguments other than c for simplicity in the expressions for and
It is straightforward to verify that these curves are all are downward sloping, and concave in c as drawn.
Figure 2. Aligned and mismatced incentives.
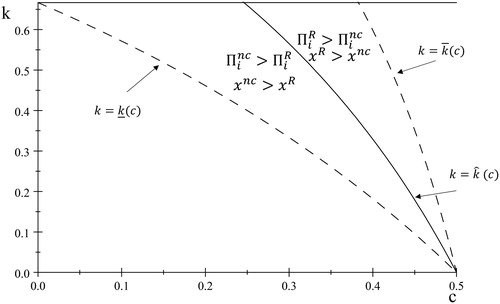
The area between the dashed lines defines parameter combinations for which the laggards can choose the safe harbour without violating the market share restriction. The solid line in the figure delineates the profit motive for using the block exemption, and in the area marked and
the safe harbour gives most R&D and consumer surplus, and is the optimal strategy of the laggards. Here the incentives of the regulating authority (EU) and the firms are completely aligned. Note that this area is larger, the larger the market share limit. In the area
and
the safe harbour policy is possible to use, but it does not increase R&D over the competitive situation, and gives the laggards less profit; incentives here are mismatched. Laggards that are too efficient initially will not choose the safe-harbour strategy, since they will hit the market share cap quickly.
3.3. Welfare
Welfare consists of the sum of consumer surplus and the profits of all three firms. In the case of restricted cooperation this is:
(22)
(22)
(23)
(23)
The expression in Equation(22)(22)
(22) consists of four terms: the first is the combined profits of the laggards (gross of R&D expenditures) using Equation(20)
(20)
(20) ; the second is the profit of the leader from Equation(21)
(21)
(21) ; the third is consumer surplus from the sum of Equation(18)
(18)
(18) and Equation(19)
(19)
(19) , and the fourth is the total cost of R&D from the two laggards, using xR to represent the common R&D level from Equation(17)
(17)
(17) . Denoting the first three terms as the surplus from the product market, we can see that this is only affected by the level of the market share restriction k. Indeed, it is easily verified that the product market surplus is a convex function of k with a minimum at k = 0.25. The convexity of this function is due to the relative effects that increasing the market share restriction has on laggard profits and consumer surplus (positive) and leader profit (negative).
As mentioned in the introduction, responses to the previous and currently ongoing evaluation of the R&D block exemption have indicated that the market share restriction should be increased from its current level. From an economic point of view, it is interesting to know how this will affect welfare. This is, however, not simply a matter of determining the shape of and then finding a maximum point since firms only prefer to use the safe harbour for
Hence, we need to determine the optimal choice of k (denoted kW) in this region.Footnote26
Social welfare can be a concave or convex function of k which is increasing or decreasing in the market share limit. It does, however, have a unique turning point which is given by kTP where
Depending on the specific values of the model parameters, this turning point can be a maximum or minimum. Proposition 4 - proved in Appendix B - characterizes the welfare-maximizing choice of the market share limit:
Proposition 4.
Define , and consider
If
, then
If
If
The welfare maximum depends critically on the initial level of efficiency of the laggard firms. When the initial production cost is low (case i), and the laggards are already quite efficient, social welfare is either increasing in k in the permitted interval, or reaches a maximum point. For initially inefficient laggards (case iii), the welfare function is either decreasing in the whole region, or it has a minimum so that the optimal market share limit is at either end of the range. The proof of Proposition 4 shows that for the parameters in this region, so that the lowest market share limit (
) is optimal. For intermediate initial levels of production cost (case ii), the R&D cost represented by γ is important for finding the welfare-maximizing market share limit. When this parameter is high then increasing the market share limit from
will lead welfare to fall, making
the optimal choice; for lower levels of the R&D cost, it is welfare improving to increase the market share limit; either the maximum point of welfare will be reached at
or this point lies beyond
in which case
is welfare optimal. Proposition 4 is illustrated in .
Figure 3. Welfare-maximizing market share limit.
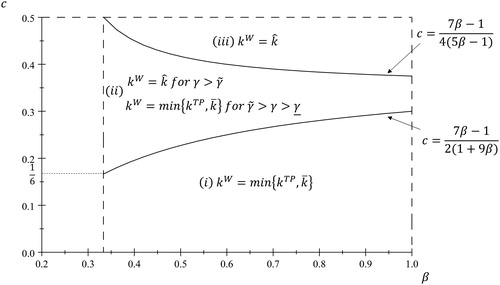
When the laggard firms are quite efficient in their production (area (i) in , corresponding to Proposition 4i), then the block exemption regulation increases the R&D and profit levels of the collaborators compared to the non-cooperative outcome. Even if it is not feasible to set the market share limit that gives the welfare maximum, then increasing the market share limit above will attain the goals of the policy by increasing R&D and hence consumer surplus. This is also true for area (ii) where firms are less efficient initially, but where R&D costs are sufficiently low (Proposition 4ii). When R&D costs are high, or the firms are very inefficient initially (area iii), the welfare optimum implies setting the market share limit at
since further increases lead to a fall in welfare (Proposition 4iii). Recall, however, from Proposition 3 that this gives the same R&D and profit levels as the non-cooperative solution. In these cases, the block exemption policy will not work.
4. Three firm R&D
In the analysis so far, we have assumed a significant asymmetry between the firms that exploit the block exemption, and the one that does not since the latter does not perform R&D as it already has a zero cost. It is natural to ask to what extent our results depend upon this quite strong assumption. In this section, we demonstrate that the qualitative effects identified previously are still present when all firms perform R&D, although the reasoning behind the results is different. Whilst it is technically possible to solve a general model in which the dominant firm has a lower initial cost than the rivals, a different level of R&D cost, and differential spillover rates, the analysis involves so many parameters that its interpretation becomes problematic. To show the effects at work when all three firms perform R&D, we present a very simple model in which two firms have the same initial production cost, and the dominant firm has a lower production cost; all three have identical cost of R&D, and there are no spillovers between firms. It is well known that when the spillover is small, that free cooperation gives less R&D than a non-cooperative solution. Here, we are considering a restricted form of cooperation so that this result will not necessarily hold. We show below that when two firms join together to exploit the block exemption, an interesting strategic situation appears that has been masked in the analysis to now.
After having performed R&D, the ex post production cost is and
where
Now the model is characterized by the parameters
At stage 1, firms decide R&D investments, and production takes place at stage 2 as before. Suppose that firms 1 and 2 cooperate in their R&D so that each performs an amount x at stage 1, and firm three has x3. Production at stage 2 is then characterized by functions
Footnote27 In setting the cooperative R&D level, and staying within the block exemption, the R&D level x is chosen to solve
(24)
(24)
Hence, adhering to the block exemption gives a rule for the R&D of the laggards in terms of the initial cost parameters, the market share and the R&D of firm 3. In Appendix C this is shown to be
(25)
(25)
so that laggard R&D increases with the amount of R&D of the leader. This reaction - which has not appeared in the analysis until now - is taken account of by firm 3 at stage 1 to determine the optimal level of R&D which maximizes
(26)
(26)
This gives the amounts of R&D as and
further specified in Appendix C. Note that the R&D of 3 does not depend on the initial cost of the laggard. A series of observations follow from these expressions, and these are detailed in Appendix C.Footnote28
Proposition 5.
xBER is strictly convex in k.
If
If
If
Let
First, xBER is a strictly convex function of k. Second, if R&D cost is too high, then the market share restriction must be above a critical level, K, to admit positive R&D; however laggard R&D is increasing in k in this region. Third, intermediate R&D cost means that R&D is always positive, and increases when the market share restriction is increased. Fourth, for low R&D cost, R&D by the laggards is positive, and is first decreasing and then increasing in k, so that there is an interior minimum point for R&D investments. Fifth, the leader always has positive R&D and this is always decreasing in the market share restriction. Finally, total R&D is a strictly convex function of k. In terms of the EU goal of using the block exemption to increase total R&D, this part of the proposition is important. If R&D cost is large enough, then increasing the market share limit will indeed increase total R&D; for small R&D costs, total investment reaches a minimum point for an interior value of k. Hence, a policy of increasing the market share limit will cause total R&D to fall if we are currently to the left of the minimum, and increase it if the current situation is to the right. Importantly, identifying the minimum point depends only on the R&D cost for the industry, and not the initial cost parameters of the firms; this can be important information for the regulating authority, since it depends on information relating to the industry in general and not the specific participants.
Even at this level of simplicity, the expressions for profit and welfare become difficult to interpret. To carry out an analysis of this we need to simplify further by setting so that all three firms can carry out R&D, and two of them cooperate under the block exemption regulation. Footnote29 With three symmetric firms, final profit to each in the purely non-cooperative case is
(27)
(27)
Suppose that firms 1 and 2 were to join together to perform R&D under the block exemption. Given that the joint profit is strictly concave in the R&D investment as before, a binding market share restriction means that these firms set their common R&D level so that their market share is exactly k:
(28)
(28)
Note that this is a best response function for the cooperating firms who set R&D depending upon the level chosen by rival 3; this information is then utilized by 3 in maximizing its own profit at stage 1. Hence the exploitation of the block exemption by two of the firms introduces an asymmetry into the symmetric model which is different to the one introduced by pure joint profit maximization where firms take account of the externality that they cause each other. The resulting levels of R&D in this case are
Final profit for each cooperating firm is then
(29)
(29)
Furthermore, social welfare under the block exemption is
As before, we are interested in identifying when cooperating firms prefer this strategy to non-cooperation, and to look at how social welfare reacts to changes in the market share restriction This is visualized in .
Figure 4. R&D performed by three firms - welfare implications, (a) (b)
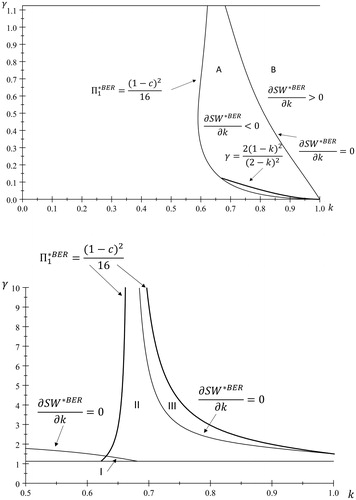
The figures depict results for different combinations of γ and k, since the production cost simply enters all expressions in this reduced model multiplicatively; the figures are divided at which is the lowest R&D cost parameter that fulfills the second-order condition in the non-cooperative R&D problem. Hence gives the comparison between the regimes when both can exist, and gives the welfare implications when only the block exemption regime can be used.
Consider first . By doing no R&D, each firm secures a third of the market, earning a profit of in the symmetric three-firm model. To want to use the block exemption, participating firms must get more profit than they would under both a regime with no R&D, and one with non-cooperative R&D. Within the heavy lines in , the block exemption is strictly preferred by the participating firms.Footnote30 This occurs for a high market share level due to the fact that firms are symmetrical at the outset.Footnote31 Also marked are lines at which changing the market share has no effect on social welfare (
). Three areas are marked in in areas I and III, for both high and low levels of k, increasing the market share leads to a fall in social welfare, whereas it increases in area II. Hence, for a given level of R&D cost, γ, it is possible to find a value of the market share limit that maximizes welfare.
In , the firms do not perform non-cooperative R&D, and areas A and B represent parameter combinations that give the participating firms more profit from using the safe harbour than doing no R&D.Footnote32 The market share restriction that minimizes social welfare is on the locus between the two areas. indicate the difficulty of using the block exemption as a” one size fits all” regulation. In a market that is characterized by high R&D costs (), increasing the market share limit will initially lead to an increase in welfare, attaining a maximum and then falling. When R&D cost is low as in , welfare will initially fall as the market share limit is increased, rising only after the minimum point is reached.
5. Conclusion
Competition authorities must often balance between regulating cooperation that may harm competition, and fostering cooperation that may be economically beneficial. On the one hand, research cooperation may be seen as leading to collusion in the product market (Martin Citation1995) and lower R&D intensity (Scott Citation2008), but on the other may convey incentives to innovative activity that may otherwise not have occurred (Hagedoorn, Link, and Vonortas Citation2000). In the US, legislation is largely case-based according to a rule of reason analysis, whereas the EU has attempted a pragmatic, rule-based approach with a block exemption given that a market share limit is not breached. Prior to the 2010 revision of the EU R&D block exemption, and as part of the recent public consultation, several companies and institutions submitted views that block exemption was useful but that the 25% market share limit should be changed. Much legal advice is available to those who draft agreements within the confines of the block exemption, suggesting that the safe harbour is utilized even though the actual agreements are not a matter of public record. Economists debate informally the use of the block exemption and the setting of the market share limit, although little analysis has appeared in the formal literature.
This paper has attempted to start to fill this gap given that the period for the current legislation runs until the end of 2022. Previous work has focused on symmetric firms and that the block exemption can be used simply by fulfilling the market share limit ex ante of R&D investment. Our point of departure is that R&D firms that might use the block exemption are attempting to catch up to a superior market leader, and that the agreement should be sustainable ex post of the R&D efforts. Whether firms cooperate on R&D within the block exemption or whether they compete is an economic decision that we investigate. Furthermore, we have investigated how this affects the amount of R&D and consumer surplus, delineating cases in which firms and consumers have aligned interests, and when they are in opposition. A general welfare analysis revealed a nuanced view in the setting of the market share limit. Raising the limit has two opposing effects on welfare: first it distributes more production to less efficient firms, and second it encourages efficiency-enhancing R&D activity. Setting the market share limit must balance these effects, and one cannot take for granted that an increase in this will be welfare improving.
Given the conflicting effects that the market share limit has on total welfare, it would seem to be a sensible goal for the block exemption policy to lead to an increase in R&D investment (which in turn benefits consumers), rather than a general increase in welfare. We have, however, demonstrated a difference in how R&D levels react to changes in the market share limit depending upon whether the leading firm performs cost-reducing R&D or not. When laggards attempt to catch up to a passive leader, then we have shown that the incentives of the cooperating firms and the EU can be aligned, and that increases in the market share limit will increase R&D investment. On the other hand, when the technological leader also performs R&D, the effect is not so clear cut. In industries where R&D is expensive to do, then quite little is performed by the firms, and increasing the market share limit even a little may encourage more R&D. When R&D is inexpensive, the firms need a large increase in the market share limit before they will increase their R&D spending. The” one size fits all” nature of the block exemption will not necessarily be able to fulfill the goal of the policy in this case.
The model that we have used is simple, but its conclusions striking. Checking the robustness of the results would require looking at a more detailed market in which firms are asymmetric initially, and in which some perform R&D whilst others do not. Ideally, one should incorporate uncertainty on behalf of the firms as to whether they are actually within the market share limit, since in our model a simple mechanical calculation allows exploitation of all of the gains from operating within the restricted cooperative. It would also be instructive to analyze how different specifications of the block exemption may affect behavior. Here we have taken simple market share, but one could also imagine using a measure based on increases in market share, or profits shares. Additionally, one would like to be able to consider the fact that firms cooperate on R&D with several others, in different markets and using different instruments (such as R&D merger, joint labs and knowledge sharing). We have also restricted the strategic choices of the partners to either cooperate within the block exemption or compete in R&D. Partners may also choose to cooperate outside of the block exemption, and face any penalties that the legal system may provide for if such cooperation is in contravention of competition law. These are topics for future research.
Disclosure statement
No potential conflict of interest was reported by the author(s).
Notes
1 Source: Eurostat.
2 Article 4,7 and 9 of Commission Regulation 1217/2010. See European Union (2010).
3 In the United Sates, The National Cooperative Research and Production Act of 1993 has - in part - the goal of increasing the number of R&D joint ventures entered into by US firms (Hemphill Citation2003). No specific market share limit is set, but joint ventures are assessed under the rule of reason. See Scott (Citation2008) for more details.
4 See for example https://prodstoragesam.blob.core.windows.net/highq/64,578/eu-competition-rules-horizontal-agreements.pdf. See also Le Frapper (Citation2012).
5 Our model is one of process innovation in the spirit of D’Aspremont and Jacquemin (Citation1988).
6 D’Aspremont and Jacquemin (Citation1988), and most relevant to our work Halmenschlager (Citation2004).
9 The original legislation was passed in 2000 (Regulation No 2659/2000), see European Commission (2000). Replies to the public consultation can be found at https://ec.europa.eu/competition/antitrust/legislation/horizontal_archive _en.html. The following examples are taken from this consultation.
10 For informal discussions see for example http://www.ipdigit.eu/2013/11/is-rd-cooperation-a-steppingstone-to-collusion/.
11 This happened between November 6th 2019 and February 12th 2020. See https://ec.europa.eu/competition/consultations/2019_hbers/index_en.html.
12 The case of R&D output spillovers as modelled initially in D’Aspremont and Jacquemin (Citation1988).
13 The leader is assumed to use state of the art technology, and does not receive knowledge spillovers from the competitors. Leiponen and Byma (Citation2009) suggest that small firms that cooperate in research tend to limit the amount of R&D leakage to larger competitors by using the speed to market or trade secrets.
14 The importance of the ex post product market is outlined in Commission Regulation 1217/2010, and also in the antitrust literature. Meissner and Markl (Citation2005, 206) write that ”the antitrust treatment of R&D cooperations should rely on ”safe harbours” defined in terms of the combined ex post market shares of the firms involved”.
15 Cabon-Dhersin and Gibert (Citation2019) assess the role of subsidies in the promotion of R&D cooperation and non-cooperation.
16 In our model, the leader’s marginal production cost is zero, ruling out further efficiency gains. In its Global Innovation 1000 study for 2017, leading consultancy firm ‘Strategy&’ find that many of the most innovative companies do not necessarily spend large amounts on R&D. See https://www.strategy-business.com/feature/What-the-Top-Innovators-Get-Right?gko=e7cf9. Furthermore, Coad (Citation2011, 1055) states that” Leader firms who are at the industry frontier, are already close to the limits of productive efficiency that can be achieved through existing production technologies”.
17 Halmenschlager (Citation2004) assumes the gap between leader and lagging firms to be non drastic, which in our model implies This is also referred to as the catching up effect. It can readily be seen from the analytical expressions that this is necessary for positive laggard production and R&D levels.
18 See Amir, Jim, and Troege (Citation2008) Proposition 5.
19 This is also true if since
which is increasing in the sum of R&D investments.
20 We model cooperation at the R&D stage as a joint profit maximization but other possibilities exist such a R&D merger or maximization in individual labs and knowledge sharing as in Ferrett and Poyago-Theotoky (Citation2016).
21 The lead firm has a production cost of zero, and - independent of the R&D regime - the two laggards can at most achieve the same zero cost; this leads to an equal three-way split of the product market. Hence the combined ex post market share of the two laggards cannot exceed
22 When condition Equation(12)(12)
(12) is fulfilled, the maximand in each case is a strictly concave function of R&D investment.
23 Only the equilibrium expressions that are necessary for facilitating the analysis are given in Proposition 1. Other expressions are given in Appendix A for completeness.
24 Note that ensures that
25 In a model of uncertain product innovation, Capuano and Grassi (Citation2019) explicitly endogenize the firms’ decision on whether or not to cooperate.
26 Note that by choosing Proposition 3 applies so that the regulation is used to implement higher R&D and profit levels for those who perform it than would arise from non-cooperative behavior.
27 Calculations are presented in Appendix B; just necessary equations are reproduced in the text.
28 The critical value K is also defined in Appendix B.
29 This is similar to the symmetric model of Ruble and Versaevel (Citation2014), with the important exception that we consider agreements that fulfill the block exemption also in the ex post production market.
30 Indeed, it is the regime with no R&D that is next best in this case, with the non-cooperative model being worst in terms of profit for firms 1 and
31 Initially, before R&D, each firm would expect to serve one-third of the market.
32 The heavy line is the second-order condition for the maximization problem of firm 3.
References
- Amir, R., Y. J. Jim, and M. Troege. 2008. “On Additive Spillovers and Returns to Scale in R&D.” International Journal of Industrial Organization 26: 695–703.
- Besanko, D., and J. Wu. 2013. “The Impact of Market Structure and Learning on the Trade-Off between R&D Competition and Cooperation.” The Journal of Industrial Economics 61 (1): 166–201.
- Cabon-Dhersin, M.-L., and R. Gibert. 2019. “Cooperation or Non-Cooperation in R&D: How Should Research Be Funded?” Economics of Innovation and New Technology 28 (6): 547–568. doi:10.1080/10438599.2018.1542775.
- Capuano, C., and I. Grassi. 2019. “Spillovers, Product Innovation and R&D Cooperation: A Theoretical Model.” Economics of Innovation and New Technology 28 (2): 197–216.
- Coad, A. 2011. “Appropriate Business Strategy for Leaders and Laggards.” Industrial and Corporate Change 20 (4): 1049–1079. doi:10.1093/icc/dtr012.
- Cohen, W. M., and S. Klepper. 1996. “Firm Size and the Nature of Innovation within Industries: The Case of Process and Product R&D.” The Review of Economics and Statistics 78 (2): 232–243.
- D’Aspremont, C., and A. Jacquemin. 1988. “Cooperative and Noncooperative R&D in Duopoly with Spillovers.” American Economic Review 78 (5): 1133–1137.
- De Bondt, R. 1997. “Spillovers and Innovative Activities.” International Journal of Industrial Organization 15 (1): 1–28. doi:10.1016/S0167-7187(96)01023-5.
- European Commission. 2000. “Commission Regulation (EC) No 2659/2000 of 29 November 2000 on the Application of Article 81(3) of the Treaty to Categories of Research and Development Agreements.” Official Journal of the European Communities 43 (L304): 7–12.
- European Union. 2010. “Commission Regulation (EU) No 1217/2010 of 14 December 2010 on the Application of Article 101(3) of the Treaty on the Functioning of the European Union to Certain Categories of Research and Development Agreements.” Official Journal of the European Union 53 (L335): 36–42.
- Ferrett, B., and J. Poyago-Theotoky. 2016. “Horizontal Agreements and R&D Complementarities: Merger versus RJV.” International Journal of the Economics of Business 23 (1): 87–107. doi:10.1080/13571516.2015.1049848.
- Galbraith, J. K. 1952. American Capitalism: The Concept of Countervailing Power. London: Hamish Hamilton.
- Hagedoorn, J. 1993. “Understanding the Rationale of Strategic Technology Partnering: Inter-Organizational Modes of Cooperation and Sectoral Differences.” Strategic Management Journal 14 (5): 371–385. doi:10.1002/smj.4250140505.
- Hagedoorn, J., A. N. Link, and N. Vonortas. 2000. “Research Partnerships.” Research Policy 29 (4–5): 567–586. doi:10.1016/S0048-7333(99)00090-6.
- Halmenschlager, C. 2004. “R&D-Cooperating Laggards versus a Technological Leader.” Economics of Innovation and New Technology 13 (8): 717–732.
- Hemphill, T. A. 2003. “Cooperative Strategy, Technological Innovation and Competition Policy in the United States and the European Union.” Technology Analysis & Strategic Management 15 (1): 93–101. doi:10.1080/0953732032000046079.
- Henriques, I. 1990. “Cooperative and Non-Cooperative R&D in Duopoly with Spillovers: Comment.” The American Economic Review 80 (3): 638–640.
- Hewitt-Dundas, N. 2006. “Resource and Capability Constraints to Innovation in Small and Large Plants.” Small Business Economics 26 (3): 257–277. doi:10.1007/s11187-005-2140-3.
- Kamien, M., E. Muller, and I. Zang. 1992. “Research Joint Ventures and R&D Cartels.” The American Economic Review 82 (5): 1293–1306.
- Katz, M. L. 1986. “An Analysis of Cooperative Research and Development.” The RAND Journal of Economics 17 (4): 527–543. doi:10.2307/2555479.
- Le Frapper, I. 2012. “Striking the Right Balance between Cooperation and Competition: Several Antitrust Pitfalls in R&D Alliances and Other Strategic Partnerships.” International in-House Counsel Journal 5: 1–18.
- Lee, K. 2016. Economic Catch-up and Technological Leapfrogging: The Path to Development and Macroeconomic Stability in Korea. Cheltenham, UK: Edward Elgar.
- Leiponen, A., and J. Byma. 2009. “If You Cannot Block, You Better Run: Small Firms, Cooperative Innovation, and Appropriation Strategies.” Research Policy 38 (9): 1478–1488. doi:10.1016/j.respol.2009.06.003.
- Martin, S. 1995. “R&D Joint Ventures and Tacit Product Market Collusion.” European Journal of Political Economy 11: 733–741.
- Meissner, W., and R. Markl. 2005. International R&D Cooperations, in Competition Policy in the Global Economy: Modalities for Cooperation. Edited by W.S. Comanor, A. Goto and L. Waverman. Routledge. London, U.K.
- Motta, M. 2004. Competition Policy: Theory and Practice. Cambridge University Press, Cambridge.
- Ruble, R., and B. Versaevel. 2014. “Market Shares, R&D Agreements, and the EU Block Exemption.” International Review of Law and Economics 37: 15–25. doi:10.1016/j.irle.2013.04.008.
- Scott, J. T. 2008. “The National Cooperative Research and Production Act.” Issues in Competition Law and Policy (ABA Section of Antitrust Law ) 2: 1297–1317.
- Sheehan, J., and A. Wyckoff. 2003. Targeting R&D: Economic Policy Implications of Increasing R&D Spending. STI working paper 2003/8. Paris: OECD.
- Suetens, S. 2008. Does R&D Cooperation Facilitate Price Collusion? An Experiment. Journal of Economic Behavior & Organization 66: 822–836.
Appendix A
Proof of Proposition 1
(i) Maximizing (Equation9(9)
(9) ) using (Equation5
(5)
(5) ) gives the following first-order condition:
Solving this for xi = xj gives in (13). The second-order condition and stability condition are satisfied for
and this is automatically fulfilled for
in (12). On the stability condition in R&D models see Henriques (1990). Inserting
into (Equation5
(5)
(5) ), (Equation6
(6)
(6) ), (Equation3
(3)
(3) ) and (Equation4
(4)
(4) ) gives the other expressions in part (i). For completeness, note that
(A1)
(A1)
(A2)
(A2)
(ii) Differentiating (Equation10(10)
(10) ) with respect to xi gives the first-order condition:
Solving this for xi = xj gives in (Equation16
(16)
(16) ). The following expressions are recovered by substitution
(A3)
(A3)
(A4)
(A4)
(A5)
(A5)
(A6)
(A6)
The second-order condition for the cooperative case is Positive
is ensured for
Both are fulfilled for
in (Equation12
(12)
(12) ). Using (EquationA3
(A3)
(A3) ) and (EquationA4
(A4)
(A4) ), the market share of the cooperating firms is
and this does not violate the market share restriction as long as
(iii) From (Equation5(5)
(5) ) and (Equation6
(6)
(6) ), the market share of the cooperating firms given
is
Solving for this market share equal to k gives in (17). The other expressions are recovered by substitution. Restricted cooperation is allowed if
Appendix B
Proof of Proposition 4
Differentiating the welfare function with respect to k gives a unique turning point denoted by kTP in the text. If the turning point is located in the interval then the welfare function will have slopes of different signs at each end of the interval; if the turning point is outside of this interval, then the welfare function will either be increasing or decreasing in the whole interval (i.e. have the same slope sign at both ends of the interval). At the bottom of the interval
(B1)
(B1)
This is generally dependent on γ, but is certainly positive if the term in square brackets is non-negative, i.e. for which is the bottom region in . In this region, the welfare function is increasing in k at the bottom of the interval. Measured at
(B1) is certainly negative for
which is the top region in . Increasing γ from the minimum level makes the slope a larger negative number, so that in the top region of the welfare function is decreasing at the bottom of the interval. For intermediate levels of c (
), the slope is negative (positive) for
(the middle region of ).
At the top of the interval
(B2)
(B2)
This is certainly positive for The value of (B2) is negative (positive) for
for
(Note that
for
).
Consider part (i) of the Proposition. When either the welfare function is upward sloping at both ends of the interval (so that
), or it slopes upwards at
and down at
for
giving
as the interior maximum of welfare. In part (iii) of the Proposition, the welfare function is decreasing in k at
and is either decreasing at
for
(implying
), or increasing for lower values of γ, implying that kTP gives a minimum of the welfare function. Hence welfare will be maximized at one of the endpoints of the interval. The difference in welfare
is a strictly convex function of γ with two real roots
Direct calculation reveals that
so that
for all permitted γ, so that
for the region considered in part (iii).
The type of welfare maximum depicted in part (ii) is parameter dependent. Consider first If
then
and the slopes of the welfare function are negative at each end of the interval; hence
If
then
then two possibilities occur. Either
in which case the slope of WR is negative at
and positive at
so that kTP is an interior minimum, and
implies
or
which implies that the slope of the welfare function is negative at both ends of the interval and hence
Thus for
the optimal choice of market share limit is
For
at
and the slope at the top of the interval is positive or negative depending on whether
is below or above
Hence, the welfare function will either be upward sloping over the whole interval (
), or it will have an interior maximum and
Appendix C
Proof of Proposition 5
Let be the production cost of firm
after performing R&D. At the production stage, each firm chooses qi to maximize profit given by
Standard maximization gives
Given the quantities produced at stage two are
The symmetric amount of R&D performed by firms 1 and 2 solves (Equation24(24)
(24) ) giving (Equation25
(25)
(25) ) in the text. Then the production of firm 3 is
and the maximization problem of 3 in (Equation26
(26)
(26) ) becomes
The first order condition for the maximization is
with second order condition
Solving the first order condition gives the final expression
which, inserted into (Equation25
(25)
(25) ), yields the symmetric R&D investments of firms 1 and 2:
Let which is a quadratic expression in k.
Part 1
Taking the second derivative of the R&D function gives
where the sign is determined by the sign of the numerator, which is quadratic in γ. This expression is convex in γ, and has positive value at γ = 0. The slope of the quadratic is negative at
for k < 0.81386, implying that any real roots are negative for
For k > 0.81386, the roots to this quadratic are
It is straightforward to verify that these roots are real only for but as established above, they are negative in this area. So for all values of k, the numerator is positive and the second derivative
implying strict convexity.
Part 2
Differentiation gives
the sign of which depends on the numerator.
for
Since this latter expression is bounded between 0 and 1, and this part assumes
(which follows from
), then
The expression xBER has a negative value at k = 0 if With this assumption, xBER has a negative value at k = 0, and is increasing in k, whilst part 1 has established convexity. Hence there will exist a value k (denoted K) such that k > K gives
This is found as the value of
that gives
direct calculation gives
We must establish
Given the monotonicity of
this can be accomplished by checking that
Evaluating gives
which is least likely to be positive when c3 is large. However,
is the largest value for this variable, in which case
Part 3
When then
follows from part 2; furthermore,
has positive slope and positive value at k = 0. These observations imply that
for all k.
Part 4
Solving gives a unique solution for
as
and this is a minimum since
is strictly convex in k. If
for this minimum point, then
for all k. The condition
at the minimum reduces to
It can readily be established that
for
and since
is assumed in this part of the proposition, the claim is proven.
Part 5
That is obvious given the assumptions made. Furthermore
Part 6
Differentiating twice gives
so the sign is given by the sign of
which is quadratic in γ. Furthermore, Θ is strictly convex in γ and has a positive value at γ = 0; it has a positive slope at γ = 0 for k > 0.77526. Hence, for k > 0.77526, Θ is certainly positive. The roots of
are not real for k < 0.875. This implies that Θ is positive for all values of k, and XBER is convex in k.
The slope of total R&D is given by
and the sign is determined by the numerator
Solving Δ = 0 gives a single root in the interval
as
for
Since XBER is a convex function of k, this marks a minimum point. When
the roots of Δ are either negative or larger than 1; combined with the fact that
at k = 0, gives the result that
for