
 ?Mathematical formulae have been encoded as MathML and are displayed in this HTML version using MathJax in order to improve their display. Uncheck the box to turn MathJax off. This feature requires Javascript. Click on a formula to zoom.
Abstract
This paper explores how liquidity in the UK rental markets reacts to variations in demand across time and space. We employ a survival analysis approach with a non-parametric hazard rate to investigate whether the probability of a property to exit the market changes across calendar months. Our unique dataset comes from Zoopla.com and contains 300,198 rental listings in 13 major UK university cities over the 2015–2017 period. Our results suggest that the probability of exit is lower during the winter season compared to summer. This could be explained by students’ higher housing demand at the start of the academic term. The results become more pronounced (i.e. the seasonal difference is higher) when the distance between marketed property and university campuses is taken into account.
1. Introduction
Liquidity is one of the key characteristics of housing markets. The literature on real estate studies analyses this important characteristic and aims to explore time on market (TOM) (a measure of liquidity) and its link to house prices (e.g. Haurin et al. Citation2010; Khezr Citation2015), locational characteristics (e.g. Brastow, Waller, and Wentland Citation2018), or how TOM changes over at different percentiles of the price distribution (e.g. Carrillo and Pope Citation2012). There is also a body of literature that relates liquidity with asymmetric information between sellers and real estate agents (Levitt and Syverson Citation2008), and macroeconomic factors such as tax (Kopczuk and Munroe Citation2015; Dachis, Duranton, and Turner Citation2012), unemployment rate, and mortgage rate (Kalra and Chan Citation1994; Head and Lloyd-Ellis Citation2012). While most recent papers focus on the sales market, liquidity in the rental market has received much less attention.Footnote1 In this empirical investigation, we aim to extend this literature and explore how the probability of exiting the market (conditional probability given total months of time on market since first advertised) responds to seasonality patterns and whether distance to universities plays any role.Footnote2
Distance to universities provides a unique setup essential for our identification strategy. First, UK higher education institutions have academic calendars which start in September every year. Second, the number of students in the UK has substantially increased over the last 10 years. Between 2000 and 2018 the total number of students enrolled in universities increased from 2,000,000 to 2,500,000.Footnote3 The increasing demand for accommodation by these students and the lack of adequate residence halls has increased the reliance on the private rented sector.Footnote4 Third, most UK universities are clustered in large cities or in parts of large cities. In this case, marketed dwellings located in university neighbourhoods are particularly sensitive to seasonal fluctuations.
We employ a unique dataset on the private rental market obtained from Zoopla.com over the period 2015 to 2017. Using Zoopla data allows us to track the majority of the listings in the UK rental market. We focus on 13 cities over a 24-month period and carry out estimations with 300,198 unique listings. To understand the seasonality pattern in the UK rental market, we look at the changes in the probability of a propertyFootnote5 to exit the market across calendar months. Furthermore, we look at how the calendar effect changes with distance to university campuses. Survival analysis is utilized as this probability changes with the time property stays on the market.
Our paper is connected to several strands of the literature on the housing market. First, our study relates to student housing literature. Even though full-time students now comprise a large and continuously growing population, only a third of full-time students benefit from Purpose Built Student Accommodation (PBSA) beds while the remaining students rely on the private rental marketFootnote6, research on student housing remains limited. Amongst the few studies touching upon student demand for accommodation, Ogur (Citation1973) found that student housing demand increased average rent in the local markets. Rugg, Ford, and Burrows (Citation2004) investigated how local markets react to student demand for accommodation and the impact of this demand on the competition for housing. Our study contributes to student housing literature by providing empirical evidence that students in Higher Education Institutions (HEI) play a role in the observed seasonality patterns in the rental market. Although the effect of certain demographic groups, such as parents with children and newlyweds, documented in the literature, to our knowledge, our paper is the first that examines the effect of HEI students in the rental market.
Second, it adds to a large body of literature on liquidity. Lin and Vandell (Citation2007) showed that understanding liquidity in the real estate market is crucial since asset valuation analyses that are solely based on prices lead to biased estimations of return (upwards) and risk (downward). A common finding in the real estate studies is that there is a significant difference between hot-season and cold-season: the market slows down in winter while prices increase, and TOM shortens during summer.Footnote7 Some other studies examine the effects of market tightness (i.e. the ratio of buyers to sellers) on prices and TOM.Footnote8 Novy-Marx (Citation2009) postulated that following a positive shock to market tightness, houses could be sold more quickly. This could reduce the availability of houses (stock of sellers) in the market which further increase the relative number of buyers to sellers and amplify the initial shock. Although liquidity is popularly investigated for the sale market, there are only a few studies that look at the rental market. Using data on the German rental market, Cajias and Freudenreich (Citation2018) found that higher rents, size, and proximity to the city centre significantly affect liquidity. Ruf (Citation2017) looked at the relationship between liquidity in the rental housing markets and urban agglomeration in Switzerland and concluded that local liquidity is negatively related to the distance to nearby located urban agglomeration centres. Cajias, Fuerstb, and Bienertc (Citation2016) investigated the impact of energy consumption on TOM and showed that dwellings with relatively low-energy efficiency stayed on the market longer. Allen, Rutherford, and Thomson (Citation2009) investigated the relationship between the rental asking price and liquidity using data from the US. It was shown that landlords who set a lower asking rent relative to predicted rent face a shorter marketing period for their properties. In contrast, overpricing the asking rent and then reducing it later caused a longer marketing time (after the reset) and often a lower rent. Our paper contributes to the literature by examining how liquidity in the rental markets responds to the student housing demand, which peaks around the start of the academic term.
Finally, our work also contributes to the literature documenting the importance of locational characteristics in housing markets. For instance, it was found that conditional on similar houses’ characteristics, house prices vary with distance to external amenities, such as parks (Dehring and Dunse Citation2006), railroads (Hess and Almeida Citation2007; Zolnik Citation2020), landfills (Nelson, Généreux, and Généreux Citation1992), earthquake fault zones (Singh Citation2019), and airports (Espey and Lopez Citation2000). Parallel to our paper, Rivas et al. (Citation2019) studied the impact of the distance from the nearest university or hospital on sale and rental prices . Their results showed that being closer to these institutions are associated with the higher sale and rental prices. Complementing and contributing to this study, our paper documents the dynamic effect of distance to universities on rental price by looking at the changes in this effect over the calendar months.
Our work provides important insights into student housing demand and rental housing markets. First, TOM exhibits variation across different times of the year, where the summer season has the shortest marketing times. These patterns are similar to hot-cold season phenomena, observed in sale markets (Ngai and Tenreyro Citation2014). Second, we show that the start of the academic term has a significant effect on the rental market. In the month preceding the start of the academic term, the time on market shortens and the probability of exiting the market for a property increases. Immediately after the academic term starts, the probability of exiting the market decreases and the time on market increases. Finally, the effect of the start of the academic term becomes particularly stronger in the areas closer to the campuses showing students` preferences towards proximity. In line with this result, rental prices are also found to be more volatile over time in the areas that are close to the universities. Accordingly, the student housing demand creates a seasonality pattern in the private rental markets which peaks around the start of the academic term.
2. Empirical strategy
2.1. Data
The dataset that we exploit in the analysis is from the Zoopla website, which is the second most popular UK property portal. According to WhenFresh, a company that processes the listings of Zoopla, this site covers about 70% of the whole‐of‐household privately rented housing stock in the UK. We collect the listing information for 13 major cities in the UK from Zoopla.com through Application Programming Interface (API) for the period from August 2015 to August 2017. The Zoopla API enables us to obtain GPS coordinates of each listed property. Using internet advertisements on popular platforms has recently become a popular way of looking at housing markets.Footnote9 However, to our knowledge, our paper is the first study that analyses the rental markets in the UK using online listings. Using this information together with the GPS coordinates of universities, we calculate the distance between each property and the closest university campus to this property in the relevant city. The Zoopla API also provides the number of bedrooms for each property that we use as a control for size in the analysis. Unfortunately, Zoopla website does not provide any information on the interior space or age of unit. To add additional variables, we applied a keyword search on the descriptions provided for each listing and categorized listed properties into three building type categories, namely, house, flats, and other (other category consist of bungalow, farmhouse, cottage, maisonette, villa). Around 42% of the properties are flat while 37% are houses. Remaining 20% fall into the other category.Footnote10
Our results are obtained using the data from 13 cities: Birmingham, Leeds, Glasgow, Bristol, Liverpool, Manchester, Sheffield, Edinburgh, Cardiff, Coventry, Newcastle, Nottingham, and Plymouth. Any missing information in our data is completed from the data provided by the Urban Big Data Centre.Footnote11, Footnote12 In the cleaning process, we exclude those properties that came to the market before the 10th of August 2015, since we are not able to track changes in the listing status of these properties from the time the listing was added to the website to the time we started collecting the data. We also remove properties that came to the market in July 2017, as we stopped collecting data in that month.Footnote13 We exclude any listings with the same ID but different first publishing dates since we do not know which date is accurate. To reduce the effect of extreme observations, the listings with more than 10 bedrooms (top 1 percentile) or the weekly rent is less than £30 or more than £700 (bottom and top 1 percentile) are removed.Footnote14 Finally, we exclude listings, for which the minimum distance to a university is more than 22 km (top 5 percentile). These procedures result in a total of 300,198 observations.
In the sample, Birmingham has the highest number of listings on the market, accounting for about 13% of the total listings. This was followed by Newcastle and Manchester, which both accounted for approximately 11%. In contrast, Plymouth has the lowest number of listings, with only around 3%. This number of listings is generally consistent with the size of the city.Footnote15 provides the mean value of the main variables used in the multivariate analysis. For the full sample, the average weekly rent is £178, the average distance to a university is 4.7 km, the average TOM is 2 months, and the average number of bedrooms is 2.4. The average weekly rent for properties which are closer to a campus (whose distance to closest campus are shorter than the median of sample—3 km) is £22 more expensive (12%) than the mean in the whole sample.Footnote16 On average, the size of properties in terms of the number of bedrooms is the largest in Cardiff and Newcastle, while properties in Edinburgh and Glasgow are the smallest among our cities. The lowest weekly rents are found to be in Sheffield and Liverpool, while the highest rents are in Bristol and Edinburgh. The average TOM is lower in Edinburgh, Glasgow, and Bristol, while higher TOM is observed in Liverpool and Sheffield. These results show that the lowest rents are observed in cities where TOM is the longest and highest rents are observed in cities where TOM is the shortest. This is consistent with the empirical literature that documents the negative relationship between vacancy rates and rental prices (Eubank and Sirmans Citation1979; Hendershott Citation1995; Allen, Rutherford, and Thomson Citation2009).Footnote17
Table 1. Sample characteristics.
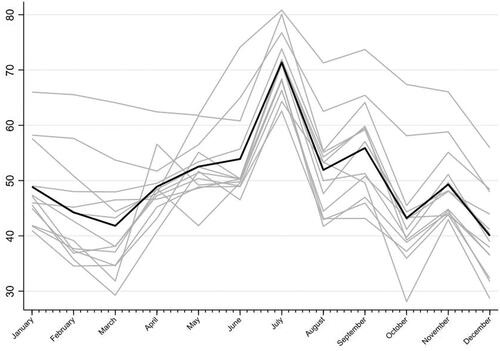
illustrates the market movement for each sample city over calendar months. Instead of looking at the number of exits from the market in each calendar month, we calculate the ratio of exit to account for the size differences between the cities. The ratio of the exit is calculated as the number of listings exiting the market between the beginning of a month and the end of a month divided by the numbers of total available listings in the respective month. As can be seen, ratio of exit tends to be higher between June and September and this pattern is observed in most cities in the sample.Footnote18 Moreover, the market in sample cities appears to be cooling down gradually in the winter season, as exit ratios become smaller in this period. This observation is mostly in line with the existing literature on sale markets, which documents the hot and cold season differences in terms of market liquidity.
Figure 1. Ratio of exit to available by months.
Note: Figure reports the exit ratio, calculated by dividing the number of listings exiting the market in a calendar month by the total number of existing listings in relevant calendar month regardless of year. Time span is the period from August 2015 to August 2017 period. Each Grey shaded line represents one of 13 cities included in the sample. The dark solid line represents the ratio for the whole sample. Figures for individual cities are presented in Online Appendix.
2.2. Time on market and rental price analyses
As we are interested in the effect of student housing demand, we first look at whether seasonality patterns in areas closer to the campuses are different from the overall seasonality patterns and how TOM and rental price change with respect to distance to the university. To do so, we grouped listings in our sample into two groups, where the first group includes properties whose distance to campus is shorter than the mid-point/median of the distribution of distance variable (distance to closest campus) that are within 3-km of a university campus, and the second group includes properties that are more than 3-km away from a campus.Footnote19
In order to see the changes in rental prices in two groups, we estimate hedonic rental indexes for each group using a two-period rolling-time-dummy rental hedonic rental price regression.Footnote20
(1)
(1)
In EquationEquation 1(1)
(1) above,
represents the weekly rental price,
represents a set of dummies for the cities where the listings are located, and
represents the size in terms of the number of bedrooms. Instead of adding a set of dummies for each month and estimating the regression for the whole sample, we estimate separate regressions in which the listings from two sequential months are included. For instance, the first regression is estimated by using listings from August 2015 and September 2015 in which listings from August 2015 serve as the base category. Then, second regression is estimated by using listings from September 2015 and October 2015 in which listings from September 2015 are used as the base category. The same procedure is applied to the every 2 months for the rest of the 24-month period. So, in EquationEquation 1
(1)
(1) ,
represents the dummy variable for the second of two sequential months. Accordingly, the coefficient
provides average rental price change with respect to the previous month after controlling for the location and size of properties.
2.3. Survival analysis
Early literature suggests looking at TOM to measure liquidity (Belkin, Hempel, and McLeavey Citation1976; HaurinCitation1988). Kluger and Miller (Citation1990) were first to suggest using the proportional hazard method to estimate a conditional probability of sale (or rent/exit in our context) to construct a measure for liquidity. Proportional hazard method is quite common in the housing literature as this method accounts for the fact that the probability of an event occurring (a sale or rent/exit) can be proportional to duration (which is time on market in our context). As it is likely that the probability of a listing to exit from the market is affected by the length of time they stay on the market, we use survival analysis. More specifically, we exploit the complementary log-log regression to estimate the probability of exiting from the market. Accordingly, the proportional hazard model specification is
(2)
(2)
where
is the baseline hazard, t is the duration in the market, X is the vector of explanatory variables, and
is a vector of unknown parameters (Taylor Citation1999).
The dependent variable of the estimation is a dummy variable, which is equal to 0 for sequential months 1,…,t-1 and equal to 1 for month t (the last month we observe the listing in the market). We estimate the baseline hazard function using a full non-parametric approach (i.e. we use full set of dummy variables instead of trend). Meyer (Citation1990) suggests that non-parametric estimating of hazard line has advantages over the semi-parametric one as the former approach provides more useful diagnostics and furthermore avoids inconsistent estimation of covariate coefficients if the baseline hazard is poorly specified. Accordingly, we create duration-interval-specific dummy variables (one for each month), which yielded 24-month dummies in total, as we have data for a 2-year period. Considering the substantial difference in the numbers of observations in each month, we categorised 24 dummies into five groups as the following: group 1= staying in the market for 1 month, group 2 = 2 months, group 3 = 3 months, group 4 = 4 or 5 months, group 5= staying more than 5 months.Footnote21 These hazard function dummies are added as explanatory variables to control for the hazard.
As we are interested in variation in liquidity in the rental market and the role of student housing, we use calendar months and year and distance to closest university as key explanatory variables. We also add weekly rental price, number of bedrooms, property type and city dummies in the regression. Finally, to control for the market size, we include the number of listings in the postcode of the listing in both the sale and rental market.
3. Results and discussion
3.1. Time on market and rental price
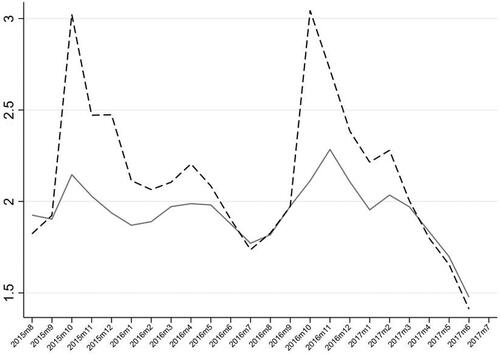
As noted earlier, studies on the housing market look at TOM and prices to analyse liquidity in the sale market. Following this approach, we examine the variation in rental prices and marketing time of the listings in our sample. shows the average TOM across time. Each point on the lines represents the average TOM for the properties that enter the market at the month/year presented on the horizontal axis. We calculate average TOM for the within 3-km and outside 3-km groups separately. Looking at the average TOM values for the latter, variation is small and moves below the value of 2 months, which is the full sample average. Small increases are observed around October and November. The results for the within 3-km sample show greater variation: the peaks around October and November are much more striking. As these two groups are categorised in terms of their relative distance to a university campus, differences in the observed patters in TOM, especially the peaks around October and November, are likely to be the result of the start of the academic term, which is September for most of the UK universities. For the within 3-km group, properties that enter the rental market right after the start of the academic term stay on the market around 1 month longer than the sample average.
Figure 2. Average time on market (in months).
Note: represents time on market. Each point on the line provides the average length of marketing time of the listings that come to the market in relevant month. The dashed-black line represents the listings which are within 3-km distance to a university campus. The solid grey line represents the listings which are more than 3-km away from a university campus.
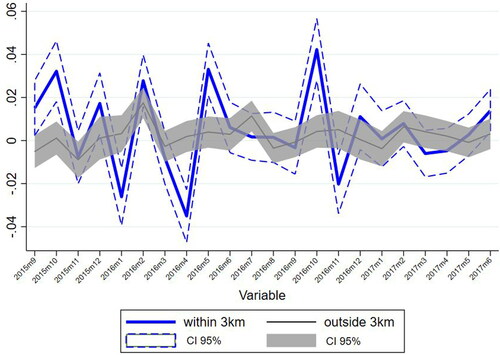
shows the coefficients of the dummy variable for months (variable ) from rolling-time-dummy regressions given in EquationEquation 1
(1)
(1) . Looking at the outside 3-km sample, there is little variation in rental prices. In fact, the rental price change is not statistically significant for most of the months. Although it is not possible to observe a clear pattern, rental price changes within the 3-km sample show significant variation. Looking at and , we can conclude that the rental market in close distance to universities is more sensitive to the start of the academic term in terms of TOM and rental prices are more volatile across time. This provides descriptive evidence that student housing demand affects seasonality patterns in the rental market.
Figure 3. Price change over time.
Note: represents the coefficients from two-period rolling-time-dummy OLS regressions. The dependent variable in the regression is log-weekly rental price. Each regression includes 2 sequential months only to capture changes in prices after controlling for size and city. For instance, in the first regression, listings that come to market in August 2015 and September 2015 are included where a dummy for September 2015 listings is added as a regressor. Second regression excludes August 2015 listings, includes October 2015 listings and accordingly a dummy for October 2015 listings is included in the regression. Same procedure is repeated for each month of the sample period. All regressions include variables to control for number of bedrooms and city of listing. Thin black line represents the listings which are more than 3-km away from a university campus. Thick blue line represents listings which are within 3-km distance to a university campus.
3.2. Survival analysis
The estimated coefficients on the duration interval dummies tell us about the shape of the baseline hazard. Smaller (more negative) values are associated with lower hazards. According to our results, the coefficients of the interval dummies become smaller, which means that the likelihood of exiting the market decreases with the length of the time a listing stays on the market. This might be due to stigmatisation. Properties that remain in the market might become stigmatised in the eyes of potential tenants who regard a long market duration as evidence of some defect (Taylor Citation1999).Footnote22
Our main object in the analysis is to understand if the start of the academic term, which is in September for most UK universities, affects the private rental market in the UK. To reach this object, we investigate if the distance to a university plays a role. More precisely, we want to know in which months distance to university becomes more important. To see how distance to university changes the probability of exiting the market for a property, we exploit two strategies: first, we estimate EquationEquation (2)(2)
(2) using a sub-sample of properties that are within 3-km distance to a university, and we compare the coefficients for the calendar months for this sub-sample to the coefficients from full sample results. Second, we amend EquationEquation 2
(2)
(2) with the inclusion of interaction variables between distance to university and dummy variables of calendar months. We perform the analysis using both a cross-sectional model of survival analysis and ‘panel data’ estimator. For the cross-sectional setting, weekly rental price and number of listings located in the same out code (first three digits of the postcode) are fixed to their value in the first month the listings enter the market.Footnote23
shows the results with a 3-km sub-sample and full sample.Footnote24 Comparing the results for the 3-km sub-sample and full sample results, we see that the sign of the coefficient for the number of bedrooms is negative for both the 3-km sub-sample and the full sample. This is an indicator that smaller properties have a greater demanded compared to large properties. Also, the coefficient for the weekly rental price is negative, which is consistent with Allen, Rutherford, and Thomson (Citation2009) who note that lower asking rents lead to shorter marketing periods. On the other hand, the coefficient for rental price should be interpreted cautiously. As Yavas and Yang (Citation1995) note while price can affect the length of time it takes to sell a property, TOM at the same time can influence the final sale price resulting from the bargain between buyer and seller. Although they focus on sale market, their conclusion probably applies to rental market as well. In this sense, this relationship should be interpreted as an association rather than a causality. The coefficient for the number of rental listings in the same out code is negative. This variable captures the size of the market as well as the competition of landlords. The negative coefficient shows that the probability of a property exiting from the market decreases if there are more competitors in the market. In the full sample, coefficient of distance to the nearest university campus is negative and significant although the magnitude is small. However, looking at the city-level results (see online appendix), we see that the coefficient for distance is positive for some cities, negative for some others. A possible explanation can come from the fact that students constitute a minority among the whole population of the cities. The rest of the population (which constitutes the majority) may have other location preferences based on the distance to other amenities (such as primary schools, parks, commercial areas) and neighbourhood effects (such as favouring certain communities or refraining students neighbourhoods). As the location of university campuses relative to other amenities varies between different cities, it is not surprising to see positive or negative coefficient for different cities and a small coefficient in the full sample.Footnote25
Table 2. Regression results- 3-km sample vs full sample (Dependent Variable: Dummy variable indicating the exit from market).
Looking at the results for the calendar month dummies for the full sample, the coefficients for the months of July and September are positive, significant, and larger in magnitude compared to the other months. Compared to the base month of January, the probability of a property to exit increases by 22 percentage points in July and by around 5 percentage points in September.Footnote26 The high increase in mid-summer, which is consistent with the high exit ratios in , possibly indicates the moving time preference of the larger demographic groups such as newlyweds or families with children as Goodman (Citation1993) suggests.
When we look at the 3-km sub-sample, we see the coefficients for September and August double in size compared to the full sample, which is a sign that distance to university changes the probability of exiting the market of a property in particular months.Footnote27 Compared to the full sample results, the probability of exit in August increases to 7 percentage points in the 3-km sub-sample. Similarly, the probability of exit in September is rises to 10 percentage points. To explore this effect further, we adopt a second strategy in which we include interaction terms between calendar months and distance to the closest university.
The results in show that the interaction term between distance to the closest university and the dummy for the month of September has the largest negative coefficient among all interaction terms, which is followed by August.Footnote28 This means that distance to university most decreases the probability of exiting the market in September and the month before. This is evidence that the start of the academic term has a significant effect on the UK rental market. This effect is particularly visible in the residential areas that are close to the university campuses.Footnote29
Table 3. Regression results, interaction effects (Dependent Variable: Dummy variable indicating the exit from market).
4. Conclusion
This paper explores the seasonality in the UK rental housing markets. Using a rich dataset from Zoopla.com, we test whether the probability of exiting the market increases during the months corresponding to the beginning of an academic year. To achieve this aim, we employ survival analysis approach with non-parametric hazard rate.
The descriptive analysis of the paper shows that the rental market appears to be characterized by the same hot season and cold season behaviour observed in the sale market. The main results of our study point that the start of the academic term, which is mostly in September in UK universities, affects the seasonality patterns in the rental market. This effect becomes stronger when the distance to the university is taken into account. The rental markets in city zones that are further from the universities are less affected by the start of the academic term. We considered robustness checks by performing analyses in cross-sectional and panel data settings. We also showed that the results of the analyses are qualitatively similar for the pooled and city level estimations.
In the wake of the recent UK housing crisis, our paper provides an updated understanding of the sizable fluctuations in the rental markets across the major UK cities. This can be potentially useful for the analysts, investors, and policymakers. The significant effect of the student housing demand on rental housing market may indicate a demand for PBSA. In fact, a recent report shows that around 735,000 students requiring a space could not secure a bed in PBSA.Footnote30 This number corresponds to almost a third of the total number of students enrolled in the UK universities. Accordingly, our results show that there is still room for private investment in student accommodation, which has an estimated market value of around £50 billion.Footnote31
Acknowledgments
Standard disclaimer applies. We thank participants of the Royal Economic Society 2021 Annual Conference and the Fourth Workshop on Using Micro Price and Survey Data (Cardiff) for their useful comments. Talavera would like to thank the Urban Big Data Centre and University of Glasgow for making Zoopla data (Zoopla Limited, © 2018) available.
Disclosure statement
There are no relevant financial or non-financial competing interests to report. This research did not receive any specific grant from funding agencies in the public, commercial, or not-for-profit sectors.
Data statement
Our data were collected using Zoopla API service. Unfortunately, we cannot make our dataset public as the terms of use of the API (as of 2018) will be violated. Current terms (as of 2021) do not allow storing the data (https://developer.zoopla.co.uk/API_terms_of_use). A researcher who would like to replicate our study might consider applying for an alternative source of Zoopla data (e.g. through Urban Big Data Centre https://www.ubdc.ac.uk/). However, all Stata and Python codes available upon request from authors.
Notes
1 Early examples of the literature suggest using TOM as a measure for liquidity in which TOM refers to the length of time a property stays on the market since its first advertisement. While in the sale market, this refers to the time between a house is listed and it is sold, in the rental market context, it corresponds to the time between a house is listed and it is rented. In this paper, following the more recent literature, we also use the conditional probability of exiting the market to measure liquidity.
2 Unfortunately, as it is common with online listing data, we cannot distinguish if a listing is actually rented or dropped from the market. Hence, we do not use the term “rented” throughout the paper and use the term “exit” to refer the event of a rental listing removed from the market.
3 There is also an increasing trend in the number of acceptances to UK universities which increased from 589,000 in 2008 to 696,000 in 2018. See https://www.hesa.ac.uk/data-and-analysis/students/whos-in-he, accessed: 1 September 2021.
4 See for instance: https://www.theguardian.com/education/2015/aug/15/soaring-student-rents-college-accommodation-crisis, accessed: 1 September 2021.
5 In this paper, we use the term “property” to refer to residential properties including all types of buildings such as houses and flats.
6 The number of students in the UK HEI in 2017/2018 was recorded as 2.3 million (around 1.8 million were full-time). The number of available PBSA beds in 2007 was over 600,000. See https://www.cushmanwakefield.com/en/united-kingdom/insights/uk-student-accommodation-report, accessed: 1 September 2021.
7 Ngai and Tenreyro (Citation2014) provided evidence for this phenomenon from the US and the UK. Goodman (Citation1993) argued that newlyweds and parents of school-age children tended to move in the summer, others with no specific reason were also motivated to move during the summer to benefit from a better chance of optimal match and lower search costs.
8 For instance, Díaz and Jerez (Citation2009) found a negative correlation between market tightness and house prices. Carrillo et al. (Citation2015) showed that considering market tightness can significantly reduce home price appreciation forecast errors.
9 For instance, Thomschke (Citation2015) analysed rental prices in Berlin using data from online platforms.
10 The share of flats increases in the areas closer to universities (flats constitute 48% within 3km range) while share of houses surpasses flats in the areas which are farther from campuses (outside the 3km range 45% of properties are houses). A possible explanation could be the population density in these areas. Residential areas which are closer to the campuses are likely to be more densely populated and scarcity of land leads to more apartment type developments.
11 Zoopla Limited. Economic and Social Research Council. Zoopla Property Data [data collection]. University of Glasgow – Urban Big Data Centre.
12 During two year of data collection period, we collected data by scanning Zoopla through API every week. In this period some gap weeks occurred as a result of technical problems. These gaps are completed by using data from Urban Big Data Centre which became available after we stopped collecting data.
13 The value of the index of private housing rental prices percentage change over 12 months was 1.8% for Great Britain (excluding London) for the first month that we include in our sample. The same index value was 2% for the last month. Accordingly, the period of interest does not include an extreme change in the rental prices. For more details see
https://tinyurl.com/ynr5xwy3, accessed: 1 September 2021.
14 The weekly rent represents the asking price listed on Zoopla.com. The Zoopla API does not provide any information about agreed price.
15 See Table A1 in online appendix for the number of observations per city.
16 The average weekly rent for the outside 3-km range is £142.
17 It is also argued that the negative relationship between time on market and prices can be due to reverse causality (Hayunga and Pace Citation2019).
18 The dark solid line represents the ratio for the whole sample while the grey lines represent cities. Figures for the individual cities are presented on Figures A1 in online appendix.
19 The median value for the distance variable is 2.8 km which is rounded to 3 km.
20 Although rolling time dummy hedonic price index is a conventional method for house prices (Sayag et al., Citation2022; Hill and Radoslaw Citation2020), it can be used for any product. See De Haan and Krsinich (Citation2018) for an application on consumer electronics.
21 Most of the houses (95%) stay on the market less than 6 months.
22 We do not report the coefficients for the duration dummies for the sake of brevity. Results are available from authors on request.
23 This restriction is chosen for consistency in the cross-sectional setting. Less than 10% of our listings include a change in asked rent during the marketing time. When this restriction is removed, estimated coefficients remained qualitatively the same changing at the third decimal point only.
24 The results of cross-sectional and panel settings are qualitatively similar. Therefore, we interpret the results of the cross-sectional setting only.
25 For universities which had spread out departments throughout the city we used the GPS coordinates for the main address.
26 Marginal effects are presented on Table A9 in the online appendix.
27 A proportion of students, especially second- and third-year students, tend to secure their accommodation in advance. Since this process is likely to be gradual it is not possible to quantify their effect on rental market. On the other hand, nearly half of the first-year students and quarter of second- and third-year students does not secure their accommodation before August. For details see https://tinyurl.com/yab3guqw, accessed 1 September 2021.
28 The first two columns in Table 3 present results from the cross-sectional setting while the last two provide results from panel data setting. Interactions (on columns 2 and 4) present the coefficients of the interaction terms between calendar months and the minimum distance variable. Direct effect (on columns 1 and 3) refers to the calendar month coefficients obtained after controlling for interactions. The same set of control variables as in Table 2 are included to interaction model.
29 In order to check the results at city level, we repeated the estimations for each of the 13 cities in our sample. The results were qualitatively similar for the majority of the cities. See Online Appendix for city subsamples.
30 See https://www.cushmanwakefield.com/en/united-kingdom/insights/uk-student-accommodation-report, accessed: 1 September 2021
31 See https://tinyurl.com/y7dc54l2, accessed 1 September 2021.
References
- Allen, M. T., R. C. Rutherford, and T. A. Thomson. 2009. Residential Asking Rents and Time on the Market. The Journal of Real Estate Finance and Economics 38 (4): 351–365. doi:https://doi.org/10.1007/s11146-007-9092-0.
- Belkin, J., D. J. Hempel, and D. W. McLeavey. 1976. An Empirical Study of Time on Market Using Multidimensional Segmentation of Housing Markets. Real Estate Economics 4 (2): 57–75. doi:https://doi.org/10.1111/1540-6229.00156.
- Brastow, R. T., B. D. Waller, and S. A. Wentland. 2018. Temporally Dynamic Externalities and Real Estate Liquidity. Journal of Real Estate Research 40 (2): 199–240. doi:https://doi.org/10.1080/10835547.2018.12091498.
- Cajias, M., and P. Freudenreich. 2018. Exploring the Determinants of Liquidity with Big Data–Market Heterogeneity in German Markets. Journal of Property Investment & Finance 36 (1): 3–18. doi:https://doi.org/10.1108/JPIF-01-2017-0006.
- Cajias, M., F. Fuerstb, and S. Bienertc. 2016. Are Energy Efficiency Ratings Ignored in the German Housing Market? Evidence from a Large-Sample Hedonic Study. ” SSRN Electronic Journal. doi:https://doi.org/10.2139/ssrn.2799206
- Carrillo, P. E., E. R. de Wit, and W. Larson. 2015. Can Tightness in the Housing Market Help Predict Subsequent Home Price Appreciation? Evidence from the United States and The Netherlands. Real Estate Economics 43 (3): 609–651. doi:https://doi.org/10.1111/1540-6229.12082.
- Carrillo, P. E., and J. C. Pope. 2012. Are Homes Hot or Cold Potatoes? The Distribution of Marketing Time in the Housing Market. Regional Science and Urban Economics 42 (1-2): 189–197. doi:https://doi.org/10.1016/j.regsciurbeco.2011.08.010.
- Dachis, B., G. Duranton, and M. A. Turner. 2012. The Effects of Land Transfer Taxes on Real Estate Markets: Evidence from a Natural Experiment in Toronto. Journal of Economic Geography 12 (2): 327–354. doi:https://doi.org/10.1093/jeg/lbr007.
- De Haan, J., and F. Krsinich. 2018. Time Dummy Hedonic and Quality‐Adjusted Unit Value Indexes: Do They Really Differ? Review of Income and Wealth 64 (4): 757–776. doi:https://doi.org/10.1111/roiw.12304.
- Dehring, C., and N. Dunse. 2006. Housing Density and the Effect of Proximity to Public Open Space in Aberdeen, Scotland. Real Estate Economics 34 (4): 553–566. doi:https://doi.org/10.1111/j.1540-6229.2006.00178.x.
- Díaz, A., and B. Jerez. 2009. House Prices, Sales and Time on the Market: A Search-Theoretic Framework. Working Paper 09-25 Economic Series, Departamento de Economía, Universidad Carlos III de Madrid.
- Espey, M., and H. Lopez. 2000. The Impact of Airport Noise and Proximity on Residential Property Values. Growth and Change 31 (3): 408–419. doi:https://doi.org/10.1111/0017-4815.00135.
- Eubank, A. A., Jr., and C. F. Sirmans. 1979. The Price Adjustment Mechanism for Rental Housing in the United States. The Quarterly Journal of Economics 93 (1): 163–168. doi:https://doi.org/10.2307/1882606.
- Goodman, J. 1993. A Housing Market Matching Model of the Seasonality in Geographic Mobility. Journal of Real Estate Research 8 (1): 117–137. doi:https://doi.org/10.1080/10835547.1993.12090696.
- Haurin, D. 1988. The Duration of Marketing Time of Residential Housing. Real Estate Economics 16 (4): 396–410. doi:https://doi.org/10.1111/1540-6229.00463.
- Haurin, D. R., J. L. Haurin, T. Nadauld, and A. Sanders. 2010. List Prices, Sale Prices and Marketing Time: An Application to US Housing Markets. Real Estate Economics 38 (4): 659–685. doi:https://doi.org/10.1111/j.1540-6229.2010.00279.x.
- Hayunga, D. K., and R. K. Pace. 2019. The Impact of Tom on Prices in the US Housing Market. The Journal of Real Estate Finance and Economics 58 (3): 335–365. doi:https://doi.org/10.1007/s11146-018-9657-0.
- Head, A., and H. Lloyd-Ellis. 2012. Housing Liquidity, Mobility, and the Labour Market. The Review of Economic Studies 79 (4): 1559–1589. doi:https://doi.org/10.1093/restud/rds004.
- Hendershott, P. H. 1995. Real Effective Rent Determination: Evidence from the Sydney Office Market. Journal of Property Research 12 (2): 127–135. doi:https://doi.org/10.1080/09599919508724136.
- Hess, D. B., and T. M. Almeida. 2007. Impact of Proximity to Light Rail Rapid Transit on Station-Area Property Values in Buffalo, New York. Urban Studies 44 (5-6): 1041–1068. doi:https://doi.org/10.1080/00420980701256005.
- Hill, R., and T. Radoslaw. 2020. Strategic House Price Indexes for Warsaw: An Evaluation of Competing Methods. Graz Economics Papers 2020-08, University of Graz, Department of Economics. https://ideas.repec.org/p/grz/wpaper/2020-08.html.
- Kalra, R., and K. Chan. 1994. Censored Sample Bias, Macroeconomic Factors, and Time on Market of Residential Housing. Journal of Real Estate Research 9 (2): 253–262. doi:https://doi.org/10.1080/10835547.1994.12090750.
- Khezr, P. 2015. Time on the Market and Price Change: The Case of Sydney Housing Market. Applied Economics 47 (5): 485–498. doi:https://doi.org/10.1080/00036846.2014.972549.
- Kluger, B. D., and N. G. Miller. 1990. Measuring Residential Real Estate Liquidity. Real Estate Economics 18 (2): 145–159. doi:https://doi.org/10.1111/1540-6229.00514.
- Kopczuk, W., and D. Munroe. 2015. Mansion Tax: The Effect of Transfer Taxes on the Residential Real Estate Market. American Economic Journal: economic Policy 7 (2): 214–257. doi:https://doi.org/10.1257/pol.20130361.
- Levitt, S. D., and C. Syverson. 2008. Market Distortions When Agents Are Better Informed: The Value of Information in Real Estate Transactions. Review of Economics and Statistics 90 (4): 599–611. doi:https://doi.org/10.1162/rest.90.4.599.
- Lin, Z., and K. D. Vandell. 2007. Illiquidity and Pricing Biases in the Real Estate Market. Real Estate Economics 35 (3): 291–330. doi:https://doi.org/10.1111/j.1540-6229.2007.00191.x.
- Meyer, B. 1990. Unemployment Insurance and Unemployment Spells. Econometrica 58 (4): 757–782. doi:https://doi.org/10.2307/2938349.
- Nelson, A. C., J. Généreux, and M. Généreux. 1992. Price Effects of Landfills on House Values. Land Economics 68 (4): 359–365. doi:https://doi.org/10.2307/3146693.
- Ngai, L. R., and S. Tenreyro. 2014. Hot and Cold Seasons in the Housing Market. American Economic Review 104 (12): 3991–4026. doi:https://doi.org/10.1257/aer.104.12.3991.
- Novy-Marx, R. 2009. Hot and Cold Markets. Real Estate Economics 37 (1): 1–22. doi:https://doi.org/10.1111/j.1540-6229.2009.00232.x.
- Ogur, J. D. 1973. Higher Education and Housing: The Impact of Colleges and Universities on Local Rental Housing Markets. American Journal of Economics and Sociology 32 (4): 387–394. doi:https://doi.org/10.1111/j.1536-7150.1973.tb02434.x.
- Rivas, R., D. Patil, V. Hristidis, J. R. Barr, and N. Srinivasan. 2019. The Impact of Colleges and Hospitals to Local Real Estate Markets. Journal of Big Data 6 (1). doi:https://doi.org/10.1186/s40537-019-0174-7.
- Ruf, D. 2017. Agglomeration Effects and Liquidity Gradients in Local Rental Housing Markets. Working Papers on Finance 1702. University of St. Gallen, School of Finance. https://ideas.repec.org/p/usg/sfwpfi/201702.html
- Rugg, J., J. Ford, and R. Burrows. 2004. Housing Advantage? The Role of Student Renting in the Constitution of Housing Biographies in the United Kingdom. Journal of Youth Studies 7 (1): 19–34. doi:https://doi.org/10.1080/1367626042000209930.
- Sayag, D., D. Ben-Hur, and D. Pfeffermann. 2022. Reducing Revisions in Hedonic House Price Indices by the Use of Nowcasts. International Journal of Forecasting 38 (1): 253–266. doi:https://doi.org/10.1016/j.ijforecast.2021.04.008.
- Singh, R. 2019. Seismic Risk and House Prices: Evidence from Earthquake Fault Zoning. Regional Science and Urban Economics 75: 187–209. doi:https://doi.org/10.1016/j.regsciurbeco.2019.02.001.
- Taylor, C. 1999. Time-on-the-Market as a Sign of Quality. Review of Economic Studies 66 (3): 555–578. doi:https://doi.org/10.1111/1467-937X.00098.
- Taylor, M. P. 1999. Survival of the Fittest? An Analysis of Self‐Employment Duration in Britain. The Economic Journal 109 (454): 140–155. doi:https://doi.org/10.1111/1468-0297.00422.
- Thomschke, L. 2015. Changes in the Distribution of Rental Prices in Berlin. Regional Science and Urban Economics 51: 88–100. doi:https://doi.org/10.1016/j.regsciurbeco.2015.01.001.
- Yavas, A., and S. Yang. 1995. The Strategic Role of Listing Price in Marketing Real Estate: theory and Evidence. Real Estate Economics 23 (3): 347–368. doi:https://doi.org/10.1111/1540-6229.00668.
- Zolnik, E. 2020. A Longitudinal Analysis of the Effect of Public Rail Infrastructure on Proximate Residential Property Transactions. Urban Studies 57 (8): 1620–1641. doi:https://doi.org/10.1177/0042098019836564.