
 ?Mathematical formulae have been encoded as MathML and are displayed in this HTML version using MathJax in order to improve their display. Uncheck the box to turn MathJax off. This feature requires Javascript. Click on a formula to zoom.
Abstract
Overall, chicken consumption has increased substantially in recent decades due to farming and processing intensification as well as the consumer perception of its benefits. Although organic chicken is perceived to taste better, support higher animal welfare and have benefits for the environment, it is unclear to what extent the organic attribute in chicken carries a premium in the eyes of consumers. The purpose of this paper is to estimate this robustly. This is done by estimating a hedonic pricing model using a comprehensive dataset. The model’s endogeneity is corrected using consumer characteristics as instruments. When making this correction, the value of the organic attribute is two to five times larger than without it (depending on the estimation method used). This leads to an average premium in relation to conventional chicken of 135% for the organic attribute in chicken.
1. Introduction
There has been a significant increase in the breeding and consumption of chickens globally. According to the Organisation for Economic Co-operation and Development (OECD 2017), global consumption of chicken has grown by 134% since 1990. Chicken appears to be the most consumed meat in the world at this point, and this also applies to the UK. While consumption of beef, lamb and pork per capita in the UK has decreased over the last 40 years, the consumption of chicken has steadily increased (as in the Appendix shows). The rise in chicken consumption has driven significant attention among consumers, producers and suppliers and has also been reflected widely in the media (BBC Citation2018; The Guardian, Citation2018; The Economist Citation2019, The Grocer Citation2023, Citation2024).
As in the case of conventional chicken, organic sales have also increased in the UK, especially since COVID-19. Despite the economic crisis caused by the pandemic, the UK organic market surpassed the £2.5bn sales mark in 2020, achieving more than 50% growth (in value) in a decade.Footnote1 The organic approach to food production is thought to add better taste, more environmentally friendly production and better animal welfareFootnote2 to the perceived benefits of conventional chicken. In this respect, it could be considered a more sustainable alternative in the eyes of consumers. This is important because there is increasing interest in environmentally sustainable production worldwide and in the UK.Footnote3 However, despite the apparent advantages, it is unclear how much consumers in the UK are willing to pay for organic products.
This paper uses a large scanner dataset (Kantar Worldpanel) containing more than 300,000 chicken purchases from over 25,000 representative households in the UK. The purchases were made across all regions, relevant supermarkets and shopping outlets in the UK and present a comprehensive picture of UK consumer behaviour. The methodology applied for data analysis employs a hedonic pricing model correcting for endogeneity using household characteristics as instrumental variables. To the best of our knowledge, all the studies related to chicken meat that are mentioned in the literature review below have not corrected for endogeneity. This correction is important due to the well-known endogeneity problems inherent to the model derived from various sources such as omitted variables bias, measurement errors, the simultaneity of demand and supply functions and nonlinearities in the price function (Rosen Citation1974; Follain and Jimenez Citation1985; Bishop and Timmins Citation2011). The key finding of the present study is that when making this correction, the value of the organic attribute is two to five times larger than without it, leading to an average premium in relation to conventional chicken of 135% for the organic attribute.
The paper makes three main contributions to the literature, as follows. It makes an empirical contribution by using a hedonic pricing method with instrumental variables derived from household characteristics to obtain a more reliable willingness to pay (WTP) estimate for organic chicken that is better suited to developing policy implications. It makes a theoretical contribution, adding the correction for endogeneity to the literature on hedonic price analysis; this is usually ignored despite the well-known problems with the method. Finally, it makes a managerial contribution, offering an analysis that holds significant relevance to various stakeholders in the chicken industry.
The estimation of an organic premium is essential for the production and marketing decisions of existing and potential organic poultry farmers and for retail pricing. Our results also offer insights into the premia heterogeneity when considering different chicken parts, retailers and regions in the UK. The results could be used to support and encourage organic chicken production for regions/products that have a higher WTP.
Finally, the paper more broadly comprises analysis of the determinants of chicken prices that integrate and address the potential shortcomings of other hedonic price analyses in the same market or even across different potential markets. By this, the paper makes a more comprehensive and critical contribution to the field as it underscores unique insights into the complexities of price determination in the poultry industry.
The paper is structured as follows: section 2 presents a summary of the relevant literature; section 3 describes the data and the method used; section 4 presents the empirical results; and section 5 concludes with a discussion.
2. Previous work on organic premiums for meat
The following literature review aims to delineate clear trends in premiums paid for organic meat observed in different studies, highlighting the discrepancies in findings and discussing the identified shortcomings in the existing literature and the way the present study will address these.
below presents a non-exhaustive list of existing studies analysing the organic premium for meat and meat products. It focuses on studies published after 2010 to maintain actuality and summarise the most up-to-date results notwithstanding the importance of studies published before this time. Even though the premiums for organic meat differ widely among countries, consumer segments, product types/categories and distribution channels, some common trends could be identified.
Table 1. Studies analysing organic price premiums for meat.
The first trend that can be derived from is that the number of studies from developed countries is much larger than the number of studies from developing countries. The latter, however, appears to be increasing over time, probably given increasing data availability and research expertise. What the studies from developing countries also reveal is that the organic premiums appear to be on average significantly lower in developing countries than in developed ones (Sriwaranun et al. Citation2015; Jaramillo Villanueva, Vargas López, and Guerrero Rodríguez Citation2015; Sarma and Raha Citation2016). This might be expected given the lower purchasing power of people in developing countries. Even if interest in organic products has increased in these countries, the ability of the consumers to cope with higher premiums derived from higher production costs might be limited. More studies could have been added from developing countries, but we limited the review to articles whose empirical data allowed for the relevant use of established econometric tools.
A second trend evident from the list above is that there are significantly more studies using stated preferences (SP) than revealed preferences (RP) techniques. This is also expected given that stated preference data is cheaper, easier to obtain and fully under the control of the researcher and given that the number of SP studies is larger than the number of RP studies in general. Only three studies on the list above use revealed datasets and only two employ a similar methodology to the one in the present study (Schulz, Schroeder, and White Citation2012; Staudigel and Trubnikov, Citation2022). Gschwandtner (Citation2018) uses both SP and RP data but with a lower number of observations than the present case. Therefore, only the two studies using a similar method are directly comparable to the present one. However, these two studies do not control for endogeneity, a common problem encountered in the hedonic pricing regression.
A third trend observable in the table above is that in general, except the studies from developing countries, the WTP a premium for organic meat, appears to be increasing over time. There are differences between the studies from different countries, but there seems to be an increasing trend in the WTP, which is in line with the increasing interest in more ethical and sustainable food production in countries that can also afford to pay the higher price for it. For example, while the premium that consumers in the US were willing to pay for organic chicken breast didn’t appear to exceed 15% in 2007 (Gifford and Bernard Citation2011), this seems to increase to over 70% by 2009 (Van Loo et al. Citation2011) and almost 200% by 2020 (Dennis Citation2020). Even if these studies do not always employ the same methodology or use the same dataset, they do seem to suggest an increasing trend in the WTP of consumers for organic meat in the developed world.Footnote4
A fourth trend that becomes obvious from the table above is that, even though they are less numerous, the studies that used RP data usually have a much larger number of observations than the ones using SP data. Except for Van Loo et al. (Citation2011), the average number of observations in SP data is around 200, whilst for RP the number is typically one or two digits larger. One reason for this is that whilst SP data usually reports the number of respondents surveyed and hence each observation is a consumer/household, RP data typically reports the number of purchases, which are more numerous per consumer/household. Another reason is probably because whilst SP data is often collected individually by the researchers, RP data is mostly bought from companies that collect these data systematically from supermarkets and individuals that register to regularly scan all their shopping. These firms then sell the data, often at very high prices (e.g. AC Nielsen, Kantar Worldpanel and Dunnhumby). The higher price of these RP datasets might be another reason why studies using them are rather rare.
A general trend found in other studies is that the estimated premium using SP data is larger than the premium using RP data (e.g. Li and Kallas Citation2021). The reason for this is that consumers often overstate their WTP in a hypothetical situation and revealed data is more accurate. Indeed, hypothetical bias is arguably the strongest criticism of SP studies and the papers that compare SP with RP often find that SP estimates are two to three times larger than RP estimates, although some find a somewhat lower SP/RP ratio (Murphy et al. Citation2005). Despite the fact that this trend cannot necessarily confirm the list above, it is observable that only three of the SP studies mentioned employ a treatment for hypothetical bias (Van Loo et al. Citation2011, Citation2014; Zanoli et al. Citation2013).Footnote5 This is a serious concern as Gschwandtner (Citation2018) finds that consumers in the UK state they are willing to pay a premium of 15% for organic products (including meat) but in reality they pay just 9%. Gschwandtner and Burton (Citation2020) also control for hypothetical bias using three different treatments and show that hypothetical bias treatment appears to be necessary, especially in the case of organic products and for meat products where consumers feel good about overstating their true WTP. The authors find that when using treatments for hypothetical bias, the estimated WTP for the organic and other related attributes is significantly reduced. In their meta-analysis regarding drivers of WTP for organic food, Katt and Meixner (Citation2020) find that one of the most prominently studied variables is “environmental concern”, which has been found in most of the research to have a significant effect on the stated WTP for organic food (Cicia, Del Giudice, and Ramunno Citation2009; Gifford and Bernard Citation2011; Krystallis, Fotopoulos, and Zotos Citation2006; Sriwaranun et al. Citation2015). However, when analysing the factors that actually drive consumption, studies reveal that more personal reasons such as perceived better health and taste are the main determinants (Verhoef Citation2005; Wier, Andersen, and Millock Citation2005; Wier et al. Citation2008; Aertsens et al. Citation2009; Gschwandtner Citation2018). Therefore, there seems to be a gap between what people state they would do in a hypothetical situation and how they behave in a real consumption situation, and this gap appears to be especially large in the case of organic meat products where in addition to environmental concerns consumers state that they are concerned with animal welfare (Bartels and Onwezen Citation2014; Carlsson, Frykblom, and Lagerkvist Citation2007; Lagerkvist and Hess Citation2011). The fact that there are only three identified studies controlling for hypothetical bias when estimating the premium for organic meat appears a significant shortcoming of the existing literature.
This paper contributes by estimating the WTP of UK consumers using an extensive revealed preference dataset, which avoids hypothetical bias. It also uses the hedonic pricing method corrected for endogeneity, something that to our knowledge none of the RP studies have done before. Making this correction is essential due to the well-known problems derived from omitted variables bias, potential measurement errors, nonlinearity of the price function and simultaneous estimation of supply and demand function in the hedonic pricing model (Rosen Citation1974; Follain and Jimenez Citation1985; Bishop and Timmins Citation2011). Whilst the main contribution of this paper is the estimation of the WTP for organic chicken and not the correction for endogeneity, we believe this correction is essential for obtaining a more robust estimate than has been previously obtained in the literature and this is important for making relevant policy recommendations.
3. Data Description and method
This section describes the Kantar Worldpanel dataset, which is a comprehensive panel-scanner dataset containing a significant number of available variables that are expected to explain the price variation. We are working with data representative of British purchases (Northern Ireland data are not collected) and use all the recorded transactions for 2016.
3.1. Chicken purchase data
The sample contains 336,970 chicken purchases from 26,658 UK representative households in 2016. The paper explores up to 40 variables containing product characteristics (chicken part, price, volume, packing, labelling, etc.), store information (e.g. retailer name, location) and socio-economic characteristics of the households to investigate the heterogeneity across regions, education level, class, etc. shows the descriptive statistics for some socio-economic characteristics. For representativeness, these should be compared to those of the usual chicken buyer, rather than the average characteristics of the UK population.
Table 2. Sample socioeconomic description.
The average age of the household member responsible for the grocery shopping in the sample is 49 years old, 78% of whom are female. Households have on average one child and a gross income within category 4 (£30,000 to £39,999 per annum), above the national average income in 2016 (£26,300).
Family structures amongst households are evenly distributed, but the highest proportion of households (18.6%) are “empty-nest” − 45-65 years old with no children in the household, and the smallest number (10.2%) are “pre-family” – below 45 years old with no children.
The regional distribution of households is as follows: north (25.6%), south (24.7%), Midlands (17.3%), east (11%), London (8.9%), Scotland (7.5%) and Wales (4.6%). Thus, above half of the chicken sold in the country addresses the demand in the north and south regions. Overall, these figures reflect the regional population distribution in the UK, but they are not the same. However, we should not expect the socio-economic distribution to match the national numbers precisely as the data only includes households from the panel that bought chicken at least once in 2016.
The dataset has entries from 35 different retailers across the country. shows the distribution of chicken purchases by retailers in the UK. The sample indicates that approximately 23% of chicken purchases in 2016 were made from Tesco, the UK's largest grocery retailer. This is significantly larger than the second-ranked Aldi, which has 15% of the market. The fact that Aldi ranks second and sells more broiler chicken than Asda, Sainsbury’s and Morrisons might be surprising as these shops have substantially higher market shares in the UK. However, Aldi is renowned for its value for money and especially for the good taste of its meat.
Figure 1. Chicken purchases distribution by retailer (%).
Source: Own elaboration based on Kantar Worldpanel data.
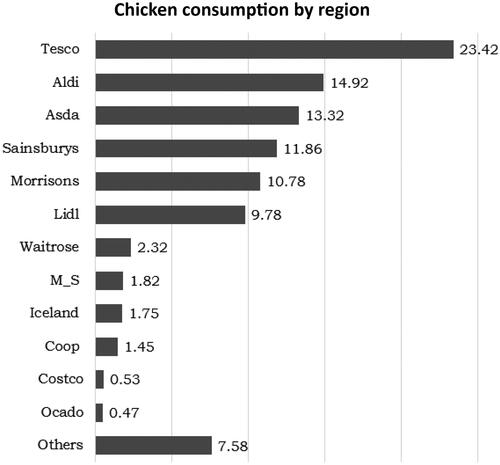
The overall distribution in differs somewhat from the market shares of the supermarkets for all regions and all products in 2016, which were respectively Tesco (28.3%), Sainsbury’s (16.8%), Asda (15.6%), Morrisons (10.9%), Aldi (6%), The Cooperative (6%), Waitrose (5.3%), Lidl (4.4) and Iceland (2.3%) according to Kantar Worldpanel (Citation2018), which contains just entries of chicken purchases and reflects consumers’ shopping preferences in relation to chicken where Aldi is a favourite. compares the consumption of conventional versus organic chicken by region.Footnote6
Figure 2. Chicken consumption by region.
Source: Own elaboration based on Kantar Worldpanel household (HH) data.
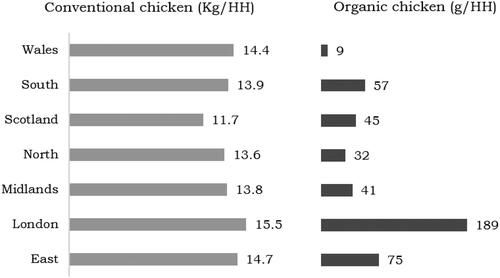
While the consumption of conventional chicken in general appears relatively similar across regions, the largest amount of organic chicken by far is consumed in London. The region that consumes the least organic chicken is Wales. The consumption of organic chicken in London is 21 times the consumption in Wales. This should not be interpreted, however, as purely driven by consumer preferences or affordability, but also by availability of supply, which would require further investigation.
More detailed information about the chicken purchase data and the organic chicken market is given in the results section and the Appendix.
3.2. Estimation method
The hedonic price model (HPM) is one of the most popular revealed preference approaches to environmental valuation. It is widely used to estimate the added value of housing attributes, e.g. environmental amenities, but has also been applied to the food industry, including dairy produce and eggs (Kolodinsky Citation2008; Griffith and Nesheim Citation2010; Schollenberg Citation2012; Gschwandtner Citation2018 and many others). The method is derived from consumer theory, based on the assumption that a consumer’s need for a good or service is driven by the attributes associated with it (e.g. Lancaster Citation1966; Garrod et al. Citation1999). The theoretical framework of the hedonic method was proposed by Rosen (Citation1974), who applied his model to a commodity with many characteristics; this has been regularly applied since then due to its simple empirical implementation.
However, while it is widely used, the method’s econometric issues are often ignored, notably the simultaneity problems derived either from the supply and demand equilibrium or marginal price and quantity of attributes. The latter is associated with the non-linear characteristics of the price function, as illustrated by Follain and Jimenez (Citation1985), Wooldridge (Citation1996), Bishop and Timmins (Citation2011) and others. Endogeneity caused by omitted variables or potential measurement errors is also ignored. If, for example, important variables that dampen the effect of organic, such as availability, are omitted, or if the organic label is missing/unclear or measured in error, the effect of the organic attribute on price might be underestimated.
3.2.1. Hedonic price regression
The hedonic pricing model has been widely applied in environmental valuation applications due to its simplicity and clarity. The basic equation in Rosen’s (Citation1974) model is a price regression derived from the profit maximisation of producers and utility maximisation of consumers. In this equation, price is a function of its attributes z.
However, consumer characteristics are usually not taken into consideration in the main hedonic model. Consumers are also assumed to be price-takers and their characteristics should not be able to change the price available to them in most cases. In our case, the vector z contains product characteristics such as chicken part, organic and retailer and includes dummies for special offer (γi) and region (ηr). Therefore, the household maximises utility by choosing a product with price p explained by:
(1)
(1)
where i, r, s, and t are, respectively, item, region, store and time and ε is the error term. Thus, δ varies with time, γ varies with the item and time, η with region, and z is specific to each item and store. The vector of characteristics allows us to calculate utility by considering all the information given, rather than looking at things one at a time.
The appropriate functional form for the hedonic method depends on the nature of the data used in the study. The predominant form used in the literature is the log-linear, but double-log is also used as it facilitates the interpretation of results (Martínez-Garmendia Citation2010; Kim and Chung Citation2011). Given that all explanatory variables are dichotomous, this study uses a semi-log function. The functional form will be applied in an OLS setting in the first stage of the two-stage least squares (2SLS) and in the generalised method of moments (GMM) estimations. The last two attempt to address the endogeneity problems addressed above using socio-economic characteristics as instruments. Wooldridge (Citation1996) demonstrates that OLS and 2/3SLS are inefficient for hedonic models with measurement errors and omitted variables (one of the main issues addressed in this paper), showing that HPM would not fall into any situations in which 3SLS is asymptotically efficient. Hence, he suggests that the generalised method of moments (GMM) should be used to estimate the parameters in the hedonic price system as it is efficient and no more difficult to compute than 3SLS. Cameron and Trivedi (Citation2005) also demonstrate that GMM is more efficient than 2SLS/3SLS at addressing the identified endogeneity and non-linear functions underlying the hedonic price system. GMM also performs better when the model is over-identified and under heteroskedasticity, a common problem in the revealed data, especially when estimating system equations (Arellano and Bond, Citation1991). Therefore, GMM estimation is the main approach used here due to its ability to address both endogeneity and heteroskedasticity and it is the main source of the results discussion.
The extended version of the model in Equationequation (1)(1)
(1) using GMM can be expressed as:
(2)
(2)
where, in addition to the variables previously described, “Organic” represents the organic label, “FreedomFood” represents the label for freedom food, reflecting high animal welfare, “Offer” denotes any type of promotion, and “Branded” and “BudgetLabel” indicate external and own low-price labels respectively. “Quality” indicates products advertised as having superior quality (e.g. Tesco Finest, Asda Extra Special, etc.), “Halal” indicates halal chicken, and “Healthy” denotes the presence of a health label. From the remaining five types of dummy variables included in the model, “ChickenPart” indicates the part sold (or whole chicken), “Size” indicates the package weight, “Retailer” the shop/supermarket (of 13 main companies), “Region” denotes the UK region and “Month” represents the monthly dummies.
The exponential GMM format is widely used in applied work as an alternative to linear regressions when the dependent variable uses log-transformed values. This avoids transformations from the original format for predicted values (Baum, Schaffer, and Stillman Citation2003). The instrumental variable approach used here also helps with endogeneity derived from omitted variables and potential measurement errors as described above.
3.2.2. Choice of instruments
In the hedonic price literature, there are a few applications of the instrumental variables approach to estimate coefficients of attributes of interest, but not for organic chicken. For example, Follain and Jimenez (Citation1983) use instruments to predict values of household income and household size, hence consumer characteristics, to estimate the demand for housing characteristics. Bishop and Timmins (Citation2011) use demographic characteristics, the race and income of house-buyers as instruments to estimate the WTP to avoid an incident of violent crime in San Francisco. Gopalakrishnan et al. (Citation2011) use spatial varying coastal geological features as an instrument to estimate the amenity value of beach width to coastal properties in a 2SLS estimation. All these studies reveal a significant effect from the instrumental variables, despite the different issues addressed. The present paper uses the socio-economic characteristics of households as instruments to treat the organic characteristic of chicken meat as the variable of interest. For the socio-economic characteristics to be valid instruments, they must be both exogenous and relevant to the choice of the treated attribute.
Several studies confirm that socio-economic characteristics are relevant to organic food consumption, i.e. socio-economic characteristics drive the WTP for organic food. Griffith and Nesheim (Citation2010) explore heterogeneity WTP for organic products across different family structures; Costanigro, Kroll, and Thilmany (Citation2012), Gschwandtner (Citation2018), Yue, Alfnes, and Jensen (Citation2009) and Wong et al. (Citation2010) are just a few among the many studies that show the contribution of individuals’ characteristics such income, age, gender, level of education, family structure, employment status, etc. to organic food consumption.
The Kantar Worldpanel dataset used in this study offers some household characteristics that are potentially exogenous to the price equation while being relevant to preference for organic consumption. Of these, various have been tested as potential instruments and variables derived from family structure related to the age of children; for example, pre-family (dummy for a young couple with no children), young family (dummy for a family with the youngest child aged below 5 years old) and middle-family (dummy for a family with the youngest child aged between 5 and 9 years old) are suitable instruments. Studies show that the number of adults and the number and age of the children in the household can have a strong impact on organic consumption (Maguire, Owens, and Simon Citation2004; Tiffin and Arnoult Citation2010).
The first stage regressions (OLS and Probit) are used to test the impact of consumers’ characteristics on the choice of organic chicken. (Appendix) shows the results for the first stage estimation and indicates that the socio-economic characteristics are relevant (p > 0.01) individually and in combination.Footnote7 provide insights into the income effect on the demand for organic chicken, indicating a 6.2% increase in the probability of choosing organic with each level of income rise. However, income also demonstrates a significantly higher correlation with price, as observed in the comparison of the two OLS results, making it an unsuitable instrument. Nevertheless, income does not exhibit a stronger correlation with price and organic choice than with family structures, suggesting the potential use of the latter as a proxy for income to mitigate potential effects from income elasticity of demand for organic chicken.
Using the model in (see Appendix), we cannot reject the null that the coefficients of excluded household variables equal zero. However, individually, when using the main model in the results (OLS), we would reject the null if YoungFamily is excluded, but not if PreFamily, MiddleFamily and OlderFamily are excluded. Thus, these household variables would pass the test, regardless of the model, with or without other socioeconomic variables, and are used as instruments in the main regression.Footnote8 Nonetheless, in a more conservative approach, the final regression models use fixed effects for shops, regions and parts. Further tests for the validity of the used instruments are shown in section 4.3.
4. Results
4.1. Descriptive statistics of the variables used in the regressions
shows the descriptive statistics for the variables used in Equationequation 2(2)
(2) , including the main product characteristics (z) and dummies for promotion, region and shop. On average, consumers paid £4.71 per kilogram of chicken meat. More than 45% of the items were on some type of offer, and 25.2% were budget labels (retailer’s own low-cost items). Chicken breast is the most popular, forming 48.8% of the observations, and half-chicken and wings are the least popular chicken parts. Only 1% of the chicken sold was from a brand other than the retailer’s own, and only 0.6% had an organic or Freedom Food label. Very few products (0.2%) had a “Halal” label and almost no products had a “Healthy” label. Tesco, the supermarket with the largest market share, has the most chicken purchases, and the north and the south are the regions with the largest amount of chicken sales in the UK.
Table 3. Descriptive statistics: main product attributes.
A thorough description of the chicken market in the UK can be found in the Appendix.
4.2. Regression results
Most hedonic price studies involve OLS regressions, as discussed. However, due to the endogeneity problems mentioned, OLS leads to a biased and inconsistent estimate of parameters. For this reason, instruments derived from family structures (PreFamily and MiddleFamily) are used as instruments in the 2SLS (mainly for comparison) and GMM estimations. Their validity is discussed in subsection 4.3 below. In all models we use the semi-log functional form. shows the regression results from the OLS, 2SLS and GMM estimations using fixed effects for parts, regions and shops.Footnote9 The dependent variable is the natural log of the price paid per kilogram of chicken. The R-squared values for the OLS and 2SLS are high (84% and 68% respectively), which indicates that the regressors can explain most variation in the (logged) price of chicken. Given that the dependent variables in the OLS and 2SLS are logged transformation of price per kilogram and the main attributes are dummies, the interpretation of the coefficients in the log-linear OLS function, following the price change when a given dummy variable equals one, is expressed as ∂p/∂z = exp(β) −1. The results show that the coefficient of “Organic” in the 2SLS model is substantially higher than the OLS estimates (above five times). The organic coefficient in the 2SLS is also substantially higher than the GMM estimates. As explained, GMM estimations are considered the most reliable to effectively address the endogeneity and heteroskedasticity issues encountered in HPM estimations (Wooldridge Citation1996). Nonetheless, the only other significant difference between 2SLS and GMM results is with regard to the parameters for “The Black Farmer”, with 2SLS reporting a coefficient significantly larger than from the GMM, in absolute terms. For GMM, as the model uses the exponential form of the explanatory variables and the dependent variable is log-transformed, the interpretation of the coefficients is straightforward and represents the marginal effect of the respective variable, i.e. these indicate the price change when the attribute increases by one unit or equals one for dummies. Therefore, the estimations for the marginal implicit prices (MIP) are given by: MIP = [∂p(z)/∂z] x where
is the sample mean price paid per kilogram of chicken (£4.71). The MIPs are presented in the second to last column of the table. The last column presents the premiums in percentages compared to the average price per kilogram.
Table 4. Regression results.
The GMM estimation indicates that for UK consumers the implicit marginal price for the organic attribute per kilogram, holding all other factors constant, is £6.40 (135.5%), for freedom food £1.86 (39.5%), for quality £1.60 (34%), and for halal £0.77 (16.3%) in the 2016 values. The implicit price consumers pay for branded chicken products is £0.13 (2.8%) per kilogram, while the budget label gives a discount of £0.43 (9.1%). The coefficient for the “Healthy” variable is not significant in any of the regression models. This is probably related to the way this variable is defined in Kantar and would need another variable to elicit the contribution of this important attribute. Compared with “Other” chicken parts, the breast has an implicit marginal price of £2.38 (50.5%), the highest added value amongst the parts, as expected. The other parts with positive implicit prices are half chicken (£1.03 = 21.9%) and thigh (£0.34 = 7.2%), while all others have a negative marginal effect, whole chicken being associated with the lowest premium (-£1.54 = −32.7%).
The implicit marginal price increases as package weight decreases; smaller packages (<400 g) increase the MIP by £0.93 (19.7%) compared to packs larger than 3 kg, while “Offers” on average only contribute to a decrease of £0.07 (1.5%) per kilogram of chicken. This indicates that, at least for chicken, offers are mainly retailers’ marketing strategy to influence shopping behaviour through their discount perception, rather than a significant price reduction.
Unlike the descriptive section, which shows the average price paid for each product characteristic across sellers, the marginal implicit prices show how much individuals would pay for the shopping experience at that specific supplier, with all other attributes held constant. As an illustration, despite its relatively high average price, The Black Farmer has the lowest implicit marginal price (-£2.80/kg = −59.4%), probably because of its specialisation; therefore, the higher price is driven by other variables, most notably “Organic”. M&S (-£0.64 = −13.6%) and Iceland (-£0.52 = 11%) are associated with the lowest implicit prices. Costco (£0.62 = 13.2%) and Waitrose (£0.49 = 10.4%) have the highest implicit prices, followed by Coop (£0.41 = 8.7%) and Ocado (£0.27 = 5.7%).
Although statistically significant, there appears to be no large variation in marginal implicit prices across regions, and therefore price differences in this case are mostly driven by product differentiation. Using London as a baseline, all regions are associated with a positive effect on willingness to pay. Consumers in the south pay the highest implicit price, followed by consumers in the north. Further heterogeneity is explored in section 4.4.
4.3. Instrumental variable tests
shows the results from statistical tests of the instruments following the 2SLS and the GMM estimations. For the endogeneity test of the organic attribute, this study applies the Wu-Hausman, the Durbin-Wu-Hausman and the C difference-in-Sargan endogeneity test for the 2SLSL and GMM estimations respectively. With 99% confidence, we can reject the null that “Organic” is exogenous, thereby justifying the use of instrumental variables in the models. The adjusted R2 from the first-stage regression indicates the squared partial correlation between the endogenous regressor and the instruments only, which is usually low. further shows the Angrist-Pischke F-test for the validity of the instruments. This test shows when one endogenous variable (as only “Organic” is treated) is weakly identified in the presence of multiple endogenous variables (which is possible for this study). The test statistic indicates that the instruments are valid, with F-statistics substantially above the threshold of 10 (35.67).
Table 5. Instrument validity (Pre-family and Middle-family)Footnote10.
also shows Wooldridge’s test statistic for over-identification, given that the IV regression uses robust estimations. This is required due to heteroscedasticity, a common problem in hedonic price regressions. The Hansen’s J test is the alternative for the GMM estimation. Over-identification occurs when the number of additional instruments (conditional to at least one exogenous instrument) exceeds the number of endogenous variables. The test determines whether the instruments are uncorrelated with the error term. A significant test statistic indicates invalid instruments or model misspecification. The results indicate that the instruments pass the test in all models, hence we can reject the null of over-identification and cannot reject that the instruments are valid.Footnote11
4.4. Heterogeneity
Analysing the heterogeneity of the WTP is not only important for robustness but also because not all consumers have the same preferences, and because it is important to identify when consumers are willing to pay the highest/lowest organic premium. In general, the results are presented for the average consumer, but this consumer might not exist. Highlighting the heterogeneity in the results is very important for policy, supporting policymakers to make informed decisions. In the present study, heterogeneity across regions, retailers and chicken parts is identified through a series of regressions. In the GMM estimation, the socioeconomic characteristics include measured and unmeasured heterogeneity and shocks on preferences of households, which should cause variation in WTP. Spatial units (regions in the case of this study) must also be defined exogenously to rely on analysis of the variations across space (Helbich et al. Citation2014). The same applies to chicken parts, which are therefore treated as different products. The literature explores various sources of heterogeneity in organic price premiums across different products and countries. Griffith and Nesheim (Citation2010), for example, who apply a log-linear model to all grocery products in a basket of goods, reveal a large amount of WTP heterogeneity across organic products in the UK ranging from approximately −50% to 140%. Heterogeneity in chicken parts, regions and retailers is explored in this section by comparing GMM with OLS results in , and (Appendix). For consistency, the same variables are used as regressors when analysing consumption per chicken part and region. Similar to the main model, the variables derived from family structures are used as instruments. However, segmentation implies that different instruments need to be used across sub-samples. For regions, “Pre-family”, “Young-family”, “Middle-family”, and “Number of Adults” were used based on the strongest F-statistics ().Footnote12 For chicken parts, “Older-family” was used as the instrument in almost all models, except chicken legs, for which the strongest instrument proves to be “Young-family” ().
Across regions, consumers in the north and east regions pay the highest premium for the organic attribute (above 150%), while households in Scotland pay only 35%. Price premiums for the attribute “Freedom Food” do not appear to vary significantly between regions (ranging from 27% to 43%), as there appears no substantial variation in the premiums for the attribute “Quality”.Footnote13 The latter is explained by the fact that most observations containing the quality attribute are associated with the retailer’s brand label, which should be consistent in most parts of the country. Consumers also seem to pay a higher premium for the attribute “Halal” in the east and west. The marginal implicit price of the “Budget Label” has the largest negative effect in Scotland but values are relatively consistent between regions. The results also reveal that the marginal implicit values of the retailers vary across the country. The retailer marginal effect on price in London is the lowest for Aldi, Lidl and M&S. The marginal effect is relatively higher in Scotland for Waitrose; in the Midlands Morrisons and Waitrose have the highest implicit prices, and in the north, the main retailers have similar marginal implicit prices, apart from M&S, which is associated with a negative value. In contrast, log-linear OLS results show lower variation in the implicit values of the organic attribute across regions, ranging from 87% in Scotland to 120% in London.
Heterogeneity involving chicken parts confirms that the marginal effects of attributes do vary with the parts, as shown in .Footnote14 The organic attribute has the highest marginal effect on all chicken parts, varying from 126% for legs to 298% for whole chicken. This indicates that consumers place lower aggregated value on the organic attribute when associated with chicken parts, i.e. higher marginal value for organic chicken suppliers when the chicken is not cut into pieces, all other factors being equal. The “Freedom Food” certification has the highest value for consumers of chicken breast and whole chicken (35% and 82% respectively).
Counterintuitively, the attribute “Quality” has a negative effect on drumsticks, despite its positive and significant high implicit value for all other chicken parts. Branded items have a mixed average effect, but there is an indication that consumers prefer thighs and whole chicken associated with the retailer’s label. As expected, “Budget Label” has a negative and significant effect on implicit values, except breast and whole chicken. The “Healthy” attribute was only available for chicken breast and is positive as expected with a marginal effect of 13%, but this should be interpreted with care as only a few products carried this label. Consumers seem to place the highest value of the “Halal” attribute on thighs and legs, at 37% and 11% respectively. Marginal implicit prices for the organic attribute of chicken parts range from 57% for thighs to 136% for the whole chicken. These results are particularly relevant to retailers and their respective market strategies. Most importantly, however, the GMM results for regions and chicken parts confirm that OLS is likely to underestimate the marginal implicit prices of the organic attribute.
Building on the insights gained from , offers a more elaborate examination of the varied pricing strategies employed by retailers across different chicken parts.Footnote15 It shows the regression results from interaction terms between chicken parts and retailers and reveals notable divergences in pricing strategies among retailers, illuminating specific trends and patterns. For example, despite boasting some of the lowest average prices for various chicken products, retailers such as Aldi, Iceland and Lidl exhibit significantly higher premiums for chicken breast. In contrast, retailers like Ocado and Waitrose, while comparatively more expensive overall, offer competitive pricing for half and whole chickens, suggesting a competitive landscape. Tesco appears to gain a competitive edge in selling drumsticks, while Morrisons follows a similar pattern, with certain chicken parts associated with relatively higher MIP, despite low price differentiation across items.
On the higher end of the average price spectrum, M&S adopts a differentiated pricing strategy, which is particularly evident in its pricing of chicken legs and drumsticks. This retailer positions chicken breast and thighs as relatively high premium parts, most likely due to their demand inelasticity, with significant price discrepancies compared to competitors. Similarly, Waitrose positions these parts, along with half-chickens, as premium products commanding higher price points. In essence, demonstrates the nature of retailer pricing strategies within the chicken market, highlighting the approaches adopted by retailers to appeal to diverse consumer segments based on the elasticities of the product, in line with third-degree differentiation. This insight contributes to a deeper understanding of the retail pricing dynamics and underlines the importance of considering product-specific pricing strategies in retail analysis.
Beyond heterogeneity, an in-sample prediction is performed as a second type of robustness check. Unfortunately, we do not have data for years other than 2016 and cannot perform an out-of-sample prediction and compare our predictions with actual data from later periods. However, what we could do is hold out a subset from the existing data, make predictions based on this and compare it with the actual results obtained. We have divided the data into two randomly assigned subsets (110,046 observations each), applied the model to sample 1, and predicted the price for sample 2. We obtain a result for the organic coefficient 1.346 (0.111) *** which is very close to the one in above: 1.361 (0.104) *** for the GMM estimations.Footnote16
The third type of robustness check we perform is related to outliers. To exclude outliers relating to price and weight we also run the same main regressions as in excluding retailers with less than 50 observations. The results are very similar and the organic coefficient is 1.354 (0.105) ***. We conclude that the results are consistent.Footnote17
5. Conclusions
The purpose of this paper is to estimate the willingness to pay (WTP) for the organic attribute of chicken in the United Kingdom in a robust manner.
We show that when correcting for endogeneity the value of the organic attribute is two to five times larger than without correction, leading to a price premium in relation to the conventional chicken of price of 135%, (totalling £6.36 per kilogram) for the organic attribute in chicken meat. This result is in line with the results obtained by Griffith and Nesheim (Citation2010) who also apply hedonic price models to 2004 scanner data in the UK and estimate a WTP premium of 125% for fresh organic meat and vegetables compared to conventional meat, but with no insight into chicken meat.
The results show that not only does the organic attribute contribute substantially to the implicit marginal price of chicken across all types of chicken meat but that it contributes more than in past estimates, where the average of the premiums found for organic chicken is usually smaller (although not always). As the previous studies did not correct for endogeneity, we believe there might have been an underestimation of this attribute. Beyond the methodological contribution, this paper also provides organic estimates that are more relevant to food policy decisions.
The results suggest that in the current context of food inflation retailers should perhaps not be too concerned about the increases in the price of organic chicken and they might not need to ask producers to cut their prices; consumers appear to be willing to pay higher prices for organic chicken.
Another contribution of our study is in showing a large heterogeneity in the value consumers place on the organic attribute by region, retailer and chicken part. We show that there are large differences across the UK, which implies that if UK policymakers want to implement a single policy to promote organic products across the country it might not be successful. Hartley (Citation1996) discusses the problems arising from the assumption of a “representative agent” and ignoring heterogeneity. The results for this agent will not necessarily explain the aggregate data. “Representative agents conceal heterogeneity away”, which can be misleading, especially in policy decisions. Our results show that the regions in the UK that have the highest WTP for the organic attribute in chicken meat are the north and the south-east, whilst the midlands has the lowest, and we reveal that in some areas retailers have more leeway to increase their price for organic chicken than in others. Regarding chicken parts, our results reveal that the highest WTP is for whole chicken, breast and thighs, and the lowest is for drumsticks. The results for chicken part and retailer interactions reveal varied pricing strategies, with some retailers offering lower average prices but charging higher premiums for specific parts like chicken breast, while others competitively price half and whole chicken. Differentiated pricing reflects consumer segment appeal and product elasticities, demonstrating retail pricing dynamics.Footnote18
A reliable estimate of the marginal value of the organic attribute is a necessary first step for an accurate cost-benefit analysis of any policy decision related to organic products. This is especially important not only when related to meat where animal welfare aspects need to be further considered but also at present in the UK when organic chicken sales are constantly increasing (especially since the pandemic) and since Brexit as the agricultural policy is in the process of being reformed. Hence, the present paper is relevant to various stakeholders, such as organic producers, retailers, consumers and food policymakers in the UK.
Although the results are for the UK, they have more generality as the UK is similar to other European countries and the methodology applied here, using consumer characteristics as instruments in a hedonic pricing setting, can be applied to similar data from around the world to obtain more robust WTP estimates for various food attributes. It is important to underline that the method used in the present paper and the insights derived from it are not only applicable to the chicken market but also extend to other markets, providing a versatile and robust framework for further research.
The results point to the need to use instrumental variables to obtain a more robust understanding of consumer preferences for the organic attribute in chicken meat. Without instruments, the consumers’ willingness to pay for this attribute would be severely underestimated. Given the increasing demand for organic products since the pandemic, the present results are also expected to hold beyond 2016, the year of the data used for this research, and the estimated relative premiums from 2016 are expected to be still valid today. Therefore, the present paper contributes unique insights into the complexities of price determination in the poultry market that hold beyond the period of analysis.
| Nomenclature | ||
| z(z1,…, zn) | = | vector of product characteristics |
| p(z) | = | marginal price of z |
| xh | = | characteristics related to consumers and suppliers |
| s | = | error term |
| u | = | utility function |
| x | = | unit price composite commodity |
| y | = | income |
| α | = | taste parameter |
| ω | = | willingness to pay for characteristic zi |
| φ | = | willingness to accept (of firms) |
| π | = | profit |
| β | = | factor price and production parameter |
| σ | = | utility derived from an organic/conventional product |
| xh | = | household characteristics |
| n | = | organic vs conventional product |
| γi | = | dummies for special offer |
| ηr | = | dummies for the region |
| R2 | = | R-squared (measure for the goodness of fit) |
Disclosure statement
No potential conflict of interest was reported by the author(s).
Notes
1 Available at: https://www.foodnavigator.com/Article/2020/05/06/Organic-food-gets-coronavirus-boost; there is evidence, however, that this surge might have been caused by an increase in organic prices rather than in quantities bought (Revoredo-Giha and Gschwandtner, Citation2021).
2 Massey et al. (Citation2018) show in their meta-analysis that on average organic products are perceived to have a positive overall impact on individuals (especially health), the environment (soil, pollination and biodiversity protection) and animal welfare (humane farming).
3 Climate Assembly UK, Chapter 6 available at: www.climateassembly.uk/documents/88/Chapter6.pdf.
4 Which goes beyond inflation.
5 These studies use Cheap Talk, which includes a short script where respondents are warned that usually participants in surveys tend to overstate their WTP for credence attributes, such as organic, in a hypothetical situation and they are asked to behave as in a real shopping situation.
6 Note that organic consumption is represented in grams per household and not kilograms per household to make the bars more comparable.
7 Given that the choice of purchasing organic is dichotomous, Table 3 shows the results both for OLS and from a Probit regression. These add extra robustness to the relevance test, as results from the Probit estimation are more reliable in this case. The main purpose of the regression is to illustrate that the exogenous socio-economic variables are relevant to the system of equations.
8 Results using PreFamily, MiddleFamily and OlderFamily:.
F = [(R2r − R2u)/(Dfr – Dfu)]/[(1 − R2u)/Dfu] = [(0.8370 − 0.8370)/3]/[(1 − 0.8370)/336893] = 0.000.
where Dfr and Dfu are the degrees of freedom of restricted and unrestricted models (with tested instruments) respectively.
9 This analysis assumes heterogeneity across the controlled variables. To account for this, we employed fixed effects using the least squares dummy variable (LSDV) approach, ensuring that categorical variables are accurately represented and consistent with the GMM method. Choosing any categorical variable as the fixed effect option (in an xtreg regression in Stata) yields identical coefficients for the regressors, as elaborated in Torres-Reyna (Citation2007).
10 The first stage results are a post-estimation of the main model, thus including all endogenous and exogenous variables.
11 In principle, consumers (and their characteristics) could impact the price they pay by choosing a specific retailer/region. This is why we have run the estimations with retailer/region fixed effects.
12 Consistent with the discussion in section 3.3.3 and Tiffin and Arnoult (Citation2010), ‘Adults’ was statistically significant but omitted in Tables 2 and 3 due to collinearity.
13 In the exponential GMM Ln model the coefficients are equivalent to the marginal effect, thus the MIP (no need for transformation) and premiums are calculated with respect to the average price of £4.71.
14 Half chicken is not included in the table as there is no organic entry for the attribute in the sample.
15 Table 15 shows results from the OLS model with interaction terms as the GMM exponential model with interaction variables would not converge for the full data. Due to perfect multicollinearity, some interactions were also dropped, e.g. data from The Black Farmer only relates to chicken legs.
16 Our thanks to an anonymous referee for this suggestion.
17 The results can be obtained from the authors upon request.
18 Our thanks to an anonymous referee for suggesting this insightful analysis.
19 Having the highest average price in the top 1% (23.87).
References
- Aertsens, J., W. Verbeke, K. Mondelaers, and G. Van Huylenbroeck. 2009. “Personal Determinants of Organic Food Consumption: A Review.” British Food Journal 111 (10): 1140–1167. https://doi.org/10.1108/00070700910992961.
- Arellano, M., and S. Bond. 1991. “Some Tests of Specification for Panel Data: Monte Carlo Evidence and an Application to Employment Equations.” The Review of Economic Studies 58 (2): 277–297. https://doi.org/10.2307/2297968.
- Bartels, J., and M. C. Onwezen. 2014. “Consumers’ Willingness to Buy Products with Environmental and Ethical Claims: The Roles of Social Representations and Social Identity.” International Journal of Consumer Studies 38 (1): 82–89. https://doi.org/10.1111/ijcs.12067.
- Baum, C. F., M. E. Schaffer, and S. Stillman. 2003. “Instrumental Variables and GMM: Estimation and Testing.” The Stata Journal: Promoting Communications on Statistics and Stata 3 (1): 1–31. https://doi.org/10.1177/1536867X0300300101.
- BBC 2018. “Planet of the Chickens : How the Bird Took over the World.” Accessed February 26, 2024 . https://www.bbc.co.uk/news/science-environment-46506184.
- Bishop, K. C., and C. Timmins. 2011. “Hedonic Prices and Implicit Markets: Estimating Marginal Willingness to Pay for Differentiated Products without Instrumental Variables. ” Technical Report, National Bureau of Economic Research. Accessed February 26, 2024 . https://www.nber.org/system/files/working_papers/w17611/w17611.pdf
- Cameron, A. C., and P. K. Trivedi. 2005. Microeconometrics: Methods and Applications. Cambridge University Press.
- Carlsson, F., P. Frykblom, and C. J. Lagerkvist. 2007. “Consumer Willingness to Pay for Farm Animal Welfare: Mobile Abattoirs versus Transportation to Slaughter.” European Review of Agricultural Economics 34 (3): 321–344. https://doi.org/10.1093/erae/jbm025.
- Chicken mega-farms are how we’ll feed the UK says poultry industry head 2018. Accessed 2022-09-12. https://www.theguardian.com/environment/2018/jul/03/intensive-chicken-mega-farms-feed-uk- poultry-industry-head-richard-griffiths
- Cicia, G., T. Del Giudice, and I. Ramunno. 2009. “Environmental and Health Components in Consumer Perception of Organic Products: Estimation of Willingness to Pay.” Journal of Food Products Marketing 15 (3): 324–336. https://doi.org/10.1080/10454440902925930.
- Corsi, A., and S. Novelli. 2011. “Willingness-to-Pay in Terms of Price: An Application to Organic Beef during and after the ‘Mad Cow’ Crisis.” Review of Agricultural and Environmental Studies – Revue D'Etudes en Agriculture et Environnement 92 (1): 25–46.
- Costanigro, M., S. Kroll, and D. D. Thilmany. 2012. “Local, Organic, Conventional: Asymmetric Effects of Information and Taste on Label Preferences in an Experimental Auction.” AAEA/EAAE Food Environment Symposium, Agricultural and Applied Economics Association https://doi.org/10.22004/ag.econ.123199.
- Dennis, E. 2020. “Consumers Pay Organic Premiums: Chicken is King and Beef Lags.” University of Nebraska, Lincoln. Accessed February 24, 2024. https://beef.unl.edu/beefwatch/2020/consumers-pay-organic-premiums-%E2%80%93-chicken-king-and-beef-lags
- Follain, J. R., and E. Jimenez. 1983. “The Demand for Housing Characteristics in Developing Countries.” Urban Studies 22 (5): 421–432. https://doi.org/10.1080/00420988520080731.
- Follain, J. R., and E. Jimenez. 1985. “Estimating the Demand for Housing Characteristics: A Survey and Critique.” Regional Science and Urban Economics 15 (1): 77–107. https://doi.org/10.1016/0166-0462(85)90033-X.
- García-Torres, S., A. López-Gajardo, and F. J. Mesías. 2016. “Intensive vs. Free-Range Organic Beef. A Preference Study through Consumer Liking and Conjoint Analysis.” Meat Science 114: 114–120. https://doi.org/10.1016/j.meatsci.2015.12.019.
- Garrod, G., and K. G. Willis. 1999. Economic Valuation of the Environment. Elgar.
- Gifford, K., and J. C. Bernard. 2011. “The Effect of Information on Consumers’ Willingness to Pay for Natural and Organic Chicken.” International Journal of Consumer Studies 35 (3): 282–289. https://doi.org/10.1111/j.1470-6431.2010.00929.x.
- Gopalakrishnan, S., M. D. Smith, J. M. Slott, and A. B. Murray. 2011. “The Value of Disappearing Beaches: A Hedonic Pricing Model with Endogenous Beach Width.” Journal of Environmental Economics and Management 61 (3): 297–310. https://doi.org/10.1016/j.jeem.2010.09.003.
- Griffith, R., and L. Nesheim. 2010. “Estimating Households’ Willingness to Pay.” IFS Working Paper. Accessed February 24, 2024. https://ifs.org.uk/publications/estimating-households-willingness-pay
- Gschwandtner, A. 2018. “The Organic Food Premium: A Local Assessment in the UK.” International Journal of the Economics of Business 25 (2): 313–338. https://doi.org/10.1080/13571516.2017.1389842.
- Gschwandtner, A., and M. Burton. 2020. “Comparing Treatments to Reduce Hypothetical Bias in Choice Experiments Regarding Organic Food.” European Review of Agricultural Economics 47 (3): 1302–1337. https://doi.org/10.1093/erae/jbz047.
- Hartley, J. E. 1996. “Retrospectives: The Origins of the Representative Agent.” Journal of Economic Perspectives 10 (2): 169–177. https://doi.org/10.1257/jep.10.2.169.
- Helbich, M., W. Brunauer, E. Vaz, and P. Nijkamp. 2014. “Spatial Heterogeneity in Hedonic House Price Models: The Case of Austria.” Urban Studies 51 (2): 390–411. https://doi.org/10.1177/004209801349223.
- Jaramillo Villanueva, J. L., S. Vargas López, and J. D. D. Guerrero Rodríguez. 2015. “Behavior of Consumers and Willingness to Pay for Quality Attributes of Organic Meat Rabbit.” Revista Mexicana de Ciencias Pecuarias 6 (2): 221–232. https://doi.org/10.22319/rmcp.v6i2.4065.
- Kantar World Panel. 2018. Accessed June 06, 2024. https://www.kantar.com/uki?par=en
- Katt, F., and O. Meixner. 2020. “A Systematic Review of Drivers Influencing Consumer Willingness to Pay for Organic Food.” Trends in Food Science & Technology 100: 374–388. https://doi.org/10.1016/j.tifs.2020.04.029.
- Kim, C., and C. Chung. 2011. “Hedonic Analysis of Retail Egg Prices Using Store Scanner Data: An Application to the Korean Egg Market.” Journal of Food Distribution Research 42: 14–27. (856-2016-58004),
- Kolodinsky, J. 2008. “Affect or Information? Labelling Policy and Consumer Valuation of RBST Free and Organic Characteristics of Milk.” Food Policy. 33 (6): 616–623. https://doi.org/10.1016/j.foodpol.2008.07.002.
- Krystallis, A., C. Fotopoulos, and Y. Zotos. 2006. “Organic Consumers’ Profile and Their Willingness to Pay (WTP) for Selected Organic Food Products in Greece.” Journal of International Consumer Marketing 19 (1): 81–106. https://doi.org/10.1300/J046v19n01_05.
- Lagerkvist, C. J., and S. Hess. 2011. “A Meta-Analysis of Consumer Willingness to Pay for Farm Animal Welfare.” European Review of Agricultural Economics 38 (1): 55–78. https://doi.org/10.1093/erae/jbq043.
- Lancaster, K. J. 1966. “A New Approach to Consumer Theory.” Journal of Political Economy 74 (2): 132–157. https://doi.org/10.1086/259131.
- Li, S., and Z. Kallas. 2021. “Meta-Analysis of Consumers’ Willingness to Pay for Sustainable Food Products.” Appetite 163: 105239. https://doi.org/10.1016/j.appet.2021.105239.
- Maguire, K. B., N. Owens, and N. B. Simon. 2004. “The Price Premium for Organic Baby Food: A Hedonic Analysis.” Journal of Agricultural and Resource Economics 29 (1): 132–149.
- Martínez Michel, L., S. Anders, and W. V. Wismer. 2011. “Consumer Preferences and Willingness to Pay for Value‐Added Chicken Product Attributes.” Journal of Food Science 76 (8): S469–S477. https://doi.org/10.1111/j.1750-3841.2011.02354.x.
- Martínez-Garmendia, Josué. 2010. “Application of Hedonic Price Modelling to Consumer Packaged Goods Using Store Scanner Data.” Journal of Business Research 63 (7): 690–696. https://doi.org/10.1016/j.jbusres.2009.05.002.
- Massey, Maria, Aron O'Cass, and Petr Otahal. 2018. “A Meta-Analytic Study of the Factors Driving the Purchase of Organic Food.” Appetite 125: 418–427. https://doi.org/10.1016/j.appet.2018.02.029.
- Murphy, J., P. G. Allen, T. H. Stevens, and D. Weatherhead. 2005. “A Meta-Analysis of Hypothetical Bias in Stated Preference Valuation.” Environmental & Resource Economics 30 (3): 313–325. https://doi.org/10.1007/s10640-004-3332-z.
- OECD 2017. “Meat Consumption.” Accessed February 26, 2024. https://stats.oecd.org/index.aspx?queryid=76854
- Revoredo-Giha, C., and A. Gschwandtner. 2021. “The Market for Organic Food in the UK.” EuroChoices 20 (3): 52–53. https://doi.org/10.1111/1746-692X.12320.
- Rosen, S. 1974. “Hedonic Prices and Implicit Markets: Product Differentiation in Pure Competition.” Journal of Political Economy 82 (1): 34–55. https://doi.org/10.1086/260169.
- Sarma, P. K., and S. K. Raha. 2016. “Consumers’ Willingness to Pay for Organic Beef: Evidence from Dhaka City.” Journal of the Bangladesh Agricultural University 14 (1): 83–91. https://doi.org/10.3329/jbau.v14i1.30602.
- Schollenberg, L. 2012. “Estimating the Hedonic Price for Fair Trade Coffee in Sweden.” British Food Journal 114 (3): 428–446. https://doi.org/10.1108/00070701211213519.
- Schulz, L. L., T. C. Schroeder, and K. L. White. 2012. “Value of Beef Steak Branding: Hedonic Analysis of Retail Scanner Data.” Agricultural and Resource Economics Review 41 (2): 260–273. https://doi.org/10.1017/S1068280500003397.
- Sriwaranun, Y., C. Gan, M. Lee, and D. A. Cohen. 2015. “Consumers’ Willingness to Pay for Organic Products in Thailand.” International Journal of Social Economics 42 (5): 480–510. https://doi.org/10.1108/IJSE-09-2013-0204.
- Staudigel, M., and A. Trubnikov. 2022. “High Price Premiums as Barriers to Organic Meat Demand? A Hedonic Analysis Considering Species, Cut and Retail Outlet.” Australian Journal of Agricultural and Resource Economics 66 (2): 309–334. https://doi.org/10.1111/1467-8489.12472.
- The Economist. 2019. “How Chicken Became the Rich World’s Most Popular Meat.” Accessed December 9, 2022. https://www.economist.com/international/2019/01/19/how-chicken-became-the-rich-worlds-most-popular-meat
- The Grocer 2023. “Fresh Meat, Fish and Poultry 2023: Cost-Effective Chicken sees Huge Gains.” Accessed February 26, 2024. https://www.thegrocer.co.uk/top-products/fresh-meat-fish-and-poultry-2023-cost-effective-chicken-sees-huge-gains/686331.article
- The Grocer 2024. “Why Poultry Suppliers Need to Step up their Game in the UK Market.” Accessed February 26, 2024. https://www.thegrocer.co.uk/promotional-features/why-uk-consumers-are-seeking-quality-chicken/688379.article
- Tiffin, R., and M. Arnoult. 2010. “The Demand for a Healthy Diet: Estimating the Almost Ideal Demand System with Infrequency of Purchase.” European Review of Agricultural Economics 37 (4): 501–521. https://doi.org/10.1093/erae/jbq038.
- Torres-Reyna, O. 2007. “Panel Data Analysis Fixed and Random Effects Using Stata (v. 4.2).” Data and Statistical Services, Princeton University 112: 49.
- Van Loo, E. J., V. Caputo, R. M. Nayga, Jr, J. F. Meullenet, and S. C. Ricke. 2011. “Consumers’ Willingness to Pay for Organic Chicken Breast: Evidence from Choice Experiment.” Food Quality and Preference 22 (7): 603–613. https://doi.org/10.1016/j.foodqual.2011.02.003.
- Van Loo, E. J., V. Caputo, R. M. Nayga, Jr, and W. Verbeke. 2014. “Consumers’ Valuation of Sustainability Labels on Meat.” Food Policy 49: 137–150. https://doi.org/10.1016/j.foodpol.2014.07.002.
- Verhoef, P. C. 2005. “Explaining Purchases of Organic Meat by Dutch Consumers.” European Review of Agricultural Economics 32 (2): 245–267. https://doi.org/10.1093/eurrag/jbi008.
- Wier, M., K. O. D. Jensen, L. M. Andersen, and K. Millock. 2008. “The Character of Demand in Mature Organic Food Markets: Great Britain and Denmark Compared.” Food Policy. 33 (5): 406–421. https://doi.org/10.1016/j.foodpol.2008.01.002.
- Wier, M., L. M. Andersen, and K. Millock. 2005. Information Provision, Consumer Perceptions, and Values: In Russell, C. and Krarup, S. Environment, Information, and Consumer Behaviour, 161–178. Chelthenham: Edward Elgar Publisher.
- Wong, J., U. Raghunathan, C. L. Escalante, and K. Wolfe. 2010. “Consumer Premiums for Environmentally Friendly Grass-Fed and Organic Milk in the Southeast.” Journal of Agribusiness 28 (1): 75–88.
- Wooldridge, J. M. 1996. “Estimating Systems of Equations with Different Instruments for Different Equations.” Journal of Econometrics 74 (2): 387–405. https://doi.org/10.1016/0304-4076(95)01762-3.
- Wooldridge, J. M. 2010. Econometric Analysis of Cross Section and Panel Data. Cambridge, MA: MIT Press.
- Yue, C., F. Alfnes, and H. H. Jensen. 2009. “Discounting Spotted Apples: Investigating Consumers’ Willingness to Accept Cosmetic Damage in an Organic Product.” Journal of Agricultural and Applied Economics 41 (1): 29–46. https://doi.org/10.1017/S1074070800002534.
- Zanoli, R., R. Scarpa, F. Napolitano, E. Piasentier, S. Naspetti, and V. Bruschi. 2013. “Organic Label as an Identifier of Environmentally Related Quality: A Consumer Choice Experiment on Beef in Italy.” Renewable Agriculture and Food Systems 28 (1): 70–79. https://doi.org/10.1017/S1742170512000026.
Appendix A
Chicken market description
illustrates the number of purchases/entries by region and total expenditure, which are consistent with the representation of each region. The average price paid per kilogram of chicken is relatively consistent across regions, ranging from £4.13 in Wales to £4.32 in London. The dataset has entries from 35 different retailers across the country. The table also shows market shares in terms of expenditures by region with the highest cumulative percentage for the south-east including London (45.23%) followed by the north (25.76%).
shows the market shares of the retailers by region. For example, Tesco has 12.5% of the market share in the east and 23% in the south, whilst Aldi holds 1.7% in London but surpasses Tesco in the north with a market share of 17% (versus 15% at Tesco).
The data also allows investigation of the market for each chicken part. As indicated in , the most popular chicken part in the UK is breast, forming 48.81% of entries in the panel. Chicken breast is also associated with the highest price, costing an average of £6.67 per kilo. Wings are the cheapest part sold, costing on average only £2.23/Kg.
The main interest of this research, the market for organic chicken, is relatively more consolidated, with only eight sellers: Sainsbury’s (40.4% of entries), Waitrose (25.3%), Tesco (15.3%), Morrisons (6.4%), Marks and Spencer (M&S) (5.9%), The Black Farmer (5.8%), Ocado (0.8%) and Asda (0.1%).
below shows the average price including the bottom 1% (p1) and top 1% (p99) prices per retailer. It shows, for example, that Ocado is the most expensive on average across all price distributions, as it does not seem to sell low-priced products. The retailer only supplies thighs, which is the second most expensive chicken part. M&S, which usually is perceived as more expensive, interestingly has the lowest average price. However, almost 45% of its organic chicken sold was on offer, on average 5% cheaper than the original price (the highest discount amongst the suppliers), and most of its organic chicken sold were legs, which are associated with a relatively low price. Waitrose, the UK's “high-end supermarket”, sells the most expensive organic chicken, as expected.Footnote19
shows the average prices paid for various organic chicken parts by supermarket. M&S sells the most expensive organic whole chicken and the third most expensive organic chicken breast despite being on average the cheapest. Conventional chicken is the cheapest at Asda but the supermarket has very limited organic chicken sales, driving the average price of this product up. also shows in parentheses and in bold which chicken part is sold most by the respective retailers. For example, M&S sells mostly organic chicken legs, which is its cheapest organic chicken part and explains their overall low average price. Sainsbury’s, on the other hand, sells mostly organic chicken breast, which is the most expensive chicken part and explains its relatively high average price. Ocado sells only thighs, Asda only breast and The Black Farmer only legs in the organic range. The average cheapest organic whole chicken is sold at Waitrose, the cheapest breast at Morrisons, and the cheapest thighs at Sainsbury’s, suggesting a certain level of specialisation.
As illustrated in , organic chicken breast is the most popular and the most expensive part. This part was bought on average for £15.44 per kilogram. Note that it is generally sold in smaller packs (400 g on average), thus consumers’ lower price perception when buying might be a factor to consider. On the other hand, drumsticks and wings are the cheapest (sold only at Waitrose) and least popular chicken parts, though substantially more expensive than conventional counterparts.
and show the organic price distribution across retailers and chicken parts. suggests that Waitrose and Sainsbury’s offer the widest variety of chicken products in their stores, which is natural given their market shares, in contrast with Tesco and The Black Farmer. Ocado is not on the chart but was found to be highly consolidated, in line with , indicating only one type of organic chicken part sold by the retailer in the sample. Concerning chicken parts, breasts and thighs are the only ones associated with a wide price range. Overall, the price distribution for organic chicken is illustrated in , which shows a broad distribution, despite a relative concentration of prices at around £6 per kilogram.
Figure A1. Meat consumption in the UK (g/person/week) Source: Defra.
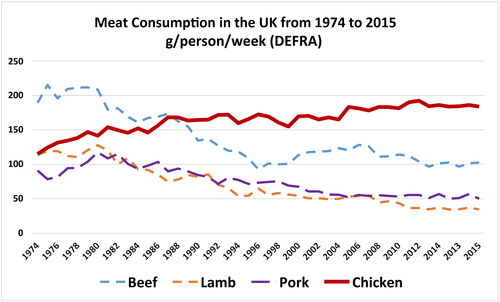
Figure A2. Price distribution: all retailers (organic chicken).
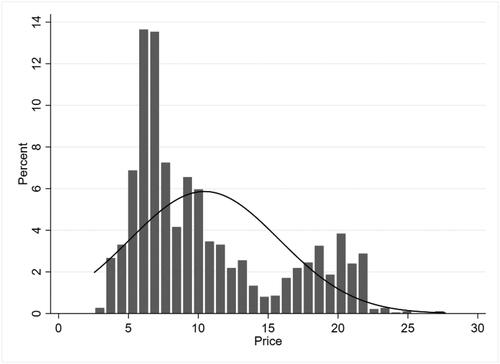
Figure A3. Price/kg distribution by retailer (organic chicken).
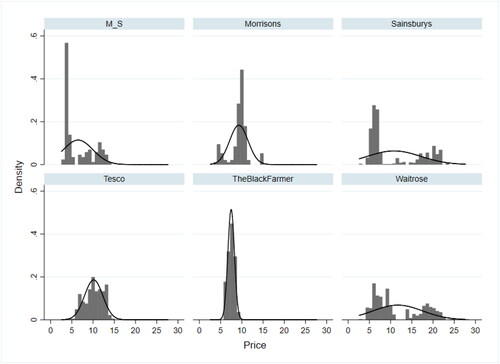
Figure A4. Price/kg distribution by part (organic chicken).
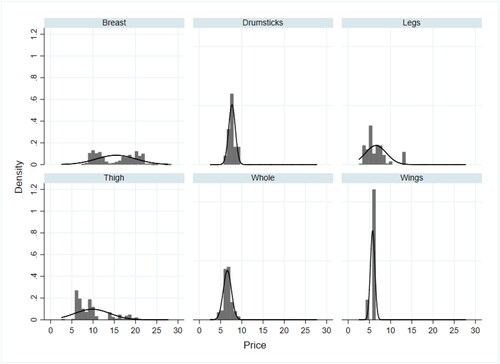
Table A1. Regression of socio-economic characteristics on the organic attribute.
Table A2. Regression of socio-economic characteristics on price.
Table A3. Chicken purchases distribution and total expenditure by region.
Table A4. Number of chicken purchases per retailer in each region.
Table A5. Sample distribution by chicken part.
Table A6. Price of organic chicken by retailer (£/Kg).
Table A7. Average retail price by organic chicken parts (£/Kg).
Table A8. Comparison: organic versus all by chicken part.
Table A9. Heterogeneity results: regions.
Table A10. Heterogeneity results: chicken parts.
Table A11. Heterogeneity results: retailers and chicken parts.