ABSTRACT
Mixed-member proportional electoral systems are characterised by having two types of members of parliament (MPs): district MPs elected directly in a district and list MPs elected via a party list. While it has been suggested that district MPs have a more prestigious and safe position than list MPs, little is known about possible differences between list and district MPs in terms of the length of their parliamentary careers. Using data on all New Zealand parliamentary elections between 1996 and 2017, the authors investigate to what extent the mode in which MPs are elected throughout their careers relates to the length of their careers. The authors’ descriptive and multivariate Cox Proportional-Hazards analyses show that those entering parliament as list MPs have shorter careers than those entering parliament as district MPs. However, when list MPs ‘move on’ to becoming district MPs during their parliamentary career, they have the longest careers of all MPs.
Introduction
An important characteristic of mixed-member proportional (MMP) electoral systems is that there are two types of members of parliament (MPs): list MPs elected via a party list (through the system of proportional representation (PR)) and district MPs elected directly by voters in their district (through a single-member district (SMD) system). While there is no constitutional difference between list and district MPs, list MPs tend to be perceived, among the public, the media, but also MPs themselves, as less successful representatives of voters and as less prestigious than district MPs (Carman & Shephard, Citation2007; Coffé, Citation2018; McLeay & Vowles, Citation2007; Patzelt, Citation1997; Shugart & Tan, Citation2016). Research has also suggested that list MPs hold less secure positions (Manow, Citation2007; Matland & Studlar, Citation2004). In SMDs where only one candidate can be chosen, selectorates (the local party organisation) may want to avoid losing the personal votes for the incumbent (e.g. Matland & Studlar, Citation2004). State or national party leaders compiling a party list, by contrast, seek to balance a range of considerations in order to broaden the list’s appeal to the country’s voters as a whole, and tend to switch the list more frequently. Consequently, legislative turnover may be lower for district MPs compared with list MPs, resulting in longer tenure for district MPs. Yet, little research has looked in detail at career trajectories of list and district MPs in MMP systems and investigated the extent to which the length of MPs’ parliamentary careers differs between list and district MPs. In addition, the limited available research examining differences in parliamentary careers of list and district MPs has focused mostly on the dichotomous distinction between list and district MPs. However, MPs who are elected as both list and district MPs throughout their career are not uncommon. Some MPs enter parliament as a list MP but are elected as a district MP later in their parliamentary career (or the other way around). Whether an MP has been continuously elected as a list or district MP or whether they have been elected in different ways throughout their careers may be linked to the length of their career. Therefore, we move beyond the basic distinction between list and district MP and ask: To what extent and how does mode of election throughout an MP’s career (district, list or a combination of list and district) relate to the length of their parliamentary career? Who gets to have long parliamentary careers is an essential question in legislative politics as the length of career is an important indicator of a successful career and relates directly to legislative and policy influence and power (Lawless & Theriault, Citation2005). If the way that MPs are elected throughout their careers is linked to career length, it would have important implications for representation outcomes and policy-making. In addition, inequalities exist in the likelihood of being elected as a district or list MP, with, for example, women and ethnic minorities being more likely to be elected as list MPs compared with men and those belonging to the ethnic majority group (e.g. Barker & Coffé, Citation2018; Coffé & Davidson-Schmich, Citation2020). Knowing to what extent and how career patterns relate to the length of MPs’ careers can shed further light on these inequalities and the political under-representation of some social groups.
We answer our question via descriptive and multivariate Cox Proportional-Hazards analyses of New Zealand MPs’ parliamentary careers between 1996 (the country’s first election held under MMP) and 2017. Our case study approach (compared with a comparative approach) allows us to keep constant a number of contextual variables that possibly influence lengths of careers (e.g. term length, political culture). In New Zealand, district MPs are elected via a plurality SMD system, whereas list MPs are elected via closed party lists which are national. The overall distribution of seats in New Zealand’s single-chamber parliament reflects each party’s share of the nationwide party list vote. However, parties must win at least 5 per cent of the party vote in order to enter the parliament unless a candidate from their party wins a district and thus seat in parliament. There are currently 71 districts, with the remaining seats in the 120-member parliament filled from party lists.Footnote1 The 71 districts include seven seats reserved for indigenous Māori.Footnote2
Data and measurements
To examine the career patterns of MPs in New Zealand’s MMP system, we created a dataset of the 346 MPs elected since the first election under MMP in 1996 until 2017 (eight elections).Footnote3 Besides MPs’ mode of election (district vs. list) in each election, data were collected along a range of dimensions known to influence political careers and the likelihood of being elected as a list or district MP (Barker & Coffé, Citation2018; Coffé & Davidson-Schmich, Citation2020; Praino & Stockemer, Citation2018): gender, age at first election, ethnic background, party affiliation and safety of district seat or list position. in the appendix introduces more details about the operationalisation of each variable. in the appendix provides an overview of the background characteristics of all MPs included in the analyses broken down by the MPs’ career pattern.Footnote4
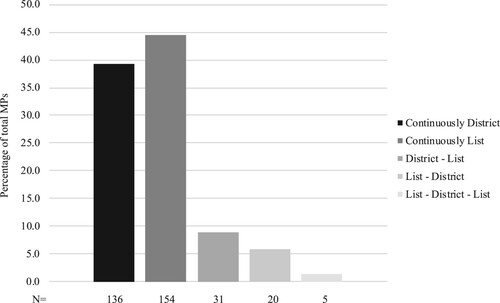
As can be seen from , of all 346 MPs elected in the New Zealand parliament between 1996 and 2017, the vast majority (83.8 per cent) were always elected in the same way throughout their careers (thus always as list or always as district MP).Footnote5 MPs who are continuously list MPs throughout their career is the largest group of MPs (44.5 per cent), followed by MPs who are continuously district MPs (39.3 per cent). Fourteen per cent of the MPs were elected both as list and district MP throughout their careers. The group of MPs entering parliament as a district MP to become a list MP later in their career is the largest group of MPs with a ‘mixed’ (list/district) career.
Figure 1. Career pattern in percentages of total number of MPs.
Analyses
Moving on to answering our research question and investigating to what extent the modes in which MPs are elected throughout their careers relate to the length of their careers, we present three analyses: two descriptive analyses (including a Kaplan–Meier plot) and one multivariate analysis (Cox Proportional-Hazards model).
Descriptive analysis
describes the average number of terms for each type of career pattern.
Figure 2. Average number of terms by career pattern (with 95 per cent confidence intervals) (N = 346).
Note: L: List, D: District.
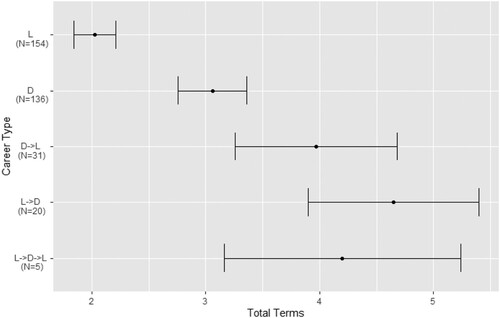
As can be seen from , significant differences occur in lengths of careers between different career trajectories.Footnote6 The F-test also reveals a significant link between career pattern and number of terms (F = 23.708, p < 2.2 × 10⁻¹⁶). Continuously list MPs have the shortest careers (two terms on average) and distinguish themselves significantly in terms of length of career from all other types of career. Those who combine different modes of election have the longest careers in parliament, with those who enter first as a list MP but become a district MP later in their parliamentary career having the average highest number of terms in parliament (4.65 terms on average). Not shown in but interesting to note is that for MPs who are elected as both list and district MP throughout their career, the second part of their careers tends to be the longest on average. Those who are elected first as a list MP and later as a district MP have an average of 1.5 terms as a list MP followed by 3.2 terms as a district MP. Those who are elected first as a district MP and later as a list MP have on average 1.8 terms as district and 2.2 terms as list MP. The average length of the parliamentary experience as district MP is thus longer among those elected first as a list MP compared with those elected first as a district MP.
Kaplan–Meier estimation
To investigate further the link between career pattern and length of career, we create a Kaplan–Meier plot to examine whether the probability of survival is different for the five career patterns. In contrast to the above descriptive analysis, the Kaplan–Meier plot allows us to account for censoring. Censoring occurs when the event one is modelling, in this case leaving parliament, does not occur within the timespan of the data. As we have data up to the 52nd parliament, anyone who is (re-)elected to said parliament will be censored as we cannot know when their tenure will end. The Kaplan–Meier plot compares all MPs’ careers in parallel and calculates after each term in parliament the proportion of MPs that gets re-elected out of the total MPs who were in parliament the previous term. This gives an estimate of the probability of an MP’s career lasting at least so many terms, which is also known as the ‘survival function’.
The Kaplan–Meier plot () reveals that those elected first as list and later as district MPs have the longest careers and have the highest probability of surviving to an eighth term. Their likelihood of surviving is also higher compared with those elected first as district and then as list MPs, in particular until the fifth term, when the likelihood of surviving decreases more significantly for those with a List → District career pattern compared with those with a District → List career pattern. Those who are elected as list MPs throughout their entire career have the shortest careers. They have only a 62 per cent chance of surviving to a second term and a 39 per cent chance of surviving to a third term.
Figure 3. The survival of MPs in the New Zealand parliament (1996–2017) by career pattern.
Note: L: List, D: District.
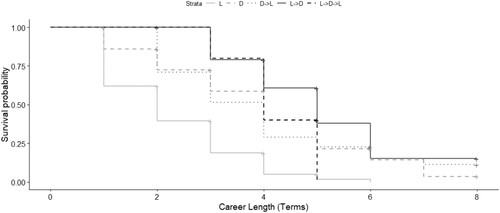
The Kaplan–Meier plot thus further suggests that being a list MP leads to a shorter career, at least if an MP is not able later in their parliamentary career to become elected as a district MP. To what extent then does entering the parliament as a list or district MP relate to an MP’s length of career? The Kaplan–Meier plot presented in introduces the survival rate of MPs according to their MP type at parliamentary entry.
Figure 4. The survival of MPs in the New Zealand parliament (1996–2017) by career start.
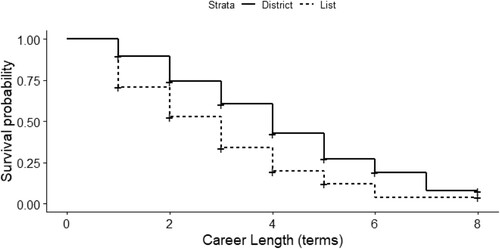
As can be seen from , starting as a list MP significantly decreases one’s survival probability overall. Those elected as a list MP when entering parliament have a 71 per cent chance of surviving to a second term compared with a 90 per cent chance for those entering as district MPs. Interestingly though, conditional upon surviving to a second term, the survival probabilities (ie the height of each step in ) for further terms are similar for those who start as list and those starting as district MPs.
Cox Proportional-Hazards model
Finally, we fit a multivariate Cox Proportional-Hazards model, which is a specific type of event history or survival analysis (Stel et al., Citation2011). In particular, we estimate the link between career patterns and the hazard rate, which is the rate of MPs not being re-elected. A higher hazard at a particular time thus suggests that a person is more likely not to be re-elected at that time. Contrary to the descriptive analyses presented above, the more sophisticated Cox Proportional-Hazards model allows us to control for factors known to relate to lengths of political careers as well as the likelihood of being elected as a list or district MP, such as gender, age at first election, ethnic background and party affiliation (eg Barker & Coffé, Citation2018; Coffé & Davidson-Schmich, Citation2020; Praino & Stockemer, Citation2018). As such, it provides a more robust test and gives us the net link between career pattern on an MP’s hazard of not being re-elected.Footnote7
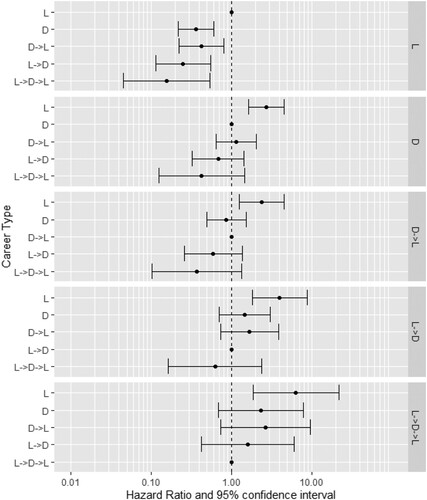
Our analysis () shows that – with continuously list MPs as the reference category – all other career patterns have a negative coefficient, which suggests that the continuously list MPs are most likely to leave parliament and thus tend to have the shortest careers. We refit the model multiple times with each career pattern as the baseline (see appendix, ), which allows us to directly compare each career pattern. The additional analyses reveal that the continuously list career is the only career pattern with a significantly different hazard from any other. All other career patterns do not differ significantly from one another in terms of length of careers.
Table 1. Cox Proportional-Hazards model measuring likelihood of not being re-elected.
We also empirically explored interactions between the different MPs’ background characteristics and types of career to investigate whether the link between career pattern and length of career as revealed in the analysis introduced above is similar for all MPs. We found no significant (p < .05) interaction term, suggesting that the association between career pattern and length of career is similar for all groups of MPs.
Conclusion
Are there two classes of MPs in MMP systems, with list MPs considered ‘inferior’ and thus having shorter careers compared with district MPs? We aimed to add to this debate by investigating the length of careers of different types of MP. However, rather than limiting our focus to the dichotomous district/list distinction, we took a dynamic approach and investigated how modes of election throughout MPs’ careers (continuously list, continuously district or some combination of list and district) relate to the length of MPs’ careers.
Our descriptive and multivariate analyses indicate that the way that MPs are elected throughout their career matters for the length of their career. Those who are always elected as list MPs throughout their career have the shortest careers, and their careers are significantly shorter than those of continuously district MPs and those who are both list and district MPs throughout their career. Focusing on the way that MPs were elected when entering parliament the first time, our analysis also confirms that starting as a list MP significantly decreases one’s survival probability. Yet, when those who enter parliament as a list MP ‘move on’ and are elected as a district MP later in their career, they tend to have the longest careers of all MPs.
In terms of length of career, an ‘ideal’ career thus starts with being elected as a list MP to then change to becoming a district MP. The current prime minister, Jacinda Ardern, is a perfect illustration of such a parliamentary career. She entered parliament as a list MP in 2008 (while she had also campaigned as a district candidate in a – for the Labour Party – unsafe district) and was re-elected as a list MP in 2011 and 2014. After having successfully participated in a by-election in February 2017 (in a different (and for her party safe) district than the one in which she had previously campaigned), she was elected as a district MP in the 2017 and 2020 general elections.
Of course, any MP who has a mixed career automatically survives to a second term as, to have a career change, one must necessarily be an MP for two terms. Yet, the results of our Cox Proportional-Hazards model show that it is not (only) about having a mixed career, as continuously district MPs do not differ significantly in terms of their likelihood of being re-elected from MPs who were both list and district MPs throughout their career. It is mostly the continuously list MPs who distinguish themselves in terms of length of career from all others.
The implications of our findings are manifest. Since the way that MPs are elected when entering parliament and the way that they are elected throughout their career relate to the length of their careers – irrespective of the safety of districts and list seats in and through which they were elected – ambitious MPs aspiring to a long career have to consider the offer they get from their party regarding election as a list or district MP and the opportunities they expect to get further in their careers. The finding that being continuously elected as a list MP relates negatively to MPs’ lengths of careers is also important when considering equal representation. It is known that inequalities exist in the likelihood of being elected as district or list MPs, with, for example, women and ethnic minorities being more likely to be elected as list MPs compared with men and those belonging to the ethnic majority group (eg Barker & Coffé, Citation2018; Coffé & Davidson-Schmich, Citation2020). Our data confirm that women are more likely to be continuously list MPs throughout their parliamentary careers compared with men (respectively 54 per cent and 40 per cent). However, on a more positive note for women’s prospects of a long career, among those who enter parliament as list MPs, women are more likely to move on to becoming district MPs compared with men. Of the women MPs entering parliament as list MPs, 20 per cent go on to become district MPs compared with only 10 per cent of men.
While studies on the routes into parliament are numerous, relatively little is known about career patterns and, in particular, MPs’ career length. Focusing on MMP systems, we trust that our research note has shown the relevance of investigating political careers in a longitudinal way and by moving beyond the typical basic list/district distinction. Of course, the way that MPs are elected is not the only factor related to career length. While we take various additional or alternative factors into account in our models (eg safety of list position or district seat), previous research has, for example, shown that parliamentary work tends to have an impact on re-selection and re-election (see, eg Bouteca et al., Citation2019; Bowler, Citation2010; Crisp et al., Citation2013; Däubler et al., Citation2016). It may be that MPs are not randomly assigned as a district or list (or dual) candidate by the selectorates. Hard-working MPs may, for example, be more likely to be selected as district candidates (rather than list candidates), and thus more likely to be a continuously district MP. Therefore, future research could usefully explore whether legislative performance is related to being selected (and/or elected) as a list or district candidate (or MP) and thus MPs’ length of career. More generally, as political parties are crucial gatekeepers to elected office, they play a key role in MPs’ re-election and their length of career. Therefore, further (qualitative) research could investigate their strategies for list composition and district nominations as well as their attitudes towards the roles of list and district MPs, and how these may affect list and district MPs’ careers.
Acknowledgements
The first author graciously acknowledges the financial support of Victoria University of Wellington and the Institute of Mathematical Innovation of the University of Bath. A draft version of the paper has been discussed at a research workshop organised by the Department of Politics, Languages and International Studies (University of Bath). The authors are very thankful for the useful feedback and suggestions. They would also like to thank Fiona Barker, Hamish Clark, Sam Crawley, Chloe Fitz Patrick, Simon Forbes, Kaitlin Martin-Feek and the New Zealand Parliamentary Information Service for their assistance with data collection.
Disclosure statement
No potential conflict of interest was reported by the author(s).
Additional information
Notes on contributors
Hilde Coffé
Hilde Coffé is a Professor in Politics at the Department of Politics, Languages and International Studies at the University of Bath. Her main research interests include political behaviour, public opinion, political representation, and gender and politics.
Josh Givens
Josh Givens is a PhD student at the Centre for Doctoral Training in Computational Statistics and Data Science (Compass) at the University of Bristol. His PhD project focuses on handling missing data in the field of density ratio estimation. His main research interests include density ratio estimation, missing data, survival analysis, and the statistical analysis of political behaviour and public opinion.
Beate Ehrhardt
Beate Ehrhardt is a Mathematical Innovation Research Associate at the Institute for Mathematical Innovation (IMI) at the University of Bath. Her research focuses on the statistical analysis and application of machine learning to academic research across all faculties of the University of Bath.
Notes
1 The parliament can temporarily expand beyond 120 MPs if a party wins more districts than the number of seats to which it is entitled based on its share of the nationwide vote.
2 These seats overlay the General districts. The number of Māori seats – also referred to as Māori electorates – can vary depending on how many voters of Māori descent choose to enrol on the Māori roll rather than the General roll.
3 For each legislative period, the data records all MPs who entered parliament after the election. It does not take account of changes during the legislative period, such as replacements of MPs who retire or resign. Fifteen MPs took breaks ranging from three to 15 years. They are each counted as one MP.
4 The vast majority of candidates in New Zealand are so-called dual candidates, campaigning both as district and list candidates. Of our sample of elected MPs, 86.3 per cent of all elected district MPs and 80.0 per cent of all elected list MPs (with each seat/list and election year combination taken as one observation) were dual candidates.
5 MPs elected in a Māori seat are defined as district MPs. We ran an additional analysis excluding the Māori seats. Results (see Table S1 in the supplementary material) were similar to those presented later.
6 The confidence intervals for the mixed careers are significantly larger due to these categories having fewer MPs hence making our estimates for average term length more uncertain.
7 To account for the fact that some MPs were already MPs before the first MMP elections held in 1996 (a phenomenon known as left-truncation (Howards et al. Citation2006)), we performed a supplementary analysis with all MPs who were in parliament before 1996 removed. In addition, and to account for the fact that some MPs leave parliament of their own volition, we completed a separate analysis where any MP who did not run in the next election was censored. This allowed us to look at the length of district MPs’ potential career if they were to stay in parliament until they lost an election. The results of both analyses (see Tables S2 and S3 in the supplementary material) were similar to those presented herein.
References
- Barker, F., & Coffé, H. (2018). Representing diversity in mixed electoral systems: The case of New Zealand. Parliamentary Affairs, 71(3), 603–632. https://doi.org/10.1093/pa/gsx073
- Bouteca, N., Smulders, J., Maddens, B., Devos, C., & Wauters, B. (2019). ‘A fair day’s wage for a fair day’s work’? Exploring the connection between the parliamentary work of MPs and their electoral support. The Journal of Legislative Studies, 25(1), 44–65. https://doi.org/10.1080/13572334.2019.1570602
- Bowler, S. (2010). Private members’ bills in the UK parliament: Is there an ‘electoral connection’? The Journal of Legislative Studies, 16(4), 476–494. https://doi.org/10.1080/13572334.2010.519457
- Carman, C., & Shephard, M. (2007). Electoral poachers? An assessment of shadowing behaviour in the Scottish parliament. The Journal of Legislative Studies, 13(4), 483–496. https://doi.org/10.1080/13572330701663587
- Coffé, H. (2018). MPs’ representational focus in MMP systems. A comparison between Germany and New Zealand. Representation, 54(4), 367–389. https://doi.org/10.1080/00344893.2018.1539030
- Coffé, H., & Davidson-Schmich, L. K. (2020). The gendered political ambition cycle in mixed-member electoral systems. European Journal of Politics and Gender, 3(1), 79–99. https://doi.org/10.1332/251510819X15705394695400
- Crisp, B. F., Olivella, S., Malecki, M., & Sher, M. (2013). Vote-earning strategies in flexible list systems: Seats at the price of unity. Electoral Studies, 32(4), 658–669. https://doi.org/10.1016/j.electstud.2013.02.007
- Däubler, T., Bräuninger, T., & Brunner, M. (2016). Is personal vote-seeking behaviour effective? Legislative Studies Quarterly, 41(2), 419–444. https://doi.org/10.1111/lsq.12119
- Hazan, R. Y., & Rahat, G. (2010). Democracy within parties. Candidate selection methods and their political consequences. Oxford University Press.
- Howards, P. P., Hertz-Picciotto, I., & Poole, C. (2006). Conditions for bias from differential left truncation. American Journal of Epidemiology, 165(4), 444–452. https://doi.org/10.1093/aje/kwk027
- Lawless, J. L., & Theriault, S. M. (2005). Will she stay or will she go? Career ceilings and women’s retirement from the U.S. Congress. Legislative Studies Quarterly, 30(4), 581–596. https://doi.org/10.3162/036298005X201680
- Manow, P. (2007). Electoral rules and legislative turnover: Evidence from Germany’s mixed electoral system. West European Politics, 30(1), 195–207. https://doi.org/10.1080/01402380601019852
- Matland, R. E., & Studlar, D. T. (2004). Determinants of legislative turnover: A cross-national analysis. British Journal of Political Science, 34(1), 87–108. https://doi.org/10.1017/S000712340300036X
- McLeay, E., & Vowles, J. (2007). Redefining constituency representation: The roles of New Zealand MPs under MMP. Regional & Federal Studies, 17(1), 71–95. https://doi.org/10.1080/13597560701189628
- Patzelt, W. (1997). German MPs and their roles. In W. C. Müller & T. Saalfeld (Eds.), Members of parliament in Western Europe. Roles and behaviour (pp. 32–78). Frank Cass.
- Praino, R., & Stockemer, D. (2018). The career length and service of female policymakers in the US house of representatives. Government and Opposition, 53(3), 437–460. https://doi.org/10.1017/gov.2016.37
- Shugart, M. C., & Tan, A. C. (2016). Political consequences of New Zealand’s MMP system in comparative perspective. In N. F. Batto, C. Huang, A. C. Tan, & G. W. Cox (Eds.), Mixed-member electoral systems in constitutional context. Taiwan, Japan and beyond (pp. 247–277). University of Michigan Press.
- Stel, V. S., Dekker, F. W., Tripepi, G., Zoccali, C., & Jager, K. J. (2011). Survival analysis II: Cox regression. Nephron Clinical Practice, 119(3), c255–c260. https://doi.org/10.1159/000328916
- Zittel, T., & Gschwend, T. (2008). Individualised constituency campaigns in mixed-member electoral systems: Candidates in the 2005 German elections. West European Politics, 31(5), 978–1003. https://doi.org/10.1080/01402380802234656
Appendix
Table A1. Overview of variables.
Table A2. Descriptive information (percentage or mean (standard deviation in parentheses)) for all MPs included in the analyses (N = 346).
Figure A1. Hazard ratios of career patterns for different reference categories (based on the model presented in ).
Note: L: List, D: District.