
ABSTRACT
This study seeks answers to the research question ‘How can walkability of urban spaces be analysed with a multidimensional approach by using mobile methods?’ The research consists of a literature review, a field study in the city centre of Delft conducted as Go-Along walks, which provide better insight in capturing the experience of walking in situ, and evaluation of design scenarios that were developed according to the outcomes of the field study. As a result, the study emphasizes the strong inter-relations between metrics for a walkable place and the necessity to discuss walkability multi-dimensionally.
Introduction
Walking has always been one of the most important modes of human mobility. People have different motivations to walk, such as walking for leisure; enjoying nature; exploring their surroundings; for health; to be alone; to think; or just to access key destinations. As an active mode of transportation, walking is affordable, environmentally friendly and healthy. Whatever the walker’s motivation or purpose, cities must provide the necessary infrastructure for safe and comfortable urban walking as stated in The International Charter for WalkingFootnote1 and The European Charter of Pedestrian Rights.Footnote2 Lo (Citation2009) suggests expanding the definition of pedestrians from a person walking on foot to also include those using wheelchairs or other aids; therefore, cities must provide a healthy environment and safe, convenient spaces for walking for all, as outlined in these charters. ‘Right to walk’ (Balsas Citation2017; Middleton Citation2018) in cities is another foundational theory, stating that everyone has the right to walk in cities and to be a part of the development of walkable spaces.
Interest in walkability and walkable cities has increased in recent years. Cities including London, Toronto and Stockholm have started to develop walkability action plans to create more walkable environments for their residents (City of Toronto Citation2009; Stockholm; City Planning Administration Citation2010; Transport for London Citation2005). More walkable cities provide fundamental benefits, such as improving personal health of adults (Doyle et al. Citation2006; Frank et al. Citation2006; Giles-Corti et al. Citation2009; Van Dyck et al. Citation2010; Zhao and Chung Citation2017) and children (Giles-Corti et al. Citation2009), supporting the local economy (Litman Citation2004; Sohn, Moudon, and Lee Citation2012) and increasing social capital (Rogers et al. Citation2011; Rogers, Gardner, and Carlson Citation2013). As such, walkability is an important indicator of quality of life and sustainable transportation in cities. According to the Urban Liveability Index developed by Higgs and colleagues (Higgs et al. Citation2019) and Global Liveability Ranking developed by The Economist Intelligence Unit,Footnote3 walkability is one of the main indicators of a city’s liveability.
The term ‘walkable’ refers to urban space that is convenient for walking behaviour. Based on this definition, a walkable place is one where you can walk safely, comfortably and pleasantly. ‘Walkability’ measures the quality of walking conditions, including the existence of walking facilities and the degree of walking safety, comfort and convenience (Litman Citation2004). Several factors affect the walkability of a street, neighbourhood or city, from the physical efficiency of a place to the perception of an individual who is walking. In other words, the factors that define a space as walkable are not limited to the physical dimensions of a place but also include perception. This necessitates a multidimensional approach to walkability analysis.
As discussed in the literature review of this paper, analysis of walkability in most literature includes only one dimension: physical or perceptual but, rarely both. Analysis of one of those dimensions alone is not sufficient. In relation with this, the hypothesis of this study is: ‘Creating more walkable places in cities encourages people to walk more and improves pedestrian mobility. Making analyses in order to improve walkability in cities requires considering different dimensions of walkability’. This study presents a multidimensional methodology that creates connections between physical and perceptual walkability at street level. Such a multidimensional approach opens a wider and a holistic discussion to analyse walkability.
Based on this hypothesis, this study seeks to answer the main research question, ‘How can walkability of an urban space be analysed with a multidimensional approach by using mobile methodologies?’. Within this scope, this study aims to analyse both the physical walkability efficiency of a space and the perception of the people who are walking through that space at the micro level. The study aims to evaluate the perception dimension by using mobile methodologies that give detailed place-based impressions of participants in situ. It was designed to conduct case studies in the city centres of Delft-Netherlands and in Beşiktaş-Istanbul, Turkey. Both studies were carried out in city centres for of two reasons: First, city centres attract a high volume of pedestrians with their commercial and cultural functions. Many walking trips occur in city centres, and thus a high level of walkability is expected for this type of location. Second, pedestrians walk in city centres for many daily purposes such as shopping, meeting with friends, going to a theatre, etc. Since this study is focusing on daily walking trips, city centres are an ideal location to examine the daily walking experience and pedestrians’ perception about walkability. Although the study has two cases, this paper focuses on the Delft case, which tests outcomes of the field study by co-creating different design scenarios and by collecting participants’ walking perceptions for a more walkable environment based on two-dimensional alternative images.
‘Mobile methodologies’ (Anderson Citation2004; Fincham, Mcguinness, and Murray Citation2010; Carpiano Citation2009; Evans and Jones Citation2011; Hein, Evans, and Jones Citation2008; Merriman Citation2014; Büscher, Urry, and Witchger Citation2011; Spinney Citation2015) is the basis of this research on pedestrian perception. This methodology aims to analyse dynamic and mobile experiences in situ, which allows more detailed answers in terms of place context compared to desk-based research. Mobile methodologies make it possible to discover people’s positive or negative experiences, feelings and interpretations in the moment, which enables viewing the place from a different perspective. Within this scope, the pedestrian perception study was conducted as mobile interviews in the form of ‘Go-Along’ walks. Comments of participants during ‘Go-Along’ walks were integrated with topics from the literature and evaluated. The results were intended to be used to co-create alternative design scenarios for a more walkable environment.
Following the field study, the study’s original aim was to evaluate physical and perceptional dimensions together in a second phase via 3D Virtual Environments by using VR headsets providing a full immersive experience. Unfortunately, this was not possible during the study period due to Covid-19 pandemic restrictions. The VR component of the study had to be replaced with two-dimensional images. Because of this exceptional but necessary change, design alternatives were developed to test walkability perceptions of pedestrians in different environments using digital images. This limited the research, since evaluating using two-dimensional images is insufficient to measure dimensions of walkability like safety and comfort. Structuring the second phase based on two-dimensional images was the only potential solution due to the pandemic, and the results of the field study that focused on attractive features of walkability made it the best alternative to VR.
Several options for two-dimensional images were evaluated, such as doing sketches or drawings, using Google Street View or designing images with Adobe Photoshop. Doing sketches or drawings were eliminated, since the study aimed to capture the real-life experience as much as possible. Using Google Street View as a photo-realistic tool and creating a virtual tour according to the outcomes of the field study was impossible due to time limitations of the researchers on a five-month research visit. Thus, Adobe Photoshop emerged as the best option to design and test alternative scenarios for more walkable environments.
The global Covid-19 pandemic created other limitations as well. The field study was scheduled to take place in March 2020 before Covid-19 emerged as a pandemic. However, this unexpected situation caused suspending the field study due to public safety restrictions. After a break of two months in the middle of the research, the field study was completed with a far smaller number of participants than intended from the beginning. This was beyond the researchers’ control and had to be accepted as an inevitable outcome of the pandemic. Under the circumstances, the maximum number of participants was limited to ten. Also, the profile of participants was biased as a result of a random recruitment process through a research website, social media and printed brochures distributed in the city library.
Nonetheless, the study had valuable strengths. Using mobile methods as a tool for walkability analyses is not common in walkability studies in the literature. These methodologies enabled this study to get detailed answers about place context compared to desk-based research, by observing the object or the movement in situ. In addition, using results of the field study to co-create alternative design scenarios to test pedestrian perception for more walkable environments allowed researchers to co-create designs based on participants’ experiences and needs. Co-created designs were evaluated by participants and their responses helped to clarify what kind of improvements might affect the perception of walkability at the micro-level.
In the first part of this paper, a walkability literature review will be given in order to present the main approaches to the concept and demonstrate why it is necessary to use a multidimensional walkability approach. Following this review, the methodology of the research will be explained. In the case study section, basic spatial features of the field area and ‘Go-Along’ walks with participants in the city centre of Delft will be explained and outcomes will be discussed in relation to the literature review. Based on these outcomes, alternative design scenarios, images and results of these scenarios will be presented in the third part. The paper will then conclude with the key implications: the advantages of using mobile methodologies for walkability analysis; micro-environment design solutions for creating more walkable spaces; and inter-relationships and interactions between walkability indicators.
Walkability analyses in the literature
Walkability has been studied by various disciplines such as Urban Planning, Architecture, Health Sciences, Geography, Sociology, Psychology, etc. – and thus, discussed from multiple perspectives and analysed with several methods. Walkability studies in Urban Planning mainly focus on the relationship between walking and the urban environment and aim to present the fundamental criteria for walkable places on different scales.
Studies in the literature are basically divided in two groups: the meso scale and the micro scale (Al-Hagla Citation2009; Bereitschaft Citation2017; Ferrer, Ruiz, and Mars Citation2015; Valera Sosa and Nickl-Weller Citation2016). Meso-level walkability studies have focused on the built environment on a city or neighbourhood scale and its impact on walking behaviour, using quantitative methods. Cervero and Kockelman (Citation1997) proposed the concept of 3D’s (density, diversity and design) and this was developed further and formulized as 5 C (connected, convivial, conspicuous, comfortable, convenient) by Transport for London (Citation2005) and 7 C (connected, convivial, conspicuous, comfortable, convenient, coexistence, commitment) by Cambra and Menteiro (Citation2012). These meso-level studies mainly focus on environmental factors, topography, residential density and land use diversity, street connectivity and how these macro elements affect walkability in cities. However, as Kim, Park, and Lee (Citation2014) suggests, meso-scale measures in general have drawbacks for capturing micro-scale-built environment characteristics. On the other hand, micro-level walkability studies have paid attention to micro elements of the built environment such as the continuity and width of sidewalks, presence of green elements, pedestrian crossings, etc., mostly in street scale (Park, Deakin, and Lee Citation2014). As Park, Deakin, and Lee (Citation2014) describe them, micro-level studies include environmental and physical design attributes that sometimes require qualitative measurements. ‘Microlevel walkability can be measured by street-level physical attributes that are directly perceived by pedestrians and thus may influence their walking experience in a significant way. The advantage of microlevel walkability is its finer scale of measurement’ (Park, Deakin, and Lee Citation2014, 126). These studies form the bases for a need to study walkability with a micro-level approach.
Besides levels of scale, the walkability concept was studied in three main topics in the literature. Studies in the first topic focus on the physical conditions of walkable places try to formulate the main definitions of walkability and the basic components of a walkable environment (Cubukcu Citation2013; Forsyth Citation2015; Southworth Citation2005; Forsyth and Southworth Citation2008). These studies researching the environmental conditions of spaces are mostly aiming to measure or audit walkability quantitatively. Some of the most common methods used in studies are audit tools like Walkscore (Duncan et al. Citation2011), Irvine–Minnesota Inventory (Day et al. Citation2006), ‘Walkability Index Tool’ (Giles-Corti et al. Citation2014) and The Global Walkability Index (Krambeck Citation2006) which was later adopted for local contexts (Leather et al. Citation2011; Yusuf and Waheed Citation2015). Some of these studies associated walkability audits with GIS based approaches (Cubukcu et al. Citation2015; Lee and Talen Citation2014) and indicators based on 7Cs (Moura, Cambra, and Gonçalves Citation2017).
The second main study topic focuses on the perceptions and thoughts of pedestrians about their environment (Alfonzo Citation2005; Arshad et al. Citation2016; Leslie et al. Citation2005; Mehta Citation2008; Park, Deakin, and Lee Citation2014; Villaveces et al. Citation2012). These studies analyse pedestrian behaviours and perceptions by focusing on the user experience and subjective interpretations that affect walking behaviour and motivation. These perception studies are not necessarily independent from physical conditions and spatial configurations. This study topic aims to evaluate how pedestrians perceive the built environment as walkable. For example, Arshad et al. investigate whether gender differences influence pedestrian perception and satisfaction at street level (Arshad et al. Citation2016). Alfonzo (Citation2005) presents a hierarchy of walking needs in order to understand the decision-making process of walking behaviour. She tries to emphasize that individual perceptions, and microscale-level physical and social characteristics are important factors to influence walking. Mehta (Citation2008) defines two more steps to this structure: usefulness and sense of belonging. Park, Deakin, and Lee (Citation2014) develop a perception-based composite walkability index that researchers could use to evaluate the microlevel quality of the walking environment and discover pedestrians’ perceptions. Villaveces et al. (Citation2012) study pedestrians’ perceptions of walking and safety in relation to the built environment. These studies, taken together, highlight the importance of pedestrians’ perception for walkability analyses.
There are also a few studies that consider both physical and perceptional dimensions of walkability. Ewing and Handy’s research presents a comprehensive work that aims to evaluate overall walkability by focusing on physical features, urban design qualities and individual reactions that shape walking behaviour (Ewing and Handy Citation2009). Lee and Dean (Citation2018) investigate the relationship between objective and subjective measures of walkability for seniors living in Toronto through a mixed-methods approach. They suggest three dimensions that influence perceived walkability and walking behaviour: physical and social environmental characteristics; personal circumstances; and home environments. Brown et al. (Citation2007) combine the Irvine Minnesota audit tool with guided walks to discover pedestrians’ perceptions (Leslie et al. Citation2005). Leslie et al. (Citation2005) focuses on perceptions of residents at the neighbourhood scale and investigates the relationship between perceived and measured walkability.
Based on these studies and findings, this study claims that it is important to evaluate both physical and perceptional dimensions in order to analyse walkability with a multidimensional approach.
Another important research topic is the relationship between physical and psychological health and walking as a physical activity (Doyle et al. Citation2006; Frank et al. Citation2006; Giles-Corti et al. Citation2009; Hanibuchi et al. Citation2015; Van Cauwenberg et al. Citation2016; Van Dyck et al. Citation2010, Citation2011; Zhao and Chung Citation2017). Some of these studies focus on the association between the built environment and walking as a physical activity for children and adolescents (Giles-Corti et al. Citation2009) or the role of walkable neighbourhoods in increasing walking as a part of physical activity for adults (Van Cauwenberg et al. Citation2016; Van Dyck et al. Citation2011; Zhao and Chung Citation2017). Some studies look at the association between perceived walkability and its effect on physical activity (Hanibuchi et al. Citation2015) and the relationship between neighbourhoods that are perceived as safe and residents’ physical activity in terms of individual health (Doyle et al. Citation2006). These studies once again emphasize the importance of walking for people’s health and creating walkable places.
Studies from the literature that focused on either physical conditions or perception rely on some common basic qualities for a walkable environment. Most of the studies group the key qualities for a walkable experience into six topics: 1- Traffic Safety, 2-Security, 3- Comfort, 4- Attractiveness, 5- Accessibility and 6- Mixed use. As result of the literature review of walkability, this study focuses on these six main walkability measures and structures outcomes of the case study according to these categories.
Methodology of the study: mobile methodologies and Go-Along walks
Today, paradigm shifts are affecting scientific studies and approaches by developing new theories and methodologies. One of these paradigm shifts, which is called ‘the new mobilities paradigm’, have been introduced by Sheller and Urry (Sheller and Urry Citation2006). The new mobilities paradigm claims that the new concept of mobility is beyond absolute movement and needs to be considered alongside social dimensions. Thus, the new mobilities paradigm emphasizes that mobility is not only a movement but a process. In order to understand the new mobilities from a wider perspective with different dimensions, Shelley and Urry speak of the need to develop new methodologies (Sheller and Urry Citation2006). At this point, ‘Mobile Methodologies’ opens up a new perspective and offers new opportunities.
‘Mobile methodologies’ offer researchers a qualitative approach to taking their research on the move for studies that benefit from the context of place. This methodology allows for more detailed answers from participants about experiences, feelings, memories or interpretations about a place in situ (Anderson Citation2004; Carpiano Citation2009; Evans and Jones Citation2011; Merriman Citation2014; Büscher, Urry, and Witchger Citation2011; Spinney Citation2015). Within this methodology, being mobile in the place and interacting with the field allows participants to remember details and ideas that would not be possible from desk-based research. As a key component of this method, researchers move along with participants, conduct mobile interviews and observe the subject in the context of place. This allows researchers to see the place from the participants’ perspective and discover hidden meanings, unnoticed details and relationships (Kusenbach Citation2003).
Within this methodology, structured or semi-structured mobile interviews can be done by walking, cycling or moving in a vehicle and can be tracked by GPS. Interviews are recorded on video or audio and maps or sketches can be drawn. In the literature, researchers use mobile methods such as ‘Go-Along’ (Carpiano Citation2009; Kusenbach Citation2003; Merriman Citation2014; Spinney Citation2015) ‘Guided Walk’ (Brown et al. Citation2007; Aksümer Citation2019; Lashua and Cohen Citation2010), ‘Commented Walks’ (Layeb Citation2014; Thibaud Citation2017) or ‘Walking Interviews’ (Evans and Jones Citation2011; Battista and Manaugh Citation2017; Lee and Ingold Citation2006; Clark and Emmel Citation2010; Jones et al. Citation2008).
‘Go-Along’ is a mobile method which is described as an efficient tool to discover people’s experiences about their environments (Carpiano Citation2009). By going along with the participants, it is possible for researchers to observe their subjects within the spatial context and capture how participants perceive and interpret the environment, and the impressions, experiences and memories they have related to the space (Kusenbach Citation2003). In this method, participants are usually familiar with the place and guide routes while answering some questions or making comments while walking or riding along. Go-Along has been used in this study in the form of walking since it allows researchers to study movement in situ.
Delft case study: experience of Go-Along in the city centre
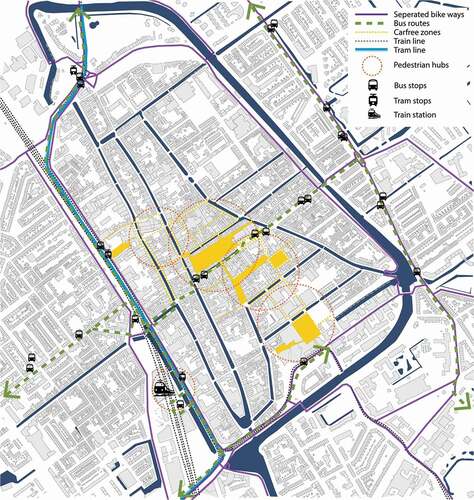
Delft is an historical city in South Netherlands with a population of 103.163Footnote4 inhabitants. Within the scope of this study, the historical city centre of Delft, in Dutch ‘Binnenstad’, was chosen. The city centre is very vibrant due to cluster of commercial functions and activities. It attracts people from all around Delft and is accessible by walking, cycling and public transportation. Delft’s city centre has approximately 12.000Footnote5 inhabitants, and is substantially pedestrianized; traffic has been slowed down to support walkability and bikeability. shows basic spatial features and configuration of car-free areas and streets, pedestrian hubs, public transportation and a bicycle network in the field area.
Figure 1. Public, bicycle and pedestrian transportation network in the city centre of Delft.
In the Delft field study, ‘Go-Along’ walks were organized by researchers in the city centre of Delft. On routes led by pedestrians, questions were asked to participants to express their positive and negative experiences during walking. Ten ‘Go-Along’ walks were carried out in the city centre with residents of Delft between 7–14th of March and 5–13th of May 2020. On March 13th, due to the emergence of the Covid-19 pandemic, The Netherlands went under lockdown, resulting in a research break of about two months. The original plan was to recruit 15–20 participants, but due to pandemic limitations, it wasn’t possible to continue the field study during lockdown. The research sample comprises local residents ages 21–42, highly educated, students or employees. Participants were recruited by distributing brochures in the city library, sharing the web site of the research via social media pages of TU Delft and snowball sampling. The research was approved by the Human Research Ethics Committee at TU Delft. All participants have signed an informed consent form and ten Go-Along walks were recorded on audio with their knowledge.
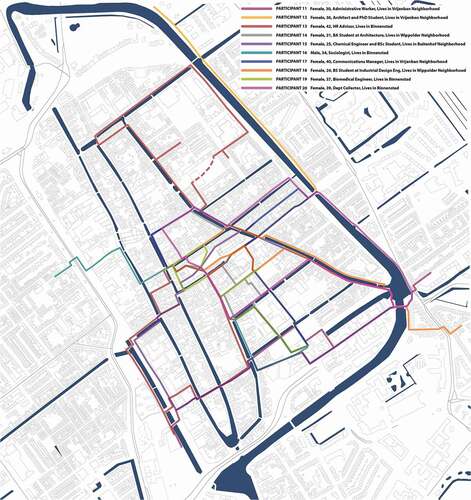
As part of the Go-Along field study, 10 participants were asked to choose a daily route that they usually take in the city centre. illustrates the 10 different routes taken with participants. These walks were guided by participants based on their daily walking routes and took around 45 minutes. Researchers did not define one route thus all Go-Along routes occurred in different shapes with different starting and ending points that were determined by the participants. Walking routes started and ended either within the boundaries of the city centre or at the edge and as a result, some segments of the routes have overlapped and became the final route.
Figure 2. Go-Along walking routes with participants in Delft.
Before starting the Go-Along walk, the participants were informed about the research and asked three questions to get information about their walking habits and impressions: ‘How much do you walk in your daily life?’ ‘Why/why not do you prefer walking?’ and ‘What are the positive and negative things that effect your walking experience?’ The participants said that their daily walks ranged from 20–30 minutes a day to 2–3 hours a week, with variations based on how much they use bicycles for transportation in their daily lives. The walking purposes of participants were mostly for shopping and transportation, with the exception of two participants taking leisure walks. It was found that participants prefer cycling to walking for longer distances and for speed. Related to this finding, time limitations emerged as a key factor in their decision to choose walking. Another important factor is the weather: if the weather is ‘good’ participants tend to walk more. In addition, green elements such as green areas, parks, and trees and being healthy and fit were found to be positive factors that encourage participants to walk more. These features can be categorized relatedly with the literature as in the (the mixed-use category wasn’t included in this table since all participants mentioned that the area has mixed-use functions).
Table 1. Categorized answers to the question of ‘What are the positive and negative things that effect your walking experience?’
After answering these questions, participants were asked to join a mobile Go-Along interview while walking in the city centre together with the same researcher. At the beginning of the walk, the participants were asked to answer the question of: ‘Can you describe the positive and negative things that you feel/see/hear/smell etc. that affect your walking experience?’. The researcher did not intervene during the route but only observed and tried to capture the comments of the participant. All comments were audio recorded, decoded and analysed by qualitative analysis tool Maxqda.
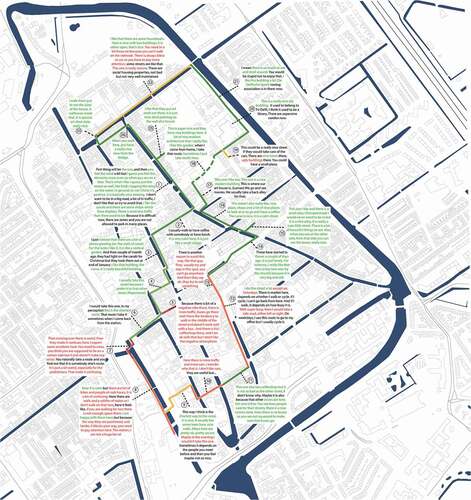
As an example, illustrates the route of one of the participants in the city centre of Delft where positive comments were marked in green while negative ones are in red. The route was coloured in dark green, green, orange, yellow and red according to quality and amount of positive and negative comments.
Figure 3. An example of visualized Go-Along walk in Delft with one of the participants.
Delft city centre was mentioned as a very safe place to walk in terms of both traffic and crime safety by all participants. Participants commented positively about car-free areas, the low volume of vehicle traffic and the speed limit in the city centre, which create a safe environment in terms of traffic. Participants also described Delft as a more bicycle-oriented city and most of the participants commented that it would be nice to have a balance between bicycles and walking. Some participants mentioned that they find biking safer than walking because biking has more priority in traffic and the struggle between pedestrians and cyclists is the only thing that bothers them while walking.
Another important finding from the Go-Along walks was that the historical buildings and landscape make walking very enjoyable. Markt place, Brabantse Turfmarkt, Beestenmarkt, which are surrounded by beautiful historical buildings, were particularly mentioned as enjoyable places to walk. Some participants mentioned that it would be better to have greener city centre – but this can be partially explained by the timing of walks with first six participants (beginning of March 2020, prior to spring regrowth).
At the end of walking, participants were asked three more questions to evaluate the experience: ‘How would you describe this walking experience? What did you feel during walking?’ ‘How would you describe this walk in sections? (parts you enjoyed most and least etc.)’ and ‘How could it be possible to make this walking experience better? What is the walk of your dreams?’. All of the participants indicated that walking in Binnenstad (city centre) was a nice, peaceful, safe, comfortable and enjoyable experience. Participants also mentioned that they paid more attention during the walk, and that added observance encouraged them to walk more. Participants’ answer to what would make a better walking experience focused mostly on the need for clear separation between pedestrians and bicycle paths, improving greener and attractive elements and creating safe and comfortable spaces for pedestrians.
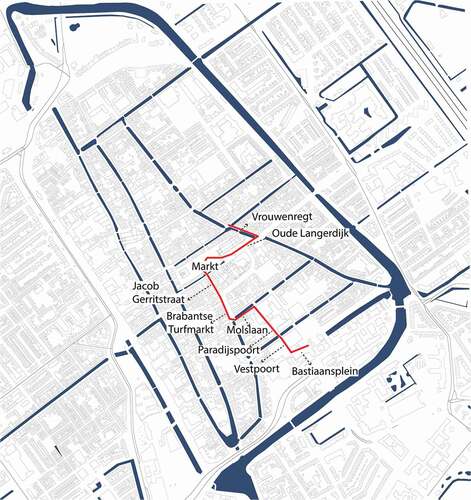
In order to evaluate Go-Along walks, the streets that were overlapped and taken most with participants were counted and illustrated in . Based on these most visited streets, it was possible to come up with one common final route fallowed as; Bastiaansplein, Vestpoort, Paradijspoort, Molslaan, Brabantse Turfmarkt, Jacob Gerritstraat, Markt, Oude Langerdijk, Vrouwenregt. These streets and final route are illustrated in .
Figure 4. Delft field study final route and streets.
Go-Along results of the final route were labelled and categorized by using Maxqda in five topics as mentioned in literature review. shows the summary of positive and negative comments made by participants about their walking experience. Based on the findings from go-along walks, was prepared for the common route which emphasizes the features of the streets on the route that affect participants’ walking experiences in positive and negative ways in relation to the literature.
Table 2. Summary of Go-Along Walks in Delft
Alternative design scenarios for a more walkable environment
Based on these findings from the Go-Along field study and , alternative scenarios for the final route were prepared by researchers in order to find solutions to these minor problems and given in . These scenarios essentially aimed to co-create more attractive environments and reduce the struggle between walking and cycling, since the main issues mentioned during Go-Along walks focused on the need for attractive features and traffic safety at pedestrian and bicycle intersections.
Table 3. Alternative design scenarios for the final route
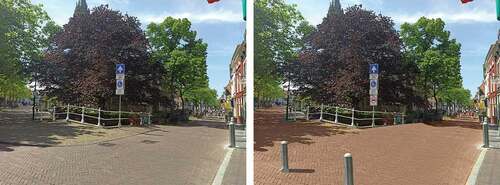
By using the design scenarios in , alternative images were designed using Adobe Photoshop for the selected route to evaluate participants’ perceptions about different environments. Figures 5-12 show the current situation and developed alternative design to co-create a better walking environment based on Go-Along outcomes.
Figure 5. Bastiaansplein current situation (L) and design alternatives (M/R). Surface of the ground was changed, urban furniture and green elements were added.
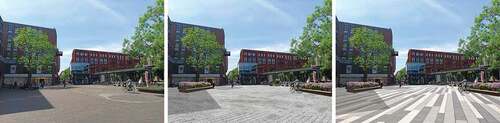
Figure 6. Vestpoort current situation (L) and design alternatives (M/R) surface of the ground was changed, green elements were added and the street became only for pedestrians.
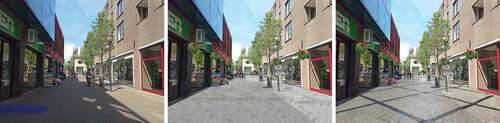
Figure 7. Paradijspoort current situation (L) and design alternatives (M/R) surface of the ground was changed, green elements were added and the street became only for pedestrians.
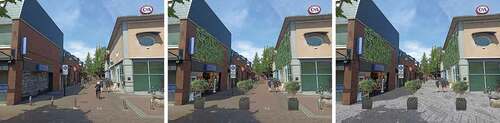
Figure 8. Brabanstse Turfmarkt current situation (L) and design alternatives (M/R) no physical changes were made. It is aimed to test if participants prefer to have the local market on the street or not.
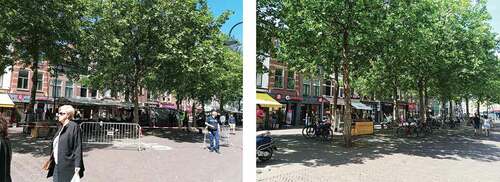
Figure 9. Jacob Gerritstraat current situation (L) and design alternatives (M/R) surface of the ground was changed and green elements were added.
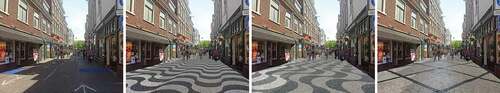
Figure 10. Markt −1 current situation (L) and design alternatives (M/R) different urban furniture and green elements were added.
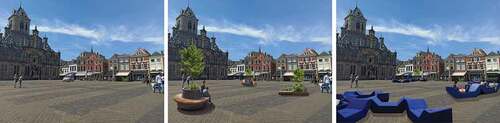
Figure 11. Markt-2 current situation (L) and design alternatives (M/R) different urban furniture, green elements were added. Exhibition was located to make the place more alive and attractive.
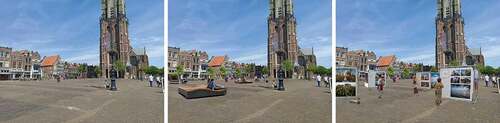
Figure 12. Vrouwenregt current situation (L) and design alternatives (M/R) surface of the ground became smoother and more continuous and the street became car-free.
In order to test design alternatives for a more walkable environment in the city centre of Delft, participants of Go-along walks were asked to evaluate the current situation and design alternatives developed within the scope of this research. With this purpose in mind, participants ranked these alternative designs through an online form by using Likert scale for traffic safety, security, comfort, accessibility, attractiveness and mixed use. Although there are limitations to evaluating some measures of walkability – such as sense of safety or comfort – via two-dimensional images, these scenarios allowed researchers to test the effect of micro-environmental changes on participants’ perception of walkability. Rankings made by ten participants for each street were calculated and percentage accounts of results were evaluated out of 100 under six walkability measures. The resulting ranking of these alternative design scenarios are illustrated in the charts below.
Figure 13. Results of ranking of alternative design scenarios.
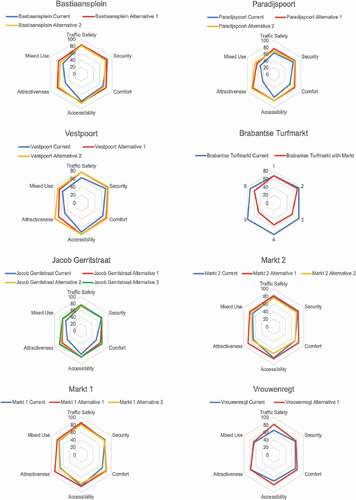
As seen in , developments in one measurement of walkability can affect and improve other measures as well. For example, improving attractiveness in Vestpoort lead to an improvement in traffic safety. Changing the surface of the ground in Jacob Gerrittstraat not only improved attractiveness but also the feeling of comfort. Making Vrouwenregt car-free improved both the perception of traffic safety and accessibility, while adding urban furniture to the Markt improved both attractiveness and comfort. These results point out the inter-relations between measures of walkability and how it works as a holistic system.
Conclusion
This research resulted in two main conclusions:
Firstly, using mobile methodologies for walkability analyses allowed researchers to get more detailed answers in terms of place context compared to desk-based research. Participants gave more detailed answers in the field about the space itself, as can be compared in . Go-Along walks made it possible to discover people’s positive or negative experiences and feelings about the place in situ. Capturing every unique experience in motion opened up a new perspective for researchers which wouldn’t be possible through desk-based research. A researcher walking along with a research subject helped to surface not only physical but also perceptional measures that affect pedestrians’ sense of walkability. This once again showed that it is important to analyse different aspects of walkability such as spatial, physical and perceptional in tandem.
Within this scope, it was concluded that mobile methodologies provide useful tools for analysing walkability in order to study spatial and perceptional dimensions together. The inputs from the field study allowed researchers to co-create alternative design scenarios based on pedestrian perceptions which wouldn’t be possible without go-along walks with participants. Using mobile methodologies to collect input from real pedestrian experiences provided an excellent basis to co-create design scenarios and images to evaluate the impact of micro-changes for a more walkable environment.
Further, co-creating design alternatives based on residents’ walking experiences allowed researchers to evaluate if micro-design solutions could work to make a space more walkable. As a result of testing alternative scenarios, it is possible to say that making minor changes and improvements in a micro environment, such as different ground patterns, or adding green elements and sitting furniture, can change the perception of the walkability of a space.
In addition to this, it is found out that there are strong inter-relations among measures of a walkable place. Measures of walkability work as a whole and improving one of these measures can affect the others. Interventions such as improving attractiveness of the ground can affect the feeling of comfort and perception of accessibility. Regulating traffic and resolving the struggle between pedestrians and bicycles/automobiles can improve the feeling of traffic safety and also comfort. These results once again emphasize that it is not possible to evaluate the measures of walkability separately.
Although the aim was to evaluate physical and perceptional dimensions immersively in the second phase via VR, this was not possible due to Covid-19 pandemic restrictions and was replaced with a comparison of two-dimension images. Thus, the study had to focus on physical dimensions for the second evaluation part and co-created scenarios considering mostly attractive measures for a more walkable environment. Nevertheless, this evaluation has provided clues about how physical improvements can improve other walkability measures like perception of safety, security, accessibility and comfort.
Finally, for upcoming research studies on walkability analyses, this study has shown that walkability should be studied considering both physical and perceptual dimensions as a whole in order to co-create more walkable environments that encourage people to walk more. For multidimensional research like this, mobile methodologies can be a significant tool to analyse walkability considering different dimensions and get more comprehensive results.
These findings indicate that the process and method of this research can be used as a model for future studies in walkability literature within different sizes of cities and different types of environments. Future studies can use this research as a starting point and improve it by using immersive technologies to take it a step further. It would also be favourable to develop comparable studies that research different urban areas such as city centres versus suburbs, or residential areas from various regions, geographies and cultures.
Acknowledgments
We would like to thank all participants for giving their time for interviews and walks in this study which took place between January-June 2020.
Disclosure statement
No potential conflict of interest was reported by the author(s).
Notes
1. https://www.pedestrians-int.org/images/IFP/pdf/key_doc/charter_EN.pdf (Access: 13.11.2020).
2. https://www.diba.cat/c/document_library/get_file?uuid=246cdcd3-0c1b-4056-9573-115f2eb986b3&groupId=7294824 (Access: 13.11.2020).
3. https://www.eiu.com/topic/liveability (Access: 13.11.2020).
5. [2] https://www.delft.nl/en/housing/delfts-8-districts (14.11.2020).
References
- Aksümer, G. 2019. “Kenti Yaşayandan Öğrenmek: Şehircilik Çalışmalarında Rehberli Gezi Yönteminin Kullanımı, Izmir-selçuk ve Bursa-iznik Örnekleri.” MEGARON/Yıldız Technical University, Faculty of Architecture E-Journal 14 (4): 598–610. doi:https://doi.org/10.14744/megaron.2019.48751.
- Alfonzo, M. A. 2005. “To Walk or Not to Walk? The Hierarchy of Walking Needs.” Environment and Behavior 37 (6): 808–836. doi:https://doi.org/10.1177/0013916504274016.
- Al-Hagla, K. S. 2009. “Evaluating New Urbanism’s Walkability Performance: A Comprehensive Approach to Assessment in Saifi Village, Beirut, Lebanon.” Urban Design International 14 (3): 139–151. doi:https://doi.org/10.1057/udi.2009.8.
- Anderson, J. 2004. “Talking Whilst Walking: A Geographical Archaeology of Knowledge.” Area 36 (3): 254–261. doi:https://doi.org/10.1111/j.0004-0894.2004.00222.x.
- Arshad, A. K., N. I. Bahari, W. Hashim, and A. G. Abdul Halim. 2016. “Gender Differences in Pedestrian Perception and Satisfaction on the Walkability of Kuala Lumpur City Center.” MATEC Web of Conferences 47 (July): 03003. doi:https://doi.org/10.1051/matecconf/20164703003.
- Balsas, C. J. L. 2017. “The Right to Walk in Cities, a Comparative Review of Macau, Lisbon and Las Vegas.” International Journal of Disaster Resilience in the Built Environment 9 (2): 123–142.
- Battista, G. A., and K. Manaugh. 2017. “Using Embodied Videos of Walking Interviews in Walkability Assessment.” Transportation Research Record: Journal of the Transportation Research Board 2661 (1): 12–18. doi:https://doi.org/10.3141/2661-02.
- Bereitschaft, B. 2017. “Equity in Microscale Urban Design and Walkability: A Photographic Survey of Six Pittsburgh Streetscapes.” Sustainability (Switzerland) 9 (7). doi:https://doi.org/10.3390/su9071233.
- Brown, B. B., C. M. Werner, J. W. Amburgey, and C. Szalay. 2007. “Walkable Route Perceptions and Physical Features: Converging Evidence for En Route Walking Experiences.” Environment and Behavior 39 (1): 34–61. doi:https://doi.org/10.1177/0013916506295569.
- Büscher, Monica,John Urry, Katian Witchger. 2011. Mobile Methods. London: Routledge
- Cambra, P., and J. Menteiro. 2012. Pedestrian Accessibility and Attractiveness Indicators for Walkability Assessment. Lisboa: Instituto Superior Tecnico.
- Carpiano, R. M. 2009. “Come Take a Walk with Me: The ‘Go-along’ Interview as a Novel Method for Studying the Implications of Place for Health and Well-Being.” Health and Place 15 (1): 263–272. doi:https://doi.org/10.1016/j.healthplace.2008.05.003.
- Cervero, R., and K. Kockelman. 1997. “Travel Demand and the 3Ds: Density, Diversity, and Design.” Transportation Research Part D: Transport and Environment 2 (3): 199–219. doi:https://doi.org/10.1016/S1361-9209(97)00009-6.
- City of Toronto. 2009. “City of Toronto Walking Strategy.”
- City Planning Administration. 2010. “THE WALKABLE CITY-Stockholm City Plan.”
- Clark, A., and N. Emmel. 2010. “Using Walking Interviews.” Reallities Toolkit 13: 1–6.
- Cubukcu, E. 2013. “Walking for Sustainable Living.” Procedia - Social and Behavioral Sciences 85: 33–42. Elsevier B.V. doi:https://doi.org/10.1016/j.sbspro.2013.08.335.
- Cubukcu, E., B. Hepguzel, Z. Onder, and B. Tumer. 2015. “Active Living for Sustainable Future: A Model to Measure ‘Walk Scores’ via Geographic Information Systems.” Procedia - Social and Behavioral Sciences 168: 229–237. Elsevier B.V. doi:https://doi.org/10.1016/j.sbspro.2014.10.228.
- Day, K., M. Boarnet, M. Alfonzo, and A. Forsyth. 2006. “The Irvine-Minnesota Inventory to Measure Built Environments: Development.” American Journal of Preventive Medicine 30 (2): 144–152. doi:https://doi.org/10.1016/j.amepre.2005.09.017.
- Doyle, S., A. Kelly-Schwartz, M. Schlossberg, and J. Stockard. 2006. “Active Community Environments and Health: The Relationship of Walkable and Safe Communities to Individual Health.” Journal of the American Planning Association 72 (1): 19–31. doi:https://doi.org/10.1080/01944360608976721.
- Duncan, D. T., J. Aldstadt, J. Whalen, S. J. Melly, and S. L. Gortmaker. 2011. “Validation of Walk Score® for Estimating Neighborhood Walkability: An Analysis of Four US Metropolitan Areas.” International Journal of Environmental Research and Public Health 8 (11): 4160–4179. doi:https://doi.org/10.3390/ijerph8114160.
- Evans, J., and P. Jones. 2011. “The Walking Interview: Methodology, Mobility and Place.” Applied Geography 31 (2): 849–858. Elsevier Ltd. doi:https://doi.org/10.1016/j.apgeog.2010.09.005.
- Ewing, R., and S. Handy. 2009. “Measuring the Unmeasurable: Urban Design Qualities Related to Walkability.” Journal of Urban Design 14 (1): 65–84. doi:https://doi.org/10.1080/13574800802451155.
- Ferrer, S., T. Ruiz, and L. Mars. 2015. “A Qualitative Study on the Role of the Built Environment for Short Walking Trips.” Transportation Research Part F: Traffic Psychology and Behaviour 33. Elsevier Ltd: 141–160. doi:https://doi.org/10.1016/j.trf.2015.07.014.
- Fincham, B., M. Mcguinness, and L. Murray. 2010. Mobile Methodologies. edited by L. Murray, B. Fincham, and M. McGuinness. London: Palgrave Macmillan.
- Forsyth, A. 2015. “What Is a Walkable Place? The Walkability Debate in Urban Design.” Urban Design International 20 (4): 274–292. Nature Publishing Group. doi:https://doi.org/10.1057/udi.2015.22.
- Forsyth, A., and M. Southworth. 2008. “Guest Editorial: Cities Afoot - Pedestrians, Walkability and Urban Design.” Journal of Urban Design 13 (1): 1–3. doi:https://doi.org/10.1080/13574800701816896.
- Frank, L. D., J. F. Sallis, T. L. Conway, J. E. Chapman, B. E. Saelens, and W. Bachman. 2006. “Many Pathways from Land Use to Health: Associations between Neighborhood Walkability and Active Transportation, Body Mass Index, and Air Quality.” Journal of the American Planning Association 72 (1): 75–87. doi:https://doi.org/10.1080/01944360608976725.
- Giles-Corti, B., G. Macaulay, N. Middleton, B. Boruff, F. Bull, I. Butterworth, H. Badland, S. Mavoa, R. Roberts, and H. Christian. 2014. “Developing A Research and Practice Tool to Measure Walkability: A Demonstration Project.” Health Promotion Journal of Australia 25 (3): 160–166. doi:https://doi.org/10.1071/HE14050.
- Giles-Corti, B., S. F. Kelty, S. R. Zubrick, and K. P. Villanueva. 2009. “Encouraging Walking for Transport and Physical Activity in Children and Adolescents: How Important Is the Built Environment?” Sports Medicine 39 (12): 995–1009. doi:https://doi.org/10.2165/11319620-000000000-00000.
- Hanibuchi, T., T. Nakaya, M. Yonejima, and K. Honjo. 2015. “Perceived and Objective Measures of Neighborhood Walkability and Physical Activity among Adults in Japan: A Multilevel Analysis of A Nationally Representative Sample.” International Journal of Environmental Research and Public Health 12 (10): 13350–13364. doi:https://doi.org/10.3390/ijerph121013350.
- Hein, J. R., J. Evans, and P. Jones. 2008. “Mobile Methodologies: Theory, Technology and Practice.” Geography Compass 2 (5): 1266–1285. doi:https://doi.org/10.1111/j.1749-8198.2008.00139.x.
- Higgs, C., H. Badland, K. Simons, L. D. Knibbs, and B. Giles-Corti. 2019. “The Urban Liveability Index: Developing a Policy-Relevant Urban Liveability Composite Measure and Evaluating Associations with Transport Mode Choice.” International Journal of Health Geographics 18 (1). BioMed Central: 1–25. doi:https://doi.org/10.1186/s12942-019-0178-8.
- Jones, P., G. Bunce, J. Evans, H. Gibbs, and J. R. Hein. 2008. “Exploring Space and Place with Walking Interviews.” Journal of Research Practice 4 (2): 1–9.
- Kim, S., S. Park, and J. Seung Lee. 2014. “Meso- or Micro-Scale? Environmental Factors Influencing Pedestrian Satisfaction.” Transportation Research Part D: Transport and Environment 30: 10–20. doi:https://doi.org/10.1016/j.trd.2014.05.005.
- Krambeck, H. V. 2006. The Global Walkability Index. Thesis. Massachusetts Institute of Technology.
- Kusenbach, M. 2003. “Street Phenomenology.” Ethnography 4 (3): 455–485. doi:https://doi.org/10.1177/146613810343007.
- Lashua, B., and S. Cohen. 2010. “Liverpool Musicscapes: Music Performance, Movement and the Built Urban Environment.” In Mobile Methodologies, edited by B. Fincham, M. Mcguinness, and L. Murray, 71–84. London: Palgrave Macmillan.
- Layeb, S. 2014. “Commented Walk, Segmented Walk: An Exploratory Study on the Relationship between Urban Space and Sound Stress.” Invisible Places.
- Leather, J., H. Fabian, S. Gota, and A. Mejia. 2011. “Walkability and Pedestrian Facilities in Asian Cities State and Issues.” Asian Development Bank Sustainable Development Working Paper Series, no. 17: 69.
- Lee, E., and J. Dean. 2018. “Perceptions of Walkability and Determinants of Walking Behaviour among Urban Seniors in Toronto, Canada.” Journal of Transport and Health 9 (January): 309–320. Elsevier Ltd. doi:https://doi.org/10.1016/j.jth.2018.03.004.
- Lee, J., and T. Ingold. 2006. “Fieldwork on Foot: Perceiving, Routing, Socializing.” In Locating the Field: Space, Place and Context, edited by S. Coleman and P. Collins, 67–86. Oxford: Berg Publishers.
- Lee, S., and E. Talen. 2014. “Measuring Walkability: A Note on Auditing Methods.” Journal of Urban Design 19 (3): 368–388. doi:https://doi.org/10.1080/13574809.2014.890040.
- Leslie, E., B. Saelens, L. Frank, N. Owen, A. Bauman, N. Coffee, and G. Hugo. 2005. “Residents’ Perceptions of Walkability Attributes in Objectively Different Neighbourhoods: A Pilot Study.” Health and Place 11 (3): 227–236. doi:https://doi.org/10.1016/j.healthplace.2004.05.005.
- Litman, T. A. 2004. “Economic Value of Walkability.” World Transport Policy & Practice 10 (1): 3–11. www.eco-logica.co.uk/WTPPhome.html.
- Lo, R. H. 2009. “Walkability: What Is It?” Journal of Urbanism 2 (2): 145–66. doi:https://doi.org/10.1080/17549170903092867.
- Mehta, V. 2008. “Walkable Streets: Pedestrian Behavior, Perceptions and Attitudes.” Journal of Urbanism 1 (3): 217–245. doi:https://doi.org/10.1080/17549170802529480.
- Merriman, P. 2014. “Rethinking Mobile Methods.” Mobilities 9 (2). Routledge: 167–187. doi:https://doi.org/10.1080/17450101.2013.784540.
- Middleton, J. 2018. “The Socialities of Everyday Urban Walking and the ‘Right to the City’.” Urban Studies 55 (2): 296–315. doi:https://doi.org/10.1177/0042098016649325.
- Moura, F., P. Cambra, and A. B. Gonçalves. 2017. “Measuring Walkability for Distinct Pedestrian Groups with A Participatory Assessment Method: A Case Study in Lisbon.” Landscape and Urban Planning 157 (May 2018): 282–296. Elsevier B.V. doi:https://doi.org/10.1016/j.landurbplan.2016.07.002.
- Park, S., E. Deakin, and J. S. Lee. 2014. “Perception-Based Walkability Index to Test Impact of Microlevel Walkability on Sustainable Mode Choice Decisions.” Transportation Research Record: Journal of the Transportation Research Board 2464 (1): 126–134. doi:https://doi.org/10.3141/2464-16.
- Rogers, S. H., J. M. Halstead, K. H. Gardner, and C. H. Carlson. 2011. “Examining Walkability and Social Capital as Indicators of Quality of Life at the Municipal and Neighborhood Scales.” Applied Research in Quality of Life 6 (2): 201–213. doi:https://doi.org/10.1007/s11482-010-9132-4.
- Rogers, S. H., K. H. Gardner, and C. H. Carlson. 2013. “Social Capital and Walkability as Social Aspects of Sustainability.” Sustainability 5 (8): 3473–3483. doi:https://doi.org/10.3390/su5083473.
- Sheller, M., and J. Urry. 2006. “The New Mobilities Paradigm.” Environment and Planning A 38 (2): 207–226. doi:https://doi.org/10.1068/a37268.
- Sohn, D. W., A. V. Moudon, and J. Lee. 2012. “The Economic Value of Walkable Neighborhoods.” Urban Design International 17 (2): 115–128. doi:https://doi.org/10.1057/udi.2012.1.
- Southworth, M. 2005. “Designing the Walkable City.” Journal of Urban Planning and Development 131 (4): 246–257. doi:https://doi.org/10.1061/(ASCE)0733-9488(2005)131:4(246).
- Spinney, J. 2015. “Close Encounters? Mobile Methods, (Post)phenomenology and Affect.” Cultural Geographies 22 (2): 231–246. doi:https://doi.org/10.1177/1474474014558988.Stockholm.
- Thibaud, J.-P. 2017. “Commented City Walks.” Journal of Mobile Culture 7: 1–32.
- Transport for London. 2005. Improving Walkability. Improving Walkability. London: Mayor of London.
- Valera Sosa, A., and C. Nickl-Weller. 2016. “Understanding Walkability and Walking Rates in Berlin: An Urban Form and Street Pattern Comparison.” Psychiatrie 13 (1): 79–87. doi:https://doi.org/10.1055/s-0038-1670123.
- Van Cauwenberg, J., V. Van Holle, I. De Bourdeaudhuij, D. Van Dyck, and B. Deforche. 2016. “Neighborhood Walkability and Health Outcomes among Older Adults: The Mediating Role of Physical Activity.” Health and Place 37: 16–25. doi:https://doi.org/10.1016/j.healthplace.2015.11.003.
- Van Dyck, D., G. Cardon, B. Deforche, N. Owen, and I. De Bourdeaudhuij. 2011. “Relationships between Neighborhood Walkability and Adults’ Physical Activity: How Important Is Residential Self-Selection?” Health and Place 17 (4). Elsevier: 1011–1014. doi:https://doi.org/10.1016/j.healthplace.2011.05.005.
- Van Dyck, D., G. Cardon, J. F. Benedicte Deforche, N. O. Sallis, and I. De Bourdeaudhuij. 2010. “Neighborhood SES and Walkability are Related to Physical Activity Behavior in Belgian Adults.” Preventive Medicine 50 (SUPPL.): 74–79. doi:https://doi.org/10.1016/j.ypmed.2009.07.027.
- Villaveces, A., L. A. Nieto, D. Ortega, J. F. Ríos, J. J. Medina, M. I. Gutiérrez, and D. Rodríguez. 2012. “Pedestrians’ Perceptions of Walkability and Safety in Relation to the Built Environment in Cali, Colombia, 2009–10.” Injury Prevention 18 (5): 291–297. doi:https://doi.org/10.1136/injuryprev-2011-040223.
- Yusuf, A., and A. Waheed. 2015. “Measuring and Evaluating Urban Wallkability through Walkability Indexes: A Case of Murree.” European Transport 1 59: 1–12
- Zhao, Y., and P. K. Chung. 2017. “Neighborhood Environment Walkability and Health-Related Quality of Life among Older Adults in Hong Kong.” Archives of Gerontology and Geriatrics 73 (December 2016). Elsevier: 182–186. doi:https://doi.org/10.1016/j.archger.2017.08.003.