
 ?Mathematical formulae have been encoded as MathML and are displayed in this HTML version using MathJax in order to improve their display. Uncheck the box to turn MathJax off. This feature requires Javascript. Click on a formula to zoom.
ABSTRACT
Motor lateralization is hypothesized to depend on the complexity of the motor function, but it might at the same time reflect hemispheric dominance within an individual across motor functions. We investigated possible motor lateralization patterns in four motor functions of different complexity (snout use in a manipulative task, foot use in two-stepping tasks and tail curling) in the domestic pig, a tetrapod species relevant as farm animal but also as a model in human neuroscience. A significant majority of our sample showed individual biases for manipulation with their snout and for curling their tail. Interestingly, the tail curling was lateralized towards the right at the population level and showed stronger lateralization patterns than the snout. Using a cluster analysis with combined tail and snout laterality, we identified groups of individuals with different lateralization patterns across motor functions that potentially reflect the individuals’ hemispheric dominance. To conclude, our results suggest that pigs show lateralization patterns that depend on the motor function and on the individual. Such individual lateralization patterns might have broader implications for animal personality and welfare. Our study lays the methodological groundwork for future research on laterality in pigs.
Introduction
Cerebral asymmetries are widespread in animals and are supposed to have an evolutionary advantage to improve brain efficiency by enabling the brain to perform more than one task simultaneously (Rogers, Zucca, & Vallortigara, Citation2004). These asymmetries are observable through behavioural lateralization, e.g., motor lateralization, which is expressed behaviourally through side biases. The best-studied example of motor lateralization is handedness in humans, with the majority of the human population being strongly lateralized at the individual level (individuals have a strong preference to use one hand over the other; Oldfield, Citation1971), and a population-wide bias towards the right (the majority is right-handed; Annett, Citation1985; Corballis, Citation2009). A number of studies show that motor lateralization is common in non-human vertebrates and even in invertebrates (Frasnelli, Citation2013; Rogers, Vallortigara, & Andrew, Citation2013; Ströckens, Güntürkün, & Ocklenburg, Citation2013), but findings are often disparate (Ströckens et al., Citation2013; Versace & Vallortigara, Citation2015).
The sometimes contradicting findings may be partially explained by the fact that different studies focus on different motor functions. According to the “task complexity hypothesis”, more complex tasks elicit stronger lateral biases on the individual level and are more likely to elicit population-level biases (Fagot & Vauclair, Citation1991). For example, in many primate species bimanual coordinated tasks, in contrast to simple (unimanual) tasks, elicit stronger hand preferences (reviewed by Hopkins, Citation2013) and sometimes a population bias (Molesti, Vauclair, & Meguerditchian, Citation2016). However, many species do not use their limbs for tasks of different complexity, such as walking and grabbing, which limits the testing of limb use in a variety of tasks. For this reason, some authors adapted the “task complexity hypothesis” into the “organ complexity hypothesis” (Keerthipriya, Tewari, & Vidya, Citation2015), which suggests that the strength of lateralization varies between different organs. Specifically, unpaired organs are suggested to be more complex than paired organs. For example, in food-reaching tasks, elephants are more strongly lateralized in the use of their trunk than their forefeet (Keerthipriya et al., Citation2015), and spider monkeys are more strongly lateralized in the use of their tail than their hands (Laska, Citation1998). From these conclusions, one can deduce that laterality varies across task and/or organ complexity. In this article, we will refer to these combined effects as “motor function complexity”. To get an overview of motor lateralization in a certain species, studies should ideally include different motor functions.
While the strength of lateralization can be influenced by the complexity of the task, we might also find consistent lateralization patterns within an individual, and variation between individuals. Indeed, “each individual has a tendency to use either its left or right hemisphere predominantly” (Rogers, Citation2009), which is assumed to be observable through individually consistent lateral preferences (Wright & Hardie, Citation2015). In this article, we used the term “individual hemispheric dominance” to describe this phenomenon. Many studies have found interactions between individual motor lateralization patterns and other individually distinct behavioural patterns, such as anxiety (Branson & Rogers, Citation2006; Hicks & Pellegrini, Citation1978; Wright & Hardie, Citation2012) or approach/avoidance behaviours (Hardie & Wright, Citation2014; Hopkins & Bennett, Citation1994; Watson & Ward, Citation1996), as a consequence of this individual hemispheric dominance. Thus, studying motor lateralization patterns on the individual level represents a promising approach in the study of personality, i.e., consistent individual behavioural differences over time and/or across situations (Réale, Reader, Sol, McDougall, & Dingemanse, Citation2007). Since personality plays an important role in an individual’s response to environmental challenges and therefore its welfare, the study of (motor) laterality could contribute to animal welfare research (Leliveld, Langbein, & Puppe, Citation2013; Rogers, Citation2010, Citation2011).
As the domestic pig (Sus scrofa) is one of the most intensively farmed species in the world and is progressively used as a model in human neuroscience (Kornum & Knudsen, Citation2011; Lind et al., Citation2007; Sauleau, Lapouble, Val-Laillet, & Malbert, Citation2009), it is important to know more about lateralization in this species. Apart from some indications on cerebral asymmetries (van der Beek et al., Citation2004) and some reports on side preferences during nursing in lactating sows (Gill & Thomson, Citation1956; Newberry & Wood-Gush, Citation1984; Špinka, Stěhulová, Zachařová, Maletínská, & Illmann, Citation2002), lateralization was never systematically studied in this species before.
Our study aim was to provide a first comprehensive overview of motor lateralization in the domestic pig. Thereby, we explored motor lateralization in three different organs: snout, foot and tail. We tested the snout use in a manipulative task, foot use was tested in two-stepping tasks, and we observed the direction during the spontaneous curling of the tail.
Pigs search for food, using their snout to explore, collect, carry, manipulate and even wash food items (Gundlach, Citation1968; Sommer, Lowe, & Dietrich, Citation2016; Stolba & Wood-Gush, Citation1989). Therefore, the pig snout seems to fulfil similar functions as the hands of primates or the trunks of elephants, making it suitable for studying motor lateralization. As even-toed ungulates (Artiodactyla), their foot use represents another important motor function. A third interesting and easily observable motor function of the pig is the curling of the tail. Tail curling behaviour was found to occur more often during interactions with a familiar person (Kleinbeck & McGlone, Citation1993), while other authors (Reimert, Bolhuis, Kemp, & Rodenburg, Citation2013) recently found that this behaviour occurs in more neutral emotional contexts, in comparison to tail wagging (more in positive contexts) or tail hanging (more in negative contexts).
The “motor function complexity hypothesis” suggests that the snout, being the most complex function (an unpaired organ performing a manipulative task), would show the strongest lateralization patterns, while the feet (as paired organs performing a simple stepping task) would show the weakest lateralization patterns. In addition, we expected to find individual lateralization patterns across motor functions (as an indication of an individual’s hemispheric dominance), when all motor lateralization patterns were combined.
Materials and methods
Ethical note
The experimental procedure was approved by the ethics committee of the federal state of Mecklenburg-Western Pomerania, Germany (LALLF M-V/TSD/77221.3-2-040/14-1).
Animals and housing
The study was conducted at the Experimental Facility for Pigs of the Leibniz Institute for Farm Animal Biology (FBN), Dummerstorf, Germany. The subjects were 80 (among 100 pre-selected; see below) pre-pubertal, uncastrated male German Landrace piglets (aged 5–7 weeks during the experimental period). Experiments were performed with five consecutive replicates between November 2014 and May 2015. As a standard procedure of the Experimental Facility for Pigs, within the first 24 hours after birth, the tip of the tail (maximal length of 1 cm) was routinely clipped off. Before weaning, the subjects were submitted to 4 backtests (at the age of 5, 12, 19 and 26 days) to determine their coping style, using the standardized method of Zebunke, Repsilber, Nürnberg, Wittenburg, and Puppe (Citation2015). At 4 weeks of age, 20 individuals were pre-selected from a greater pool based on their health status, absence of injuries (including a tail without injuries), weight (greater than 5 kg), and their coping style (preferring active and passive over doubtful/intermediate coping styles; these results will be discussed in another publication). The number of full siblings was set to a maximum of 4 for preselection.
The pre-selected pigs were weaned (day 0) and grouped together in a pen (3.75 × 1.8 m, with fully slatted plastic floors and a solid heated area in the middle), where they had access to food and water ad libitum. From days 3–5 post-weaning, the pigs were habituated to being handled by the experimenter (2 sessions of 1 hour per day) who distributed during each session two handfuls of chocolate raisins in the pen in order to habituate the pigs to the food reward. Chocolate raisins are common rewards used in pig behavioural studies (Gieling, Nordquist, & van der Staay, Citation2011). On day 6, each pig was guided to the corridor that was adjacent to the pen and stayed there, physically isolated from the group for a maximum of 10 minutes. During this time, 5 chocolate raisins were thrown on the floor of the corridor, and each individual was assessed on its motivation to eat when alone (varying from 1 to all raisins eaten). For the experiment, we selected 16 individuals using the following criteria (in order of importance): the absence of illness/injuries, eating the reward alone, active or passive coping style, relatedness to other subjects (avoidance of full siblings where possible) and the absence of nervousness. Each subject was randomly given an ID-number, which determined the test order throughout the entire experiment. At the end of the last handling day (day 6), the 20 pigs were moved into a new pen (2.50 × 3.95 m) with fully slatted plastic floors and two solid concrete sections. This pen was in the same room as the experimental arena (see below for the setup description). During the experimental period, the subjects were fed an age-appropriate ration once per day after the last session of the day. This setup was used to ensure standardized motivation among subjects for performing the food-retrieval test. Water was available ad libitum, and straw and some other physical enrichments (buckets, rags, etc.) were provided twice a day during the entire experimental period.
Snout and foot use
Experimental setup
Lateralized manipulation with the snout and foot use were tested in a symmetrical arena (1.5 × 1.5 m, see ). This arena was connected to the home pen through a corridor (51 × 185 cm) that was used as a waiting area (between trials). A sliding guillotine door (39 × 45 cm) that could be operated from the corridor was used to provide access to the arena. A ramp was placed at the end of the corridor, creating a 6.5-cm high step into the arena. In the arena, on the opposite side of the sliding door, a flap door (22 × 30 cm) was integrated in the middle of the wall (105 cm high). Behind this flap door, a trough (5 cm high) containing a food reward (one chocolate raisin) was positioned. A fixed tube was used to ensure that the raisin was always positioned in the middle of the trough. After the 6 training sessions (18 trials), the setup was modified for the test situation: a fixed barrier (26 × 57 cm) was placed 15 cm in front of the flap door, so that the subjects were forced to approach the flap door from the side and then use the left or right side of the snout to open it.
Figure 1. Schema of the testing arena. The curved arrows at the top indicate how the subject may have opened the flap door in each case. The pale arrow indicates that they opened the flap door with the right side of the snout, and the dark arrow indicates that they opened the door with the left side of the snout. The numbers describe the testing procedure per trial: 1. Foot down; 2. Manipulation with the snout to open the flap door; 3. Foot-up.
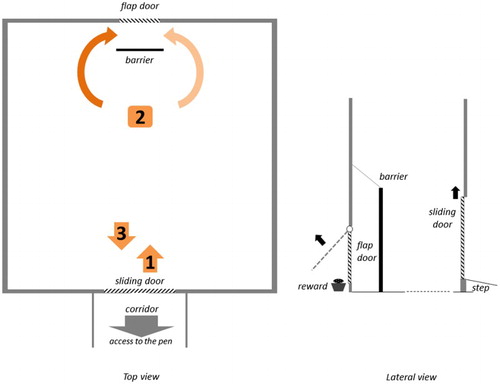
A camera was positioned on the wall above the flap door and was focused on the entrance of the sliding door. Another camera, connected to a digital video recorder, was positioned centrally above the arena.
Experimental procedure
The experimental period consisted of 10 working days. The training period began on day 8 and consisted of 6 sessions across 4 working days (2 sessions per day on days 8 and 11 and 1 session per day on days 12 and 13). The test period began on day 13 (after the last training session) and consisted of 10 sessions across 7 working days (2 sessions per day on days 14, 15 and 18 and 1 session per day on day 13 and days 19 through 21). In total, each pig performed a maximum of 30 trials. Morning sessions were performed between 08:00 and 10:00 and afternoon sessions between 11:30 and 14:00.
To improve the training’s efficiency by using social facilitation, the first three sessions were performed with randomly paired pigs. New pairs were formed for each session so that each subject could learn to access the reward in a short amount of time. The last three training sessions were performed with the subject alone; this was done to habituate the pigs to the testing procedure, which was also performed alone. The barrier (before it was fixed in the arena) was presented in the home pen for 10 minutes once per day during the last three training days, so that the subjects were habituated to it before the start of the test sessions.
Before each session, the experimenter entered the pen and gently guided a subject into the corridor. The subject was then offered a chocolate raisin while waiting in the corridor. Each trial consisted of the following procedure (see the video in the supplemental data): The experimenter pulled up the sliding door and the subject entered the arena. When a subject successfully opened the flap door and retrieved the chocolate raisin, the sliding door was re-opened. In the corridor, the subject received another chocolate raisin. The experimenter put a new raisin in the trough. If the raisin was still there, the measurement for snout use was counted as “failed”. Since only 0.03% of all trials were counted as failed, these trials were not included in the analysis. Per session, this procedure was repeated 3 times (i.e., for a total of 3 trials). A session finished after the third successful retrieval of the food reward, or when a maximum of 10 minutes had passed. At the end of the session, the experimenter opened the door connecting the corridor to the pen, so that the subject could return to the pen. Between subjects, the experimenter cleaned the floor of the arena as well as the barrier and flap door.
Tail curling direction
The tails were observed before and after each experimental session (6 training + 10 test sessions). A total of 32 observations per subject were made. The observations were done in the following way: The experimenter entered the pen, provided either fresh straw or some toys (rags, shoes) to the pigs and noted the curling direction from pigs that were either standing or walking. The order of observations was determined by the behaviour of the pigs: The moment a pig with a curled tail was spotted, the direction was noted down.
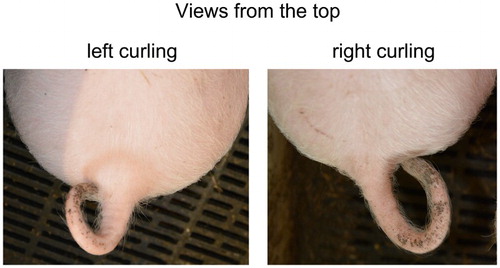
Three observations were possible (): left curling (L; the tip of the tail is situated to the left of the base), right curling (R; the tip of the tail is situated to the right of the base) or an “unclear” curling (mostly curling in the middle; the tip of the tail showed no clear deviation from the middle). Observations of “unclear” curling were excluded from further analyses.
Figure 2. Examples of clear tail curling directions.
Behavioural analyses
Observations of snout and foot use were performed using video recordings by the same observer. As the subject entered the arena, the front foot that entered the arena first was observed (: “1. Foot down”). When a subject successfully opened the flap door and retrieved the chocolate raisin, the side of the snout used was observed (: “2. Snout use”). As the subject exited the arena, the front foot that entered the corridor first was observed (: “3. Foot-up”). To ensure the reliability of the video observations, we compared a sample of observations from one randomly selected replicate (2 test sessions, 96 trials) with a second observer and obtained the following Kappa coefficients: 0.92 for the snout, 0.81 for foot down and 0.82 for foot-up, which indicated almost perfect agreement.
Statistical analyses
We used SAS version 9.4 (SAS Institute Inc., Cary, NC, USA) for our statistical analyses. To determine if an individual had a significant bias for one side over the other, we used a simplified binomial test. For this, we calculated an individual z-score (Branson & Rogers, Citation2006) using the formula:where R is the number of right choices and L is the number of left choices. A z-score ≤ −1.96 indicates a left bias (L), a z-score ≥ 1.96 indicates a right bias (R), and a value between these two scores indicates no lateral bias (i.e., ambilateral; A). Using a chi-square test (FREQ procedure), we determined if a significant majority of the subjects were lateralized. To test this, we compared the number of L- and R-individuals with the number of A-individuals (H0: distributions R + L= 50%; A = 50%). If there were significantly more lateralized individuals, we also compared the number of R-individuals with the number of L-individuals (H0: R = 50%, L = 50%). If we found a significant difference between the amount of L- vs. R-individuals, we finally determined if our tested population had a significant bias for the left or the right for each motor function (i.e., for an R population bias, H0: R = 50%, L + A = 50%). In addition, we also calculated a continuous laterality index (LI; adapted from Hopkins, Citation1999) for each subject and motor function by using the formula:
where R is the number of right observations and L is the number of left observations. This index ranges from −1 to 1, with positive values reflecting a right bias and negative values a left bias. The absolute value of LI (LI_ABS) was used to indicate the strength of laterality. In this case, the index ranged from 0 to 1, with low values reflecting a weak bias and high values reflecting a strong bias. To provide a graphical representation of distribution across these indices, we used JMP 12.0.1 (SAS Institute Inc., Cary, NC, USA). We transformed our distribution data into a smoothed curve, using a Kernel standard deviation of 0.1063. This smoothed curve was then visually compared to different adapted distribution models (normal or a mixture of several normal distributions) to determine the type of distribution.
We tested for trial effects by comparing the number of L vs. R choices for snout use between the beginning (trials 1–14) and the end (trials 15–30) of the testing. Using the MIXED procedure, an analysis of variance (ANOVA) was calculated with the percentage of choices (L or R) as a variable and the phase of testing (beginning or end) as a fixed factor. We also compared the strength of lateralization between the different motor functions using the MIXED procedure; an ANOVA was calculated with LI_ABS as a variable and the motor function as a fixed factor. Multiple pairwise comparisons were calculated using Tukey-Kramer tests. To control for the effect of replicates, we performed the same ANOVA with the LI and the LI_ABS as variables and the replicate as a fixed factor.
A chi-square (FREQ procedure) test was performed to test for associations between the different motor functions. To detect individual lateralization patterns across motor functions, we used a cluster analysis to obtain a combined laterality classification. For this analysis, we selected the LIs of motor functions that followed a bimodal distribution. These LIs were first standardized using the STDIZE procedure. Next, we performed the FASTCLUS procedure (maxiter = 100, strict = 0.9, nomiss). STRICT prevents an observation from being assigned to a cluster if its distance to the nearest cluster seed exceeds the value assigned to the STRICT variable. We tested for 2, 3, 4 and 5 clusters (i.e., maxcluster = 2, 3, 4 and 5) to determine the number of clusters that best represented the variation in the data. The reliability of the model is given by the cubic clustering criterion (CCC values greater than 2 or 3 indicate good clusters) combined with a graphical verification. For a continuous representation of the combined laterality, we calculated a combined LI for each individual, based on the mean of the laterality indices that were included in the cluster analysis. A graphical representation of the distribution across this index was created in JMP 12.0.1 (SAS Institute Inc., Cary, NC, USA).
Results
For technical reasons, we could not observe the foot use during the first replicate (n = 16). During the food-retrieval test, all subjects learned to open the flap door, but four subjects were excluded from the snout and foot-use analyses because they could not learn to eat the reward alone. Two other subjects were excluded from the tail analyses because the number of R and L observations was not sufficient to perform the individual binomial tests. This resulted in the following sample sizes per motor function: n = 76 for snout, n = 60 for foot-up and foot down and n = 78 for tail curling.
There was no effect of the test phase (beginning vs. end) on the percentage of R or L choices for snout use, F(2, 211.1) = 0.3, p = .74. We found a significant effect of the replicate on the strength of snout laterality, F(4, 71) = 5.7, p < .001. The pairwise comparisons revealed that the second replicate showed significantly weaker snout laterality compared to the fourth, t(71) = −3.78, p < .01, and the last, t(71) = −3.39, p < .01, replicates, while the third replicate showed significantly weaker snout laterality compared to the fourth replicate, t(71) = −3.13, p < .05.
Lateralization patterns by motor function
and show the distributions for all motor functions across the different laterality categories and indices, respectively. For snout, significantly more individuals were lateralized than not lateralized, Χ2 = 278.421, DF = 1, p < .001, n = 76. The number of individuals with a bias for the right side of the snout did not differ significantly from the number of individuals with a bias for the left side, Χ2 = 0.1475, DF = 1, p = .7009, n = 61. shows the distribution of the tested population for the snout LI. The smooth curve plotted by JMP was found to resemble an adapted mixture of two normal distributions, with two peaks at the extremes (at LI = −1 and LI = 1).
Figure 3. Distribution of the individuals according to their laterality indices (with an increment of 0.1). Positive values reflect a right bias and negative values a left bias. Solid lines indicate the smooth curve that is plotted in JMP. Dashed lines indicate the calculated mixture of two normal functions, and dotted lines indicate the calculated approximation of a normal function.
Table 1. The number of subjects per laterality category for each motor function (based on the binomial test).
Significantly more individuals were ambilateral than lateralized for stepping down, or into, and stepping up, or out of, the experimental arena (foot down: Χ2 = 416.667, DF = 1, p < .001, n = 60; foot-up: Χ2 = 192.667, DF = 1, p < .001, n = 60). shows the distribution of the foot laterality indices. The smooth curves plotted by JMP were found to resemble a normal distribution, with one peak at LI = 0.
For tail curling, significantly more individuals were lateralized than not lateralized, Χ2 = 702.051, DF = 1, p < .001, n = 78. There were significantly more individuals with a right bias for tail curling than individuals with a left bias, Χ2 = 52.632, DF = 1, p = .0218, n = 76. There were also significantly more right-biased individuals compared to non-right-biased individuals (L + A subjects), which indicates a population-level right bias for the tail curling direction, Χ2 = 41.538, DF = 1, p = .0415, n = 78. shows the distribution of the tested population for the tail LI. The smooth curve plotted by JMP was found to resemble an adapted mixture of two normal distributions, with a high peak at LI = 1 (right) and a somewhat lower peak at LI = −1 (left).
The comparison of the LI_ABS between the different motor functions is shown in . The motor function had an effect on the strength of laterality, F(3, 71.6) = 408.5, p <.001. The pairwise comparisons revealed that the LI_ABS for tail was significantly the highest (compared to snout: t(76.7) = −6.05; foot down: t(78.0) = −32.0; foot-up: t(71.5) = −23.5; all p < .001). The LI_ABS for snout was still higher than the LI_ABS for both foot functions (foot down: t(74.8) = −14.0; foot-up: t(72.2) = −12.4; all p < .001).
Figure 4. Absolute values of the laterality indices for the different motor functions (LS means and standard errors).
Individual lateralization patterns across motor functions
The LI for snout use and tail curling showed a bimodal distribution, while the LI for the two-foot functions showed a normal distribution; thus, we only included the LIs of snout and tail curling in the analysis of a combined laterality classification. The snout side categories were not significantly associated with the tail curling direction categories (Χ2 = 2.7688, DF = 4, p = .597228, n = 74; see ).
Table 2. The number of subjects per combined tail and snout bias (based on the binomial test).
Using the FASTCLUS procedure, we obtained 4 reliable clusters (CCC = 14.17, n = 74; ). We could distinguish four main clusters located in the four quadrants of the two-dimensional space that is created by the snout and tail LIs. As seen in the graphical representation (), there were 18 right-biased (for both functions) subjects in the RR cluster, 12 left-biased (for both functions) subjects in the LL cluster, 15 subjects in the RL cluster (right biased for snout use and left biased for tail curling), and 25 subjects in the LR cluster (right biased for tail curling and left biased for snout use). Based on the STRICT criterion (0.9), four individuals were not assigned to any of these clusters. Note that the classification based on cluster analysis can deviate from the classification based on the binomial tests.
Figure 5. Graphical representation of the cluster analysis: Each individual is positioned on the graph according to its laterality indices (LIs) for snout (x-axis) and tail (y-axis). Positive values reflect a right bias and negative values a left bias. The various filled symbols indicate the different clusters: The first letter indicates the direction (R for right, L for left) of the bias for the snout, the second letter indicates the direction of the bias for the tail. Crosses indicate subjects that were not assigned to any cluster (due to a distance greater than 0.9 from the centre of any cluster).
shows the distribution of the tested population for the combined LI, which is the mean of the laterality indices of both lateralized motor functions (tail and snout). The smooth curve was found to resemble an adapted mixture of three normal distributions, with two peaks at the extremes (at LI = −1 and LI = 1) and one peak in the middle (at LI = 0).
Figure 6. Distribution of the individuals according to their combined LI (with an increment of 0.1). Positive values reflect a right bias and negative values a left bias. The solid line indicates the smooth curve that is plotted in JMP. The dashed line indicates the calculated approximation of a mixture of three normal functions.
Discussion
We found that most of the pigs had a significant side bias for manipulating with their snout and curling their tail, indicating lateralization on the individual level. We also found a significant right bias at the population level for the tail curling direction. In contrast, there was no evidence of lateralized foot use in either stepping task since only a minority of the pigs showed significant biases for stepping down or stepping up. Concerning the strength of laterality, we found that pigs were more strongly lateralized for tail curling, followed by manipulation with the snout, for which they were still more strongly lateralized than for the two-foot functions.
Lateralization patterns by motor function
Concerning manipulation with the snout, our findings of individual-level lateralization are comparable to findings in other species on motor biases for manipulation, e.g., hand use in primates (Marchant & McGrew, Citation2013), trunk use in elephants (Martin & Niemitz, Citation2003) and paw use in other tetrapod species (Bisazza, Rogers, & Vallortigara, Citation1998; Ströckens et al., Citation2013). Mastication has been found to be symmetrical in pigs (Herring, Citation1976), so it is unlikely that any preferences to eat the food reward on one side of the mouth may have affected the side bias for opening the flap door. Training in other species has been found to modify lateralization patterns, leading to stronger biases (Leliveld, Scheumann, & Zimmermann, Citation2008) or even shifts in the direction of the biases (Lorincz & Fabre-Thorpe, Citation1994). Here, we found no trial effect on the lateralized manipulation with the snout, suggesting that the observed lateralized behaviours reflect individual side biases, rather than a learned process during this task. However, though we observed side biases in motor functioning, we cannot exclude the possibility that sensory (olfactory or visual) functions may have affected these side biases. For instance, Hook and Rogers (Citation2008) found no population-level hand preferences in marmosets, but a right eye preference at the group level. These authors suggested that this sensory function interfered with the motor tasks, causing a lack of population-level alignment in hand preferences. In our case, further research is needed on individual nostril and eye preferences to determine if sensory processing may have affected the snout biases that we observed.
Concerning the foot, our results are not in line with results in dogs (Tomkins, Thomson, & McGreevy, Citation2010), where the authors found that a stepping task (consisting of three steps) elicited strong individual preferences and a population bias. Since our stepping task consisted of only one step, this task may not have been challenging enough to elicit foot preferences. Our results are similar to those found in other ungulate species, where no preference in the use of forefeet was found for standing (Austin & Rogers, Citation2012, Citation2014) or locomotion (Langbein, Citation2012; Versace, Morgante, Pulina, & Vallortigara, Citation2007). However, individual foot preferences may still be found for other (more complex) functions since a digging task elicited individual foot preferences in another Artiodactyla species (the reindeer: Espmark & Kinderås, Citation2002).
Our findings of strong individual biases for tail curling are in line with findings of lateralized tail posture in rats (Rosen, Berrebi, Yutzey, & Denenberg, Citation1983) and spider monkeys (Laska & Tutsch, Citation2000; Stevens, Wright, Covert, & Nadler, Citation2008). In rats, tail posture was found to be associated with cerebral metabolic asymmetries (Rosen, Finklestein, Stoll, Yutzey, & Denenberg, Citation1984; Ross, Glick, & Meibach, Citation1981), meaning tail curling direction may also reflect cerebral asymmetries in pigs. Surprisingly, we found that tail curling is also lateralized at the population level. Lateralized behaviour at the population level is suggested to have evolved as a consequence of an increased need for social coordination (Vallortigara & Rogers, Citation2005). Indeed, our results are comparable to reports of population-level biases for other motor functions that are used in social interactions, such as communication mechanisms (Meguerditchian & Vauclair, Citation2006; Meguerditchian, Molesti, & Vauclair, Citation2011; Wallez & Vauclair, Citation2012). Tail postures are components of the global body posture “which may have a communication value without having necessarily evolved to serve as a signal” (Kiley-Worthington, Citation1976). Indeed, lateralized tail wagging has been found to reflect a dog’s emotional state (Quaranta, Siniscalchi, & Vallortigara, Citation2007), as well as affect the emotional state of other dogs (Siniscalchi, Lusito, Vallortigara, & Quaranta, Citation2013), suggesting a relevance for intra- and inter-specific interactions (Artelle, Dumoulin, & Reimchen, Citation2011; Siniscalchi et al., Citation2013). Additionally, the tail posture of pigs was found to vary according to the emotional context (Reimert et al., Citation2013), which is the first prerequisite for emotional communication. Because tail curling does not occur in wild boars (Jensen, Citation2002), it may have emerged in domestic pigs during the domestication process. Similarly, tail up in adult domestic cats has been shown to play a social function that is not found in adult wild cats (Cafazzo & Natoli, Citation2009). This behaviour may be partly explained by a need for domestic cats to communicate with humans (Cafazzo & Natoli, Citation2009). Additionally, domestic pigs show the curled tail more often during interactions with a familiar person (Kleinbeck & McGlone, Citation1993), suggesting it may have a function in interactions with humans. Based on this, tail posture in pigs may play a role in social interactions, either with conspecifics or with humans; however, this possibility needs to be further investigated. The right population bias could result from a left hemispheric specialization for communication, as is shown in humans (Knecht et al., Citation2000) and non-human animals (e.g., Meguerditchian & Vauclair, Citation2006; Siniscalchi, Laddago, & Quaranta, Citation2016). However, this right population bias may also result from a left hemispheric specialization for approach behaviours in rewarding contexts, especially in the context of feeding (e.g., Rogers et al., Citation2013; Rogers & Andrew, Citation2002; Siniscalchi et al., Citation2011). During our tail curling observations, the rewarding context may have consisted of a familiar human entering the home pen with enrichments. Alternatively, the population bias in tail curling may be the result of a morphological directional asymmetry, which is described as an inherited trait where most individuals are asymmetrical in one direction (Palmer, Citation2004). One example of this is claws of crabs that differ in size (Perez, Heatwole, Morrell, & Backwell, Citation2015). Future studies on the (muscular) structure of the tail would help increase our understanding of its function and determine if lateralized tail curling is the result of a morphological asymmetry or not. Our work here does not permit us to conclude the exact function of the pig’s tail, but the simplicity of measuring its laterality makes this organ very attractive for future laterality research on pigs. This has implications for the common practice of tail docking in pig husbandry to reduce tail biting (Sutherland & Tucker, Citation2011).
As predicted by the “motor function complexity hypothesis”, we found significant differences in the strength of lateralization between the tested motor functions. The fact that we found the weakest biases for the foot use (i.e., stepping up and down) suggests that these motor functions are less complex than the motor functions that involved unpaired organs (snout and tail). As such, our results seem to align with the “organ complexity hypothesis” (Keerthipriya et al., Citation2015). Surprisingly, tail curling elicited stronger biases than manipulation with the snout, which seems to contradict the “task complexity hypothesis” (Fagot & Vauclair, Citation1991). However, as discussed above, this finding may be because tail curling behaviour may be a more complex function (with a social-emotional component) than we expected. Alternatively, our results may also support the suggestion of Rogers (Citation2009), which states that the nature of tasks, rather than their complexity, explains the differences found between laterality patterns.
Individual lateralization patterns across motor functions
We found no significant associations between the individual biases for tail curling and for manipulation with the snout. This lack of consistency in direction across both functions may be partially due to the involvement of sensory processing in the snout manipulation function, which we discussed previously. Nevertheless, our results are in line with previous findings in rats (Noonan & Axelrod, Citation1989) and marmosets (Hook & Rogers, Citation2008), where no associations between lateralized functions were found. Additionally, Laska (Citation1998) found no associations between the use of tail and hand for grasping in spider monkeys. This led the author to suggest that the lateral biases in hand and tail use are driven by different neural substrates. In addition, similar observations have been made in rats (Noonan & Axelrod, Citation1989) and humans (Bracha, Seitz, Otemaa, & Glick, Citation1987; Mohr & Bracha, Citation2004; Mohr, Landis, Bracha, & Brugger, Citation2003), where the authors suggested that individual left or right hemispheric dominance does not necessarily lead to consistency between every single behavioural asymmetry (Noonan & Axelrod, Citation1989).
Since laterality is multidimensional, it is suggested that non-human animal studies should take this aspect into account by including several motor functions (Uomini & Hunt, Citation2016). In this study, we used a cluster analysis to gain more insight into an individual’s lateralization pattern across functions. This cluster analysis was based on the individual laterality indices (for the two lateralized functions), which contain more detailed information than the lateralization categories. Therefore, the advantage of the cluster analysis, in contrast to a simple combination of lateralization categories, is that it takes the intra-individual structure for both functions into account (Granero et al., Citation2016; Tran, Stieger, & Voracek, Citation2014). The resulting distribution provides a first insight into potentially different brain organizations in domestic pigs with four different laterality types. We found two clusters (RL and LR) where manipulation with the snout and tail curling resulted in different biases. This may indicate that these individuals have no strong tendency to use one hemisphere more than the other. However, since this is a first approximation of an individual’s lateralization pattern across functions and is based on only two motor functions, it is also probable that not enough biases are included to identify their individual hemispheric dominance. In contrast, the RR and LL clusters seem to include individuals with a more consistent lateralization pattern across motor functions, suggesting that they are more likely to be right or left hemispheric dominant, respectively. Based on previous reports in humans (Knecht et al., Citation2000; Pujol, Deus, Losilla, & Capdevila, Citation1999), these two groups may also be expected to present a high probability of showing qualitatively different cerebral patterns. Accordingly, these two opposite clusters could also be distinguishable in their personality (Rogers, Citation2009). In a future publication, we plan to focus on the interactions between motor lateralization patterns and personality indices.
Conclusion
Our study contributes to a better understanding of motor lateralization in pigs in general, and particularly adds an insight into the rarely documented laterality of unpaired organs. We found stronger lateralization patterns for the two unpaired organs compared to the paired organs, supporting the organ complexity hypothesis. Cluster analyses revealed first indications of potentially different brain organizations in pigs, according to their individual lateralization patterns across motor functions. To our knowledge, this study provides the first comprehensive investigation of motor lateralization patterns in the domestic pig. The developed methods provide a good basis to further study laterality in domestic pigs.
Acknowledgements
The authors would like to thank Evelin Normann, Heinz Deike, Katrin Siebert and Jenny Stracke for technical support in the execution of experiments and analysis of the data and Christian Nawroth for helpful comments on the manuscript. We would also like to thank the staff of the Experimental Facility for Pigs (EAS) of the Leibniz Institute for Farm Animal Biology for taking care of the animals and for all of their help during the execution of the experiments.
Disclosure statement
No potential conflict of interest was reported by the authors.
Additional information
Funding
References
- Annett, M. (1985). Left, right, hand and brain: The right shift theory. Hove: Lawrence Erlbaum.
- Artelle, K. A., Dumoulin, L. K., & Reimchen, T. E. (2011). Behavioural responses of dogs to asymmetrical tail wagging of a robotic dog replica. Laterality: Asymmetries of Body, Brain and Cognition, 16, 129–135. doi: 10.1080/13576500903386700
- Austin, N., & Rogers, L. J. (2012). Limb preferences and lateralization of aggression, reactivity and vigilance in feral horses, Equus caballus. Animal Behaviour, 83, 239–247. doi: 10.1016/j.anbehav.2011.10.033
- Austin, N., & Rogers, L. J. (2014). Lateralization of agonistic and vigilance responses in Przewalski horses (Equus przewalskii). Applied Animal Behaviour Science, 151, 43–50. doi: 10.1016/j.applanim.2013.11.011
- Bisazza, A., Rogers, L. J., & Vallortigara, G. (1998). The origins of cerebral asymmetry: A review of evidence of behavioural and brain lateralization in fishes, reptiles and amphibians. Neuroscience and Biobehavioral Reviews, 22, 411–426. doi: 10.1016/S0149-7634(97)00050-X
- Bracha, H. S., Seitz, D. J., Otemaa, J., & Glick, S. D. (1987). Rotational movement (circling) in normal humans: Sex difference and relationship to hand, foot and eye preference. Brain Research, 411, 231–235. doi: 10.1016/0006-8993(87)91074-2
- Branson, N. J., & Rogers, L. J. (2006). Relationship between paw preference strength and noise phobia in Canis familiaris. Journal of Comparative Psychology, 120, 176–183. doi: 10.1037/0735-7036.120.3.176
- Cafazzo, S., & Natoli, E. (2009). The social function of tail up in the domestic cat (Felis silvestris catus). Behavioural Processes, 80, 60–66. doi: 10.1016/j.beproc.2008.09.008
- Corballis, M. C. (2009). The evolution and genetics of cerebral asymmetry. Philosophical Transactions of the Royal Society of London B: Biological Sciences, 364, 867–879. doi: 10.1098/rstb.2008.0232
- Espmark, Y., & Kinderås, K. (2002). Behavioural lateralisation in reindeer. Rangifer, 22, 51–59. doi: 10.7557/2.22.1.687
- Fagot, J., & Vauclair, J. (1991). Manual laterality in nonhuman primates: A distinction between handedness and manual specialization. Psychological Bulletin, 109, 76–89. doi: 10.1037/0033-2909.109.1.76
- Frasnelli, E. (2013). Brain and behavioral lateralization in invertebrates. Frontiers in Psychology, 4, 939. doi: 10.3389/fpsyg.2013.00939
- Gieling, E. T., Nordquist, R. E., & van der Staay, F. J. (2011). Assessing learning and memory in pigs. Animal Cognition, 14, 151–173. doi: 10.1007/s10071-010-0364-3
- Gill, J. C., & Thomson, W. (1956). Observations on the behaviour of suckling pigs. The British Journal of Animal Behaviour, 4, 46–51. doi: 10.1016/S0950-5601(56)80022-1
- Granero, R., Fernández-Aranda, F., Baño, M., Steward, T., Mestre-Bach, G., del Pino-Gutiérrez, A., … Tárrega, S. (2016). Compulsive buying disorder clustering based on sex, age, onset and personality traits. Comprehensive Psychiatry, 68, 1–10. doi: 10.1016/j.comppsych.2016.03.003
- Gundlach, H. (1968). Brutfürsorge, brutpflege, verhaltensontogenese und tagesperiodik beim europäischen wildschwein (Sus scrofa L.). Ethology, 25, 955–995. doi: 10.1111/j.1439-0310.1968.tb00054.x
- Hardie, S. M., & Wright, L. (2014). Differences between left- and right-handers in approach/avoidance motivation: Influence of consistency of handedness measures. Frontiers in Psychology, 5, 134. doi: 10.3389/fpsyg.2014.00134
- Herring, S. W. (1976). The dynamics of mastication in pigs. Archives of Oral Biology, 21, 473–480. doi: 10.1016/0003-9969(76)90105-9
- Hicks, R. A., & Pellegrini, R. J. (1978). Handedness and anxiety. Cortex, 14, 119–121. doi: 10.1016/S0010-9452(78)80014-8
- Hook, M. A., & Rogers, L. J. (2008). Visuospatial reaching preferences of common marmosets (Callithrix jacchus): An assessment of individual biases across a variety of tasks. Journal of Comparative Psychology, 122, 41–51. doi: 10.1037/0735-7036.122.1.41
- Hopkins, W. D. (1999). On the other hand: Statistical issues in the assessment and interpretation of hand preference data in nonhuman primates. International Journal of Primatology, 20, 851–866. doi: 10.1023/A:1020822401195
- Hopkins, W. D. (2013). Comparing human and nonhuman primate handedness: Challenges and a modest proposal for consensus. Developmental Psychobiology, 55, 621–636. doi: 10.1002/dev.21139
- Hopkins, W. D., & Bennett, A. J. (1994). Handedness and approach-avoidance behavior in chipanzees (Pan). Journal of Experimental Psychology: Animal Behavior Processes, 20, 413–418. doi: 10.1037/0097-7403.20.4.413
- Jensen, P. (2002). The ethology of domestic animals : An introductory text. New York: CABI.
- Keerthipriya, P., Tewari, R., & Vidya, T. N. C. (2015). Lateralization in trunk and forefoot movements in a population of free-ranging Asian elephants (Elephas maximus). Journal of Comparative Psychology, 129, 377–387. doi: 10.1037/com0000013
- Kiley-Worthington, M. (1976). The tail movements of ungulates, canids and felids with particular reference to their causation and function as displays. Behaviour, 56, 69–114. doi: 10.1163/156853976X00307
- Kleinbeck, S., & McGlone, J. J. (1993). Pig tail posture: A measure of stress. Technical University Agricultural Science Technical Report T-5-327, 47-48.
- Knecht, S., Dräger, B., Deppe, M., Bobe, L., Lohmann, H., Flöel, A., … Henningsen, H. (2000). Handedness and hemispheric language dominance in healthy humans. Brain, 123, 2512–2518. doi: 10.1093/brain/123.12.2512
- Kornum, B. R., & Knudsen, G. M. (2011). Cognitive testing of pigs (Sus scrofa) in translational biobehavioral research. Neuroscience and Biobehavioral Reviews, 35, 437–451. doi: 10.1016/j.neubiorev.2010.05.004
- Langbein, J. (2012). Investigations on training, recall and reversal learning of a Y-maze by dwarf goats (Capra hircus): The impact of lateralisation. Behavioural Processes, 89, 304–310. doi: 10.1016/j.beproc.2011.12.013
- Laska, M. (1998). Laterality in the use of the prehensile tail in the spider monkey (Ateles geoffroyi). Cortex, 34, 123–130. doi: 10.1016/S0010-9452(08)70741-X
- Laska, M., & Tutsch, M. (2000). Laterality of tail resting posture in three species of New World primates. Neuropsychologia, 38, 1040–1046. doi: 10.1016/S0028-3932(99)00147-5
- Leliveld, L. M. C., Langbein, J., & Puppe, B. (2013). The emergence of emotional lateralization: Evidence in non-human vertebrates and implications for farm animals. Applied Animal Behaviour Science, 145, 1–14. doi: 10.1016/j.applanim.2013.02.002
- Leliveld, L. M. C., Scheumann, M., & Zimmermann, E. (2008). Manual lateralization in early primates: A comparison of two mouse lemur species. American Journal of Physical Anthropology, 137, 156–163. doi: 10.1002/ajpa.20852
- Lind, N. M., Moustgaard, A., Jelsing, J., Vajta, G., Cumming, P., & Hansen, A. K. (2007). The use of pigs in neuroscience: Modeling brain disorders. Neuroscience and Biobehavioral Reviews, 31, 728–751. doi: 10.1016/j.neubiorev.2007.02.003
- Lorincz, E., & Fabre-Thorpe, M. (1994). Effect of practice on paw preference in a reaching task in cats. Comptes Rendus de l’Académie des Sciences-Serie III-Sciences de la Vie, 317, 1081–1088. Retrieved from http://www.cerco.ups-tlse.fr/pdf0609/lorincz_e_94_1081.pdf
- Marchant, L. F., & McGrew, W. C. (2013). Handedness is more than laterality: Lessons from chimpanzees. Annals of the New York Academy of Sciences, 1288, 1–8. doi: 10.1111/nyas.12062
- Martin, F., & Niemitz, C. (2003). “Right-trunkers” and “left-trunkers”: Side preferences of trunk movements in wild Asian elephants (Elephas maximus). Journal of Comparative Psychology, 117, 371–379. doi: 10.1037/0735-7036.117.4.371
- Meguerditchian, A., Molesti, S., & Vauclair, J. (2011). Right-handedness predominance in 162 baboons (Papio anubis) for gestural communication: Consistency across time and groups. Behavioral Neuroscience, 125, 653–660. doi: 10.1037/a0023823
- Meguerditchian, A., & Vauclair, J. (2006). Baboons communicate with their right hand. Behavioural Brain Research, 171, 170–174. doi: 10.1016/j.bbr.2006.03.018
- Mohr, C., & Bracha, H. S. (2004). Compound measure of hand-foot-eye preference masked opposite turning behavior in healthy right-handers and non-right-handers: Technical comment on Mohr et al. (2003). Behavioral Neuroscience, 118, 1145–1146. doi: 10.1037/0735-7044.118.5.1145
- Mohr, C., Landis, T., Bracha, H. S., & Brugger, P. (2003). Opposite turning behavior in right-handers and non-right-handers suggests a link between handedness and cerebral dopamine asymmetries. Behavioral Neuroscience, 117, 1448–1452. doi: 10.1037/0735-7044.117.6.1448
- Molesti, S., Vauclair, J., & Meguerditchian, A. (2016). Hand preferences for unimanual and bimanual coordinated actions in olive baboons (Papio anubis): Consistency over time and across populations. Journal of Comparative Psychology, 130, 341–350. doi: 10.1037/com0000040
- Newberry, R. C., & Wood-Gush, D. G. M. (1984). The suckling behaviour of domestic pigs in a semi-natural environment. Behaviour, 95, 11–25. doi: 10.1163/156853985X00028
- Noonan, M., & Axelrod, S. (1989). The stability and interest consonance of lateral postural-motor biases in rats: Results and implications. Behavioral and Neural Biology, 52, 386–405. doi: 10.1016/S0163-1047(89)90502-5
- Oldfield, R. C. (1971). The assessment and analysis of handedness: The Edinburgh inventory. Neuropsychologia, 9, 97–113. doi: 10.1016/0028-3932(71)90067-4
- Palmer, A. R. (2004). Symmetry breaking and the evolution of development. Science, 306, 828–833. doi: 10.1126/science.1103707
- Perez, D. M., Heatwole, S. J., Morrell, L. J., & Backwell, P. R. Y. (2015). Handedness in fiddler crab fights. Animal Behaviour, 110, 99–104. doi: 10.1016/j.anbehav.2015.09.012
- Pujol, J., Deus, J., Losilla, J. M., & Capdevila, A. (1999). Cerebral lateralization of language in normal left-handed people studied by functional MRI. Neurology, 52, 1038–1038. doi: 10.1212/WNL.52.5.1038
- Quaranta, A., Siniscalchi, M., & Vallortigara, G. (2007). Asymmetric tail-wagging responses by dogs to different emotive stimuli. Current Biology, 17, R199–201. doi: 10.1016/j.cub.2007.02.008
- Réale, D., Reader, S. M., Sol, D., McDougall, P. T., & Dingemanse, N. J. (2007). Integrating animal temperament within ecology and evolution. Biological Reviews, 82, 291–318. doi: 10.1111/j.1469-185X.2007.00010.x
- Reimert, I., Bolhuis, J. E., Kemp, B., & Rodenburg, T. B. (2013). Indicators of positive and negative emotions and emotional contagion in pigs. Physiology and Behavior, 109, 42–50. doi: 10.1016/j.physbeh.2012.11.002
- Rogers, L. J. (2009). Hand and paw preferences in relation to the lateralized brain. Philosophical Transactions of the Royal Society B: Biological Sciences, 364, 943–954. doi:10.1098%2Frstb.2008.0225 doi: 10.1098/rstb.2008.0225
- Rogers, L. J. (2010). Relevance of brain and behavioural lateralization to animal welfare. Applied Animal Behaviour Science, 127, 1–11. doi: 10.1016/j.applanim.2010.06.008
- Rogers, L. J. (2011). Does brain lateralization have practical implications for improving animal welfare? CAB Reviews: Perspectives in Agriculture Veterinary Science Nutrtion and Natural Resources, 6, 1–10. doi: 10.1079/PAVSNNR20116036
- Rogers, L. J., & Andrew, R. J. (2002). Comparative vertebrate lateralization. Cambridge: Cambridge University Press.
- Rogers, L. J., Vallortigara, G., & Andrew, R. J. (2013). Divided brains: The biology and behaviour of brain asymmetries. Cambridge: Cambridge University Press.
- Rogers, L. J., Zucca, P., & Vallortigara, G. (2004). Advantages of having a lateralized brain. Proceedings of the Royal Society of London B: Biological Sciences, 271, S420–S422. doi: 10.1098/rsbl.2004.0200
- Rosen, G. D., Berrebi, A. S., Yutzey, D. A., & Denenberg, V. H. (1983). Prenatal testosterone causes shift of asymmetry in neonatal tail posture of the rat. Developmental Brain Research, 9, 99–101. doi: 10.1016/0165-3806(83)90114-1
- Rosen, G. D., Finklestein, S., Stoll, a. L., Yutzey, D. a., & Denenberg, V. H. (1984). Neonatal tail posture and its relationship to striatal dopamine asymmetry in the rat. Brain Research, 297, 305–308. doi: 10.1016/0006-8993(84)90571-7
- Ross, D. A., Glick, S. D., & Meibach, R. C. (1981). Sexually dimorphic brain and behavioral asymmetries in the neonatal rat. Proceedings of the National Academy of Sciences, 78, 1958–1961. doi: 10.1073/pnas.78.3.1958
- Sauleau, P., Lapouble, E., Val-Laillet, D., & Malbert, C. H. (2009). The pig model in brain imaging and neurosurgery. Animal, 3, 1138–1151. doi: 10.1017/S1751731109004649
- Siniscalchi, M., Laddago, S., & Quaranta, A. (2016). Auditory lateralization of conspecific and heterospecific vocalizations in cats. Laterality: Asymmetries of Body, Brain and Cognition, 21, 215–227. doi: 10.1080/1357650X.2015.1116541
- Siniscalchi, M., Lusito, R., Vallortigara, G., & Quaranta, A. (2013). Seeing left- or right-asymmetric tail wagging produces different emotional responses in dogs. Current Biology, 23, 2279–2282. doi: 10.1016/j.cub.2013.09.027
- Siniscalchi, M., Sasso, R., Pepe, A. M., Dimatteo, S., Vallortigara, G., & Quaranta, A. (2011). Sniffing with the right nostril: Lateralization of response to odour stimuli by dogs. Animal Behaviour, 82, 399–404. doi: 10.1016/j.anbehav.2011.05.020
- Sommer, V., Lowe, A., & Dietrich, T. (2016). Not eating like a pig: European wild boar wash their food. Animal Cognition, 19, 245–249. doi: 10.1007/s10071-015-0903-z
- Špinka, M., Stěhulová, I., Zachařová, J., Maletínská, J., & Illmann, G. (2002). Nursing behaviour and nursing vocalisations in domestic sows: Repeatability and relationship with maternal investment. Behaviour, 139, 1077–1097. doi: 10.1163/15685390260337912
- Stevens, N. J., Wright, K. A., Covert, H. H., & Nadler, T. (2008). Tail postures of four quadrupedal leaf monkeys (Pygathrix nemaeus, P. cinerea, Trachypithecus delacouri and T. hatinhensis) at the endangered primate rescue center, Cuc Phuong National Park, Vietnam. Vietnamese Journal of Primatology, 1(2), 13–24.
- Stolba, A., & Wood-Gush, D. G. M. (1989). The behaviour of pigs in a semi-natural environment. Animal Science, 48, 419–425. doi: 10.1017/S0003356100040411
- Ströckens, F., Güntürkün, O., & Ocklenburg, S. (2013). Limb preferences in non-human vertebrates. Laterality: Asymmetries of Body, Brain and Cognition, 18, 536–575. doi: 10.1080/1357650X.2012.723008
- Sutherland, M. A., & Tucker, C. B. (2011). The long and short of it: A review of tail docking in farm animals. Applied Animal Behaviour Science, 135, 179–191. doi: 10.1016/j.applanim.2011.10.015
- Tomkins, L. M., Thomson, P. C., & McGreevy, P. D. (2010). First-stepping test as a measure of motor laterality in dogs (Canis familiaris). Journal of Veterinary Behavior: Clinical Applications and Research, 5, 247–255. doi: 10.1016/j.jveb.2010.03.001
- Tran, U. S., Stieger, S., & Voracek, M. (2014). Evidence for general right-, mixed-, and left-sidedness in self-reported handedness, footedness, eyedness, and earedness, and a primacy of footedness in a large-sample latent variable analysis. Neuropsychologia, 62, 220–232. doi: 10.1016/j.neuropsychologia.2014.07.027
- Uomini, N., & Hunt, G. (2016). Multidimensional laterality in New Caledonian crows. In Proceedings of the 5th North Sea Laterality Meeting, Groningen, The Netherlands.
- Vallortigara, G., & Rogers, L. J. (2005). Survival with an asymmetrical brain: Advantages and disadvantages of cerebral lateralization. Behavioral and Brain Sciences, 28, 575–588. Retrieved from http://www12.reocities.com/Heartland/Arbor/9591/BrownBBS2005.pdf
- van der Beek, E. M. B., Wiegant, V. M., Schouten, W. G. P., van Eerdenburg, F. J. C. M., Loijens, L. W. S., van der Plas, C., … Lucassen, P. J. (2004). Neuronal number, volume, and apoptosis of the left dentate gyrus of chronically stressed pigs correlate negatively with basal saliva cortisol levels. Hippocampus, 14, 688–700. doi: 10.1002/hipo.10213
- Versace, E., Morgante, M., Pulina, G., & Vallortigara, G. (2007). Behavioural lateralization in sheep (Ovis aries). Behavioural Brain Research, 184, 72–80. doi: 10.1016/j.bbr.2007.06.016
- Versace, E., & Vallortigara, G. (2015). Forelimb preferences in human beings and other species: Multiple models for testing hypotheses on lateralization. Frontiers in Psychology, 6, 233. doi: 10.3389/fpsyg.2015.00233
- Wallez, C., & Vauclair, J. (2012). First evidence of population-level oro-facial asymmetries during the production of distress calls by macaque (Macaca mulatta) and baboon (Papio anubis) infants. Behavioural Brain Research, 234, 69–75. doi: 10.1016/j.bbr.2012.06.004
- Watson, S. L., & Ward, J. P. (1996). Temperament and problem solving in the small-eared Bushbaby (Otolemur garnettii). Journal of Comparative Psychology, 110, 377–385. doi: 10.1037/0735-7036.110.4.377
- Wright, L., & Hardie, S. M. (2012). Are left-handers really more anxious ? Laterality: Asymmetries of Body, Brain and Cognition, 17, 629–642. doi: 10.1080/1357650X.2011.615126
- Wright, L., & Hardie, S. M. (2015). Left-handers look before they leap: Handedness influences reactivity to novel tower of Hanoi tasks. Frontiers in Psychology, 6, 58. doi: 10.3389/fpsyg.2015.00058
- Zebunke, M., Repsilber, D., Nürnberg, G., Wittenburg, D., & Puppe, B. (2015). The backtest in pigs revisited—an analysis of intra-situational behaviour. Applied Animal Behaviour Science, 169, 17–25. doi: 10.1016/j.applanim.2015.05.002