
ABSTRACT
The left hemisphere is dominant for language in most people, but lateralization strength varies between different tasks and individuals. A large body of literature has shown that handedness is associated with lateralization: left handers have weaker language lateralization on average, and a greater incidence of atypical (right hemisphere) lateralization; but typically, these studies have relied on a single measure of language lateralization. Here we consider the relationships between lateralization for two different language tasks. We investigated the influence of handedness on lateralization using functional transcranial Doppler sonography (fTCD), using an existing dataset (N = 151 adults, 21 left handed). We compared a speech production task (word generation) and a semantic association task. We demonstrated stronger left-lateralization for word generation than semantic association; and a moderate correlation between laterality indices for the two tasks (r = 0.59). Laterality indices were stronger for right than left handers, and left handers were more likely than right handers to have atypical (right hemisphere) lateralization or inconsistent lateralization between the two tasks. These results add to our knowledge of individual differences in lateralization and support the view that language lateralization is multifactorial rather than unitary.
Introduction
Left cerebral hemisphere dominance for language is one of the most robust findings in neuropsychology, but it is not a universal trait. Converging evidence from different methodologies (including functional MRI and functional transcranial Doppler sonography [fTCD]) shows individual variability in language lateralization.
It is well known that handedness is associated with cerebral lateralization, but the underlying mechanisms are not well understood. Functional imaging studies have shown this effect of handedness with various language tasks, including word generation (also known as phonemic or semantic fluency, depending on the task) (Badzakova-Trajkov, Haeberling, Roberts, & Corballis, Citation2010; Flöel, Buyx, Breitenstein, Lohmann, & Knecht, Citation2005; Häberling et al., Citation2011; Knecht, Citation2000; Krach, Chen, & Hartje, Citation2006; Powell, Kemp, & Garcia-Finana, Citation2012; Pujol, Deus, Losilla, & Capdevila, Citation1999; Westerhausen et al., Citation2006; Whitehouse & Bishop, Citation2009), verb generation (Vernooij et al., Citation2007), animation description (Groen, Whitehouse, Badcock, & Bishop, Citation2013) and semantic association with spoken words (Szaflarski et al., Citation2002). A meta-analysis (Carey & Johnstone, Citation2014) showed that handedness was predictive of the likelihood of aphasia after left or right hemisphere stroke; of perceptual biases in dichotic listening or visual half field tasks; and of group-level estimates of lateralization strength using functional imaging.
As well as group-level effects of handedness on laterality, there have been some studies investigating individual differences within groups of left and right handers. In right handers, approximately 90% of people show left (typical) lateralization for language and the remaining 10% show no strong lateralization; whereas in left handers, around 78% are left lateralized, 15% show no lateralization, and 7% show right lateralization (Basic et al., Citation2004; Knecht, Citation2000; Mazoyer et al., Citation2014). A large fTCD study (N = 310) demonstrated that the prevalence of right or bilateral hemispheric dominance increased with the strength of left handedness (Somers et al., Citation2015).
An fMRI study with a large sample of participants (N = 297, including 153 left handers) investigated the distribution of lateralization strength among left and right handers (Mazoyer et al., Citation2014). This suggested that there may be three distinct populations of individuals: a “typical” left lateralized population; a smaller “ambilateral” population with weak laterality; and a small “atypical” population with right lateralization. Interestingly, the “atypical” group were all left handed. This finding lends support to the idea that left handers tend to be more variable in laterality than right handers, but also suggests that the distribution of laterality across the population is best modelled by multiple subpopulations, rather than one normal distribution. Furthermore, this distribution appears to be different in the left and right handers.
Although a variety of language tasks have been used, most studies have treated language lateralization as a unitary trait. On this basis, the focus has been on selecting a task that is a good indicator of language lateralization, with many fMRI studies using word generation, also known as verbal fluency. Where more than one language task is used, there tends to be stronger lateralization for expressive than receptive language (Badcock, Nye, & Bishop, Citation2012; Dodoo-Schittko, Rosengarth, Doenitz, & Greenlee, Citation2012; Harrington, Buonocore, & Tomaszewski Farias, Citation2006; Jansen et al., Citation2006; Stroobant & Vingerhoets, Citation2001; Stroobant, Buijs, & Vingerhoets, Citation2009; c.f. Häberling, Steinemann, & Corballis, Citation2016). It should be noted, however, that variability in analysis methods, task design and baseline conditions make it hard to make generalizations across studies (Bradshaw, Thompson, Wilson, Bishop, & Woodhead, Citation2017).
Rather than looking for an optimal task for measuring lateralization, our focus is on possible dissociations between laterality for different domains of language. Early studies using the Wada technique reported individuals with “bilateral” speech representation, who showed opposite lateralization for naming and repetition tasks: these were all non-right-handers (Rasmussen & Milner, Citation1977). Subsequent studies confirmed that a small minority of individuals show inconsistent lateralization for different tasks, not just in clinical cases (Tailby, Abbott, & Jackson, Citation2017), but also in healthy individuals (Gaillard et al., Citation2004; Stroobant et al., Citation2009). This led to the hypothesis that there might be more than one factor that influences lateralization independently. This hypothesis was recently tested in a study of six different language tasks in a mixed group of left and right handers (Woodhead, Bradshaw, Wilson, Thompson, & Bishop, Citation2019). For most participants, a single factor predicted lateralization across all tasks, but for a small minority – all left handers – there was variability between tasks that was best explained by a two-factor model. This raises the possibility that as well as showing weaker lateralization, left handers may be characterized by more variability in lateralization across tasks.
The present study took this line of work further, investigating the consistency and variability of language lateralization in left and right-handed participants using a pre-existing dataset (Bruckert, Citation2016). In contrast to previous studies using a single laterality index to investigate individual differences within handedness groups, we compared lateralization on two tasks in each individual. Our dataset consisted of fTCD recordings from 151 participants (21 left handed) performing two tasks: a speech production task (word generation) and a semantic association task.
The two tasks used in this study had been selected to engage contrasting aspects of language function, in order to maximize the chances of seeing dissociations in laterality. The first task, word generation, was chosen as the classic gold standard for measuring language lateralization with fTCD. This task requires participants to read a single letter cue on each trial and then silently generate as many words as possible starting with that letter. There are minimal requirements for semantics, as word meaning is unimportant. The word generation task has been used in numerous fMRI studies and generates robust left-sided activation in the inferior frontal and premotor cortex, along with bilateral ventral occipitotemporal activity, which is likely evoked by reading the visual stimulus (e.g., Häberling et al., Citation2011, Citation2016; Ocklenburg, Hugdahl, & Westerhausen, Citation2013).
For the second task, we selected a semantic association task that used pictorial stimuli and which had no requirements for subvocal speech production of any kind. This task was based on the Pyramids and Palm Trees (PPT) task (Howard & Patterson, Citation1992), where participants have to decide which of two pictures (e.g., a palm tree vs a fir tree) is semantically related to a probe picture (e.g., a pyramid). The task shows deficits in patients with semantic dementia, who have progressive degeneration of the anterior temporal lobe bilaterally(Bozeat, Lambon Ralph, Patterson, Garrard, & Hodges, Citation2000). There is some debate over patterns of fMRI activation during semantic processing (Rice, Ralph, & Hoffman, Citation2015). The anterior temporal lobes are hard to visualize on fMRI, but where data is available, there is evidence that this region is activated bilaterally during tests of semantic knowledge, for both verbal and visually-presented material (Rice et al., Citation2015). An influential model of speech perception posits that speech comprehension is largely bilateral in the ventral stream (Hickok & Poeppel, Citation2007). Results from positron emission tomography (Ricci et al., Citation1999) and fMRI (Seghier, Josse, Leff, & Price, Citation2011) show that the non-verbal PPT task elicitsleft lateralized activation in the inferior frontal cortex, anterior and posterior temporal cortex. Hence, we may expect to see bilateral or weak left lateralization for this task using fTCD.
FTCD provides a measure of the lateralization of task-related brain activity that is complementary to fMRI: both methods detect changes in the haemodynamic response during a task of interest, but with different strengths and weaknesses. With fMRI one has excellent spatial resolution but poor temporal resolution, as the sampling rate of echo planar images is usually around 1–3 s (depending on the sequence used). In order to identify focal activation related to a specific task, it is common to subtract activity from a baseline task that is selected to have similar task demands but lacking the cognitive processes of interest. In fTCD, the signal consists of the blood flow in the left and right middle cerebral arteries, and so there is no within-hemisphere spatial resolution. The sampling rate of fTCD is much faster (it is usually recorded at 100 Hz and downsampled to 25 Hz); although it should be noted that the temporal resolution is still limited by the underlying rate of the slow haemodynamic response. The signal is equalized between left and right at the start of each trial by baseline correction, usually using a rest condition. This is important to ensure that the two sides start at equivalent levels. The difference between left and right blood flow velocities is computed directly, without the need for any thresholding, and without requiring subtraction of activity from a comparison task. The main advantages of fTCD over fMRI are the convenience and low cost, which make it easier to sample large groups of participants.
Preregistered hypotheses
The following hypotheses and an analysis plan were preregistered on Open Science Framework (OSF, https://osf.io/bcxus):
Hypothesis 1: There would be stronger left lateralization for the word generation task than the semantic association task. As speech production has been shown to be more strongly lateralized than receptive tasks, our aim was to replicate previous findings from fMRI using fTCD.
Hypothesis 2: There would be weaker left lateralization in the left handed participants compared with the right handed participants. Again, the aim was to replicate previous findings from the literature using fTCD.
Hypothesis 3: There would be a significant positive correlation in strength of lateralization for the word generation and semantic association tasks.
Hypothesis 4: The relationship between lateralization in the word generation and semantic association tasks would be more variable in the left-handed participants than the right-handed participants.
The data, which were previously analysed and written up for an unpublished doctoral thesis (Bruckert, Citation2016), provided an opportunity to replicate findings from Woodhead et al. (Citation2019) with a novel dataset (hypothesis 4). Furthermore, recent improvements in the fTCD methodology (Woodhead, Rutherford, & Bishop, Citation2020) warranted reanalysis of the data to test hypotheses 1–3.
Materials and methods
Design
The Laterality Indices (LIs) for the word generation and semantic association tasks were used as the dependent variables in the statistical analysis. There were two independent variables: a within-subjects variable of task (word generation or semantic association) and a between-subjects variable of handedness (left or right handed).
Participants
There were 151 participants, recruited from the Oxford Psychology Research Participant Recruitment Scheme (https://opr.sona-systems.com). These participants were part of a larger study with 231 participants (Bruckert, Citation2016), but only 151 participants had complete, useable data from both tasks. The mean age was 22y 9 m (SD = 4y 1 m). Handedness was determined through a simple demographics questionnaire: the handedness question stated “Handedness: left / right / both”. This resulted in a sample of 11 left-handed females, 10 left-handed males, 87 right-handed females, and 43 right-handed males. The excess of females reflected volunteer bias.
A subset of individuals was invited back for a second test session to assess test-retest reliability: 30 of them completed word generation (2 left-handed females, 3 left-handed males, 15 right-handed females and 10 right-handed males; mean age = 22y 10 m; SD = 4y 7 m), and 19 completed semantic association (1 left-handed female, 1 left-handed male, 12 right-handed females and 5 right-handed males; mean age = 21y 5 m; SD = 2y 10 m). The interval between the two sessions ranged from 7 to 434 days (mean = 168, SD = 149).
All participants gave written, informed consent, and all procedures were approved by the Central University Research Ethics Committee of the University of Oxford (MSD-IDREC-C1-2014-003).
Handedness assessment
Handedness was assessed in the first session only. The demographics questionnaire (including self-reported handedness) was administered after taking informed consent but before the fTCD experiment. After successful completion of the fTCD experiment, participants were asked to also complete a short version of the Edinburgh Handedness Inventory (Oldfield, Citation1971) and the Quantification of Hand Preference task (Bishop, Ross, Daniels, & Bright, Citation1996).
For the EHI, participants were asked to report which hand they typically used for ten activities of daily living (e.g., Writing: always left [1], usually left [2], both hands equally [3], usually right [4], or always right [5]), and their ratings were summed to give a value from 10 (extreme left handedness) to 50 (extreme right handedness). The QHP (described in detail in Bishop et al., Citation1996) assessed which hand participants used to reach for cards arranged in a semi-circle in front of them. The score was calculated by subtracting 0.5 from the proportion of right-handed reaches, giving a value from −0.5 (extreme left handedness) to 0.5 (extreme right handedness).
Apparatus
The fTCD data were recorded from the left and right middle cerebral arteries (MCAs) simultaneously using two ultrasound monitoring probes held in place using an elastic headset. The signal was recorded using a Doppler-BoxTMX receiver and processed using QL software (v3.2) on a laptop PC. All equipment (the probes, headset, receiver box and software) were from Compumedics DWL®.
The experimental tasks were presented on a standard PC monitor using Presentation Software (Neurobehavioral Systems) which sent marker pulses to the Doppler-BoxTMX system to denote the onset of each trial. Participants were positioned at a viewing distance of approximately 80 cm from the monitor.
Procedure
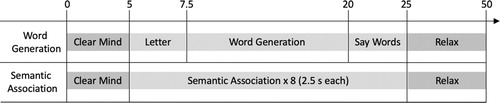
Participants attended a testing session that lasted approximately 1 h 20 min. They were first trained to perform the word generation and semantic association tasks and completed a number of practice trials. The fTCD headset and probes were fitted and a stable signal was found from the left and right middle cerebral arteries via the temporal windows. It was not possible to find a suitable temporal window from 12 of the original 231 participants (5.19%) – this failure rate is in line with previous findings (McMahon et al., Citation2007). The fTCD data was then collected while participants performed the tasks. Word generation was always conducted first, followed by the semantic association task. Detailed descriptions of the two tasks are provided below, and the time-course of trials is presented in .
Figure 1. Time-course of trials in word generation and semantic association tasks.
Word generation task
This task was based on a paradigm previously described by Knecht and colleagues (Knecht et al., Citation1998). Trials began with a “Clear Mind” cue presented visually on the screen (duration = 5 s), followed by an upper case letter (2.5 s) and then a blank screen (12.5 s). During this time, participants were required to silently generate as many words as possible starting with the displayed letter. A “Say Words” cue was then presented (5 s), and participants were required to verbally report the words they had thought of. Finally, “Relax” was presented (25 s), during which participants were required to relax and think of as little as possible until the next trial began.
Participants completed 23 word generation trials, each with a different letter (excluding letters Q, X and Z) presented in a randomized order. Overall, the task lasted approximately 19 min 15 s.
Semantic association task
This task was based on the Pyramids and Palm Trees test (Howard & Patterson, Citation1992). Like the word generation task, it began with a “Clear Mind” cue (5 s). This was followed by a series of eight picture triads, each presented for 2.5 s (20 s in total). Each triad consisted of three black and white line drawings, with one picture presented above two others. Some triads were taken from the Pyramids and Palm Trees test, and others were created using black and white line drawings that matched the style of the test. Participants were required to decide which of the two bottom pictures was semantically related to the top picture and respond by keyboard button press with either their left or right index fingers. The location of target pictures was counterbalanced so that an equal number of left or right finger button presses was required. As in the word generation task, “Relax” was presented at the end of each trial (25 s).
Participants completed 15 semantic association trials (each trial had 8 decisions; comprising a total of 120 triads). The number of trials was limited by the availability of the stimuli, 52 of which were taken from the original Pyramids and Palm Trees test, and the remainder of which were created to match the same drawing style. The task lasted 12 min 30 s.
fTCD processing
The fTCD ultrasound probes recorded the cerebral blood flow velocity (CBFV) from the left and right MCAs while the participants performed the tasks. The probes work by emitting ultrasound pulses at a set frequency and recording the frequency change of the reflected signal. If the ultrasound is reflected by blood moving towards the probe (as in the case of the MCA), the frequency of the reflected signal will be higher, due to Doppler shift. The difference in the frequency of the emitted versus reflected signal is therefore an indicator of the velocity of blood flow (the CBFV), which is recorded in cm/s.
The CBFV data were analysed using custom scripts in R Studio (RStudio Team, Citation2015) using conventional methods (Deppe, Ringelstein, & Knecht, Citation2004). The script and raw data can be found on OSF (https://osf.io/hfn2j). The data was first downsampled from 100 Hz to 25 Hz and epoched from −12 s to 30 s relative to the onset of the “Clear mind” cue. Each trial was then visually examined, and trials containing gross artefacts were manually excluded. Artefacts of this type might include short periods of discontinuity in the signal intensity, either substantially above (spiking) or below (dropout) the normal range. This manual step was done blind to participant handedness to prevent bias, and was included in order to detect obvious artefacts where signal intensity was not extreme enough or prolonged enough to be detected by automated methods. Next, there was an automated artefact detection step, where data points outside of the 0.0001–0.9999 quantiles were identified. If a trial contained one of these artefact data points it was replaced by the mean for that epoch; if it contained more than one, the epoch was rejected.
The data were then normalized by dividing by the mean and multiplying by 100. Heart cycle integration was performed to remove the peaks and troughs in the CBFV caused by the heartbeat. Baseline correction was performed using the mean CBFV in the ten seconds of rest immediately prior to the onset of each trial (−10 s to 0 s per stimulus time) as the baseline. In a final artefact detection step, trials containing signal below 60% or above 140% of the mean normalized CBFV were rejected.
If the total number of rejected trials (from manual or automated artefact detection) was greater than 20% of all trials (i.e., more than 5/23 trials for word generation or more than 3/15 trials for semantic association), all data for that participant was excluded.
The data for all (included) trials were then averaged for each participant, producing a mean epoch for word generation and one for the semantic association. The Laterality Index (LI) was calculated using the difference between the left and right CBFV within a period of interest – for word generation this was from 8 s to 20 s, and for the semantic association, this was from 8 s to 25 s. These values were chosen so that the start of a period of interest was 3 s after the task began (allowing for a delay in the blood flow’s response to the task; Aaslid, Citation1987; Conrad & Klingelhofer, Citation1989). The period of interest ended when the task itself ended, to avoid contamination with blood flow in response to subsequent stimuli. The mean CBFV was calculated within that period of interest for the left and right sensors, and the difference between the two (left minus right) was taken as the LI. Hence, positive LI values indicate left lateralization, and negative LI values indicate right lateralization. The LI values for the two tasks were used as the dependent measure for the subsequent statistical analyses.
It is worth noting that this method for calculating LI using the mean difference in left and right CBFV across the period of interest is a departure from the conventional approach. It is more common to identify the peak difference between left and right CBFV within the period of interest, and to take the average of a small time window (∼2 s) around the peak. As discussed in a recent paper (Woodhead, Rutherford, et al., Citation2020) the “peak” method leads to a point of rarity for LI = 0, as a positive or negative peak will always be found, even if it is brief or reflects noise in the data. This tends to result in LI values that are not normally distributed. These problems are avoided if the “mean” method is used, as we did for this analysis.
A final step was included to detect unreliable LI values. LI was calculated for each trial separately (rather than using the mean epoch), and the standard error (SE) of the LI was recorded for each task and each participant. The Hoaglin and Iglewicz (Citation1987) method was used to detect datasets with outlier SE values, indicating that the data for that participant was unusually noisy and therefore unreliable. For each task, the threshold for outlier SE values was calculated as follows:
Threshold = Q3 + 2.2 * (Q3 – Q1)
Statistical analysis
The statistical analyses were performed in R Studio using preregistered scripts that can be found on OSF (https://osf.io/hfn2j).
Hypotheses 1 and 2 were tested using Multilevel Linear Modelling (MLM) to assess the influence of task and self-reported handedness(left or right) on lateralization strength (LI). This method was chosen as we anticipated that the data would not meet the assumptions of conventional analysis of variance for two reasons: (1) there was a large difference in group size between the left and right-handed participants, and (2) we anticipated larger heterogeneity of variance within the left-handed group than the right-handed group.
The multilevel models were fitted to the LI data, with main effects of the task (word generation vs semantic association) and handedness (left vs right handed). In line with our preregistered analysis plan, we tested the fit of two models and selected the optimal model using likelihood ratio tests. The models were as follows:
Model 1: homogeneous variance model assumptions, i.e., variances between groups and between subjects were treated as equal for the two handedness groups.
Model 2: heterogeneous between-subject variance by group, i.e., different variances were specified for left and right-handed groups
[N.B. In the preregistered analysis script Model 3 was also specified, with heterogeneous within-subject variance. However, during data analysis it was realized that with only two data-points per person (one for each task) the within-subject variance was equal to the slope of the linear model, and therefore not meaningful to test in addition to Models 1 and 2. Hence, this model was omitted from the final analysis.]
Hypothesis 3 predicted a significant correlation between LI values for the two tasks and was tested using Pearson’s bivariate correlation (including all participants). Hypothesis 4 predicted that left-handed participants would have a more variable relationship between lateralization on word generation and semantic association than right handers. This was tested by calculating Cook’s distance for each participant, which represents the influence of that participant on the results of the regression model between the LI values for the word generation and semantic association tasks (Cook, Citation1977). High Cook’s distances would be observed if participants had a highly variable relationship between lateralization on the two tasks (i.e., inconsistent lateralization between tasks) or if they had LI values that were consistent but a long way from the group mean (i.e., atypical lateralization). Cook’s distances are bounded at zero and have a positive skew, and so parametric statistics were unsuitable for comparing values for the left and right-handed participants. Instead, the nonparametric Fligner-Killeen test of homogeneity of variances was used, which is robust against departures from normality.
Exploratory analyses
The relationship between the strength of handedness and lateralization was investigated in exploratory analyses, using continuous measures of handedness from the EHI and QHP assessments. The relationship between these continuous measures of hand preference and LI values for both tasks were explored in scatterplots. We also investigated whether participants with consistent atypical (right) lateralization tended to be strongly left handed as suggested by findings of Mazoyer et al. (Citation2014).
Results
The fTCD data and basic (anonymised) demographic data are available on OSF (https://osf.io/hfn2j/).
Data quality
During data analysis, two participants were rejected as they had an insufficient number of useable trials in one or both tasks. Three more participants were rejected because the standard error of their LI values across trials was outside of the acceptable limits on one or both tasks. Hence, the analysis was performed on N = 151 participants (as reported above). For these participants, the number of excluded trials was low: for word generation, 2.74% of all trials were excluded, and for the semantic association, 1.72% were excluded.
Split-half reliability was calculated using the odd and even trials from all of the datasets at the first session. Test-retest reliability was calculated using LI values from the first session and the second session in a small subset of participants. Results from these analyses are shown in . The reliability indices within and between sessions were moderate to high (0.67–0.87) indicating good reliability for both tasks.
Table 1. Split-half and test-retest reliability data for the word generation and semantic association tasks.
Laterality indices
shows the distribution of LI values from both tasks in the left- and right-handed groups. Shapiro-Wilks normality tests showed that LI values were mostly normally distributed (word generation: right handers, p = .599, left handers, p = 0.421; semantic association: right handers, p = 0.050, left handers, p = .999) and so parametric statistics were used. In both groups, as predicted, the mean LI values were more strongly left lateralized for word generation task (left handed Μ = 1.40, SD = 1.93; right handed Μ = 2.26, SD = 1.38) than for semantic association(left handed Μ = −0.26, SD = 1.88; right handed Μ = 1.48, SD = 1.54) task. Also, as predicted, mean LI values were also more strongly left lateralized for the right-handed group than the left-handed group. These numerical differences were formally tested with Multilevel Linear Modelling as described below.
Figure 2. Pirate plot (Phillips, Citation2017) showing distribution of laterality indices (LI) in left handed and right handed participants, in the semantic association (yellow) and word generation (blue) tasks. Positive LI values indicate left lateralization; negative LI values indicate right lateralization. The solid bar represents the mean, and the box represents the 95% confidence interval. The shaded area represents the density. [To view this figure in color, please see the online version of this journal.]
![Figure 2. Pirate plot (Phillips, Citation2017) showing distribution of laterality indices (LI) in left handed and right handed participants, in the semantic association (yellow) and word generation (blue) tasks. Positive LI values indicate left lateralization; negative LI values indicate right lateralization. The solid bar represents the mean, and the box represents the 95% confidence interval. The shaded area represents the density. [To view this figure in color, please see the online version of this journal.]](/cms/asset/d5111d97-dfb9-41ae-aecb-32f09587dd93/plat_a_1898416_f0002_oc.jpg)
Hypotheses 1 and 2
Hypothesis 1 postulated stronger left lateralization for word generation compared with the semantic association, and Hypothesis 2 postulated stronger left lateralization in the right-handed participants compared with the left-handed participants. These hypotheses were tested using Multilevel Linear Modelling.
shows the fit statistics for the two models: Model 1 with homogeneous variance, and Model 2 with heterogeneous between-subject variance. The likelihood ratio test showed that Model 2 was a better fit for the data (p = .041).
Table 2. Model fit and comparison statistics.
The output of Model 2 is shown in . Within this model, there was a significant main effect of task, with stronger left lateralization for word generation than semantic association (p < .0001), supporting Hypothesis 1. There was also a significant main effect of handedness group, with higher LI values for right than left-handed participants (p = .0012), supporting Hypothesis 2.
Table 3. Output of the winning multilevel linear model (Model 2 in ), with heterogeneous between-subjects variance.
As the between-person variance was allowed to vary between groups (i.e., was heterogeneous), within-group variances are reported for each group separately. The variance for the left-handed group (2.38) was larger than for the right-handed group (0.97). shows the distribution of LI values in left and right-handed participants: this must be interpreted cautiously given the small number of lefthanders. On visual inspection, for the semantic association task, the whole distribution appears shifted away from left-hemisphere bias, but for word generation, the mode for lefthanders is similar to that for right handers, with a suggestion of a second, more bilateral or right lateralized, peak.
Figure 3. Density histogram of laterality indices (lateralization strength) in left handed (yellow) and right handed (blue) participants. [To view this figure in color, please see the online version of this journal.]
![Figure 3. Density histogram of laterality indices (lateralization strength) in left handed (yellow) and right handed (blue) participants. [To view this figure in color, please see the online version of this journal.]](/cms/asset/f546c48b-11d0-49ba-9968-9f816a094bc0/plat_a_1898416_f0003_oc.jpg)
Hypothesis 3
Hypothesis 3 predicted a significant positive correlation in the strength of lateralization between word generation and semantic association, which was tested using Pearson’s correlation across all participants. The correlation was significant (r = .529, 95% CI: 0.40–0.64), supporting Hypothesis 3. shows a scatterplot of all participant’s lateralization strengths on the two tasks.
Figure 4. Scatterplot of lateralization indices on the word generation and semantic association tasks. The colour coding indicates the participants’ handedness (yellow = left handed, blue = right handed) and triangles indicate which participants were outliers using Cook’s distance measure. [To view this figure in color, please see the online version of this journal.]
![Figure 4. Scatterplot of lateralization indices on the word generation and semantic association tasks. The colour coding indicates the participants’ handedness (yellow = left handed, blue = right handed) and triangles indicate which participants were outliers using Cook’s distance measure. [To view this figure in color, please see the online version of this journal.]](/cms/asset/b00d17ed-acbc-44d2-a121-cfff54c5a614/plat_a_1898416_f0004_oc.jpg)
Hypothesis 4
Hypothesis 4 predicted that the relationship between lateralization in word generation and semantic association would be more variable in the left-handers than the right-handers. This variability was quantified by calculating Cook’s distances for each participant, then compared between left and right-handed groups using the Fligner-Killeen test. This showed that Cook’s distances in left handers were significantly more variable than in right handers (χ2(1) = 8.72, p = .003), supporting Hypothesis 4.
To further explore this result, bivariate outliers were defined as participants with Cook’s distances greater than four times the group mean, as indicated with triangles in . There were eight outliers – four were left handed and four were right handed. Again, this proportion (50%) seems high given the proportion of left handers in the total sample (13.9%). Four outliers (two left handed) showed consistent right lateralization for both tasks. The other four outliers (two left handed) showed inconsistent lateralization for the two tasks.
As can be seen from , the pre-registered analysis using Cook's distance is not an ideal test of Hypothesis 4, because a large Cook's distance does not necessarily indicate a dissociation between laterality of two tests; it is also obtained for cases who are atypical (i.e., right-lateralized) on both measures. If we simply categorize each case as left- or right-lateralized on word generation and semantic association, depending on whether the LI is above or below zero (see data in ), it is evident that there is a striking difference in distributions for the two handedness groups (χ2(3) = 28.47, p < .001, φ = 0.43). Far fewer left than right handers are left lateralized for both tasks (only 43% of left handers, compared to 83% of right handers), and more are right lateralized for both tasks (29% of left handers compared to only 2% of right handers).
Table 4. Mean (and standard deviation) strength of handedness (using EHI and QHP measure) for left and right handed participants, broken down into laterality category groupings.
Exploratory analyses
shows scatterplots exploring the relationships between the continuous measures of handedness (EHI and QHP) and the lateralization observed in the two tasks (word generation and semantic association). Note that the EHI scores ranged from 10 (extreme left handedness) to 50 (extreme right handedness), with a score of 30 denoting equal use of both hands. The QHP scores ranged from −0.5 (extreme left handedness) to 0.5 (extreme right handedness) with 0 indicating equal use of both hands. The EHI and QHP scores were skewed due to the overrepresentation of right-handed participants. Visual inspection of the plots shows a weak positive relationship between handedness and lateralization, with no obvious difference between the word generation or semantic association tasks.
Figure 5. Scatterplots showing a weak positive relationships between the continuous measures of handedness (top, Edinburgh Handedness Index; bottom, Quantification of Hand Preference) and the strength of lateralization on the two tasks (left, word generation; right,semantic association).
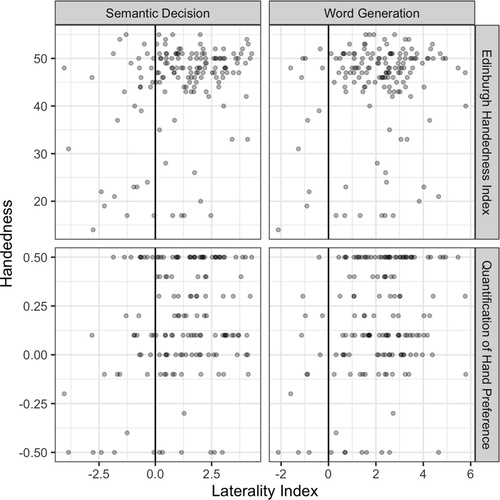
We performed further analyses (which were not preregistered) in order to explore the relationship between consistency of laterality across the two tasks (e.g., LL, LR, RL or RR, where the two letters refer to lateralization for the word generation and semantic association task respectively) and strength of handedness as a continuous measure (using EHI or QHP measures). Previous studies have found that participants with strongly atypical (right) lateralization for language are also strongly left handed (Mazoyer et al., Citation2014). Hence, we examined whether left-handed participants in the RR group (N = 6) might be more strongly left handed than those in other groups (LL, N = 9; LR, N = 6). As can be seen in , neither their EHI or QHP scores supported the idea that RR participants were more strongly left handed than those in the other laterality categories.
Discussion
We confirmed using fTCD that, as predicted, (1) there was stronger left lateralization for word generation than for semantic association and (2) lateralization was stronger for right than left handers. In addition, consistent with our prior work, we found that (3) lateralization strength on the two tasks was correlated; and (4) as well as having overall weaker lateralization, left handers showed more variability than right handers in their lateralization across the two tasks.
Before discussing the findings, it is worth noting that the LI values observed in this study were lower than would be expected from comparable studies in the literature. For example, fTCD studies of word generation (covert phonemic fluency) in right handers show a weighted average of LI = 2.98 (Dräger & Knecht, Citation2002; Gutierrez-Sigut, Payne, & MacSweeney, Citation2015; Knecht et al., Citation2000; Krach et al., Citation2006; Lust, Geuze, Groothuis, & Bouma, Citation2011; Somers et al., Citation2011; Stroobant et al., Citation2009), which is substantially higher than that observed for right handers in the current study (LI = 2.26). This is due to the different method we used to calculate LI values. As we took the mean difference between left and right ultrasound sensors within a period of interest, rather than identifying the peak difference with that period, the LI values tended to be closer to zero. Indeed, in the original analysis of this data using the peak method, the average value for the right-handed group was LI = 3.10 (Bruckert, Citation2016). However, the peak method can induce spurious bimodality in the laterality distribution. The new method of computing LI values has the advantage of producing normally distributed data, and avoids the problem of bimodality with an artefactual point of rarity around LI = 0 (Woodhead, Rutherford, et al., Citation2020). The reliability we observed using this method was good, both within and between sessions, and compares favourably to previous fTCD studies. Previous split-half reliability values observed for word generation range from 0.32 to 0.89 (Badcock et al., Citation2012; Bishop, Watt, & Papadatou-Pastou, Citation2009; Gutierrez-Sigut et al., Citation2015; Illingworth & Bishop, Citation2009; Krach & Hartje, Citation2006; Somers et al., Citation2011; Whitehouse & Bishop, Citation2009). Stroobant and Vingerhoets reported test-retest reliability of r = 0.53 for word generation (Stroobant & Vingerhoets, Citation2001). In our previous work using the same fTCD analysis method reported here, we observed test-retest correlations ranging from 0.52 to 0.86 for different language tasks; the exception being “list generation”, a task where participants produced automatic speech sequences such as counting, which had poor test-retest reliability (Woodhead, Thompson, Karlsson, & Bishop, Citation2020; Woodhead et al., Citation2019).
With regards to the first hypothesis, our observation that lateralization was stronger for word generation than semantic association is consistent with findings in the fMRI literature, where lateralization for speech production and semantic tasks have been directly compared (Buchinger et al., Citation2000; Dodoo-Schittko et al., Citation2012; Harrington et al., Citation2006; Jansen et al., Citation2006; Stroobant & Vingerhoets, Citation2001; Stroobant et al., Citation2009). One exception to this pattern (Häberling et al., Citation2016) showed no significant difference between lateralization for word generation and semantic association in fMRI; however, this may have been because there was a high level baseline for semantic association(a letter string decision task) but not for word generation. The convergence of evidence from fTCD and fMRI is striking, when one considers that fTCD is restricted to measuring changes in blood flow in the middle cerebral arteries, whereas fMRI covers the cerebral hemispheres.
Although lateralization for our non-verbal semantic task was weaker than for word generation, it was still significantly left lateralized. Although some authors argue that the representation of semantic knowledge is distributed bilaterally (Hickok & Poeppel, Citation2007; Patterson, Nestor, & Rogers, Citation2007; Rice et al., Citation2015), semantic control (i.e., executive control processes required for the selection and manipulation of semantic knowledge) is associated with left lateralized activation in the inferior frontal gyrus and posterior temporal cortex (Jefferies & Lambon Ralph, Citation2006; Noppeney, Phillips, & Price, Citation2004; Whitney, Kirk, O’Sullivan, Lambon Ralph, & Jefferies, Citation2012). Consistent with this view, a review of fMRI studies of language lateralization by Bradshaw and colleagues (Bradshaw et al., Citation2017) observed stronger left lateralization for tasks that require greater semantic control, such as judging the semantic relatedness of two stimuli, compared to simple tasks, such as judging category membership of a single stimulus. Hence, the left lateralization observed for our semantic association task may reflect the high level of semantic control required.
Stronger lateralization for right than left handers has also been observed in previous studies. A linear relationship between the strength of handedness and strength of lateralization was reported in a landmark study by Knecht and colleagues (Knecht, Citation2000), who used a word generation task with fTCD in 326 participants. The proportion of left and right handers with the left hemisphere, ambilateral or right hemisphere dominance (L/B/R%) for language is also remarkably consistent across speech generation tasks in fTCD (Basic et al., Citation2004) and fMRI methodologies (Mazoyer et al., Citation2014), at around 90/10/0% for right handers and 78/15/7% for left handers. Here we confirm and extend this finding by reporting lateralization for left and right handers in both an expressive language task and a receptive semantic task.
The main novel hypothesis of this study was that strength of lateralization for the two tasks would be more variable for left handers than right handers (hypothesis 4). The results from all participants showed a moderate correlation in lateralization strength for the two tasks (hypothesis 3; r = 0.53): the strength of lateralization during word generation was a fairly good predictor of lateralization during semantic association. As predicted, we confirmed that left-handers were more likely to fall outside the bivariate distribution shown by right-handers. However, as can be seen from , although this in part reflected inconsistent lateralization in this group (left for one task and right for the other), there were also significant numbers of left-handers who were atypical because they were right-lateralized for both tasks.
These results are in line with findings from a recent study by Woodhead and colleagues (Woodhead et al., Citation2019), who looked at lateralization across a range of six language tasks in a smaller group of adults (N = 37). They showed that there were moderate to strong correlations in lateralization between most tasks, which supported the idea that language lateralization is predicted by a unitary factor. However, a small minority of individuals broke with this pattern, and showed a fractionation of language lateralization, with correlations between tasks forming two clusters. Interestingly, these participants with more variable lateralization between tasks were all left handed. In that study too, as well as cases of inconsistent lateralization across tasks, there were some left-handers who were outliers by virtue of being consistently right-lateralized. Taken together, these two studies provide evidence that left handers are more likely than right handers to have atypical or inconsistent lateralization across tasks.
LI values measured by fTCD reflect the proportion of left hemisphere activity in the middle cerebral artery, which provides blood to a large territory encompassing classic frontal and posterior language areas. The lower LI values we observed in left handers may have been driven by more bilateral activation of one area, or a mixture of left lateralization in one area and right lateralization in another area (“crossed” lateralization). Crossed lateralization has been observed in early Wada studies (Rasmussen & Milner, Citation1977) and more recently by Tailby and colleagues, who reported one participant (in a group of 12 right-handed controls) with crossed lateralization within a speech production task: they showed left lateralized activity in the inferior frontal cortex, but right lateralized activity in posterior temporal cortex (Tailby et al., Citation2017). It would be of interest to assess the same individuals using fTCD and fMRI in order to see whether weaker LI values in left-handers reflect differential laterality across brain regions that contribute to task performance.
In this study, we recruited a large sample of participants without screening for handedness, which meant that only a minority of participants were left handed. This natural sampling approach has strengths and weaknesses. On one hand, it resulted in a dataset that reflects the natural proportion of left and right handers, and avoids any potential bias in the recruitment process. On the other hand, the sample of left handers was relatively small compared to right handers. We have mitigated the uneven sample sizes of the two groups by using multilevel linear modelling, but it should be noted that recruiting a larger sample of left handers would allow for a more detailed analysis of the composition within this varied and interesting population. It is challenging to study atypical language lateralization, because even within left-handed participant groups, the majority of individuals are likely to have typical (consistent) left lateralization. Large sample sizes are needed to give sufficient power to detect atypical patterns in a minority of participants. We propose that fTCD is a reliable, cheap and simple way of testing lateralization in a large number of individuals across a range of language tasks, and could be used as an initial screening step before inviting individuals with inconsistent laterality back for further investigation using fMRI.
Acknowledgements
We would like to thank Dr Heidi Feldman for supporting LB during the analysis and write-up of this project.
Data availability statement
The data and analysis scripts are available on Open Science Framework, https://osf.io/hfn2j/doi10.17605/OSF.IO/HFN2J.
Disclosure statement
No potential conflict of interest was reported by the author(s).
Additional information
Funding
References
- Aaslid, R. (1987). Visually evoked dynamic blood flow response of the human cerebral circulation. Stroke, 18(4), 771–775. doi:https://doi.org/10.1161/01.STR.18.4.771
- Badcock, N. A., Nye, A., & Bishop, D. V. M. (2012). Using functional transcranial Doppler ultrasonography to assess language lateralisation: Influence of task and difficulty level. Laterality: Asymmetries of Body, Brain and Cognition, 17(6), 694–710. doi:https://doi.org/10.1080/1357650X.2011.615128
- Badzakova-Trajkov, G., Haeberling, I. S., Roberts, R. P., & Corballis, M. C. (2010). Cerebral asymmetries: Complementary and independent processes. PLoS One, 5(3), e9682–e9682. doi:https://doi.org/10.1371/journal.pone.0009682
- Basic, S., Hajnsek, S., Poljakovic, Z., Basic, M., Culic, V., & Zadro, I. (2004). Determination of cortical language dominance using functional transcranial Doppler sonography in left-handers. Clinical Neurophysiology, 115(1), 154–160. doi:https://doi.org/10.1016/S1388-2457(03)00281-5
- Bishop, D. V. M., Ross, V. a., Daniels, M. S., & Bright, P. (1996). The measurement of hand preference: A validation study comparing three groups of right-handers. British Journal of Psychology, 87, 269–285. doi:https://doi.org/10.1111/j.2044-8295.1996.tb02590.x
- Bishop, D. V. M., Watt, H., & Papadatou-Pastou, M. (2009). An efficient and reliable method for measuring cerebral lateralization during speech with functional transcranial Doppler ultrasound. Neuropsychologia, 47(2), 587–590. doi:https://doi.org/10.1016/j.neuropsychologia.2008.09.013
- Bozeat, S., Lambon Ralph, M. A., Patterson, K., Garrard, P., & Hodges, J. R. (2000). Non-verbal semantic impairment in semantic dementia. Neuropsychologia, 38(9), 1207–1215. doi:https://doi.org/10.1016/S0028-3932(00)00034-8
- Bradshaw, A. R., Thompson, P. A., Wilson, A. C., Bishop, D. V. M., & Woodhead, Z. V. J. (2017). Measuring language lateralisation with different language tasks: A systematic review. PeerJ, 5, e3929. doi:https://doi.org/10.7717/peerj.3929
- Bruckert, L. (2016). Is language laterality related to language abilities? Oxford: University of Oxford.
- Buchinger, C., Flöel, A., Lohmann, H., Deppe, M., Henningsen, H., & Knecht, S. (2000). Lateralization of expressive and receptive language functions in healthy volunteers. Neuro Image, 11(5), S317. doi:https://doi.org/10.1016/S1053-8119(00)91249-7
- Carey, D. P., & Johnstone, L. T. (2014). Quantifying cerebral asymmetries for language in dextrals and adextrals with random-effects meta analysis. Frontiers in Psychology, 5(November), 1–23. doi:https://doi.org/10.3389/fpsyg.2014.01128
- Conrad, B., & Klingelhofer, J. (1989). Dynamics of regional cerebral blood flow for various visual stimuli. Experimental Brain Research, 77(2), 437–441. doi:https://doi.org/10.1007/BF00275003
- Cook, R. D. (1977). Detection of influential observation in linear regression. Technometrics, 19(1), 15. doi:https://doi.org/10.2307/1268249
- Deppe, M., Ringelstein, E. B., & Knecht, S. (2004). The investigation of functional brain lateralization by transcranial Doppler sonography. NeuroImage, 21(3), 1124–1146. doi:https://doi.org/10.1016/j.neuroimage.2003.10.016
- Dodoo-Schittko, F., Rosengarth, K., Doenitz, C., & Greenlee, M. W. (2012). Assessing language dominance with functional MRI: The role of control tasks and statistical analysis. Neuropsychologia, 50(11), 2684–2691. doi:https://doi.org/10.1016/j.neuropsychologia.2012.07.032
- Dräger, B., & Knecht, S. (2002). When finding words becomes difficult: Is there activation of the subdominant hemisphere? NeuroImage, 16(3), 794–800. doi:https://doi.org/10.1006/nimg.2002.1095
- Flöel, A., Buyx, A., Breitenstein, C., Lohmann, H., & Knecht, S. (2005). Hemispheric lateralization of spatial attention in right- and left-hemispheric language dominance. Behavioural Brain Research, 158(2), 269–275. doi:https://doi.org/10.1016/j.bbr.2004.09.016
- Gaillard, W. D., Balsamo, L., Xu, B., McKinney, C., Papero, P. H., Weinstein, S., … Theodore, W. H. (2004). fMRI language task panel improves determination of language dominance. Neurology, 63(8), 1403–1408. doi:https://doi.org/10.1212/01.WNL.0000141852.65175.A7
- Groen, M. A., Whitehouse, A. J. O., Badcock, N. A., & Bishop, D. V. M. (2013). Associations between handedness and cerebral lateralisation for language: A comparison of three measures in children. PLoS ONE, 8(5), e64876. doi:https://doi.org/10.1371/journal.pone.0064876
- Gutierrez-Sigut, E., Payne, H., & MacSweeney, M. (2015). Investigating language lateralization during phonological and semantic fluency tasks using functional transcranial Doppler sonography. Laterality, 20(1), 49–68. doi:https://doi.org/10.1080/1357650X.2014.914950
- Häberling, I. S., Badzakova-Trajkov, G., Corballis, M. C., Haeberling, I. S., Badzakova-Trajkov, G., & Corballis, M. C. (2011). Callosal tracts and patterns of hemispheric dominance: A combined fMRI and DTI study. NeuroImage, 54(2), 779–786. doi:https://doi.org/10.1016/j.neuroimage.2010.09.072
- Häberling, I. S., Steinemann, A., & Corballis, M. C. (2016). Cerebral asymmetry for language: Comparing production with comprehension. Neuropsychologia, 80, 17–23. doi:https://doi.org/10.1016/j.neuropsychologia.2015.11.002
- Harrington, G. S., Buonocore, M. H., & Tomaszewski Farias, S. (2006). Intrasubject reproducibility of functional MR imaging activation in language tasks. American Journal of Neuroradiology, 27(4), 938–944. doi:https://doi.org/27/4/938.[pii].
- Hickok, G., & Poeppel, D. (2007). The cortical organization of speech processing. Nature Reviews Neuroscience, 8(5), 393–402. doi:https://doi.org/10.1038/nrn2113
- Hoaglin, D. C., & Iglewicz, B. (1987). Fine tuning some resistant rules for outlier labeling. Journal of American Statistical Association, 82(400), 1147–1149. doi:10.1080/01621459.1987.10478551
- Howard, D., & Patterson, K. E. (1992). The pyramids and palm trees test: A test for semantic access from words and pictures. Bury St Edmunds, UK: Thames Valley Test Company Ltd., 16. Retrieved from https://books.google.be/books/about/The_Pyramids_and_Palm_Trees_Test.html?id=dykONQAACAAJ&redir_esc=y
- Illingworth, S., & Bishop, D. V. M. (2009). Atypical cerebral lateralisation in adults with compensated developmental dyslexia demonstrated using functional transcranial Doppler ultrasound. Brain and Language, 111(1), 61–65. doi:https://doi.org/10.1016/j.bandl.2009.05.002
- Jansen, A., Menke, R., Sommer, J., Förster, A. F., Bruchmann, S., Hempleman, J., … Knecht, S. (2006). The assessment of hemispheric lateralization in functional MRI-robustness and reproducibility. NeuroImage, 33(1), 204–217. doi:https://doi.org/10.1016/j.neuroimage.2006.06.019
- Jefferies, E., & Lambon Ralph, M. A. (2006). Semantic impairment in stroke aphasia versus semantic dementia: A case-series comparison. Brain, 129(8), 2132–2147. doi:https://doi.org/10.1093/brain/awl153
- Knecht, S. (2000). Handedness and hemispheric language dominance in healthy humans. Brain, 123(12), 2512–2518. doi:https://doi.org/10.1093/brain/123.12.2512
- Knecht, S., Deppe, M., Dräger, B., Bobe, L., Lohmann, H., Ringelstein, E., & Henningsen, H. (2000). Language lateralization in healthy right-handers. Brain, 123, (1), 74–81. doi:https://doi.org/10.1093/brain/123.1.74
- Knecht, S., Deppe, M., Ebner, A., Henningsen, H., Huber, T., Jokeit, H., & Ringelstein, E. B. (1998). Noninvasive determination of language lateralization by functional transcranial Doppler sonography: A comparison with the Wada test. Stroke, 29(1), 82–86. doi:https://doi.org/10.1161/01.STR.29.1.82
- Krach, S., Chen, L. M., & Hartje, W. (2006). Comparison between visual half-field performance and cerebral blood flow changes as indicators of language dominance. Laterality, 11(2), 122–140. doi:https://doi.org/10.1080/13576500500384975
- Krach, S., & Hartje, W. (2006). Comparison of hemispheric activation during mental word and rhyme generation using transcranial Doppler sonography. Brain and Language, 96(3), 269–279. doi:https://doi.org/10.1016/j.bandl.2005.05.003
- Lust, J. M., Geuze, R. H., Groothuis, A. G. G., & Bouma, A. (2011). Functional cerebral lateralization and dual-task efficiency-testing the function of human brain lateralization using fTCD. Behavioural Brain Research, 217(2), 293–301. doi:https://doi.org/10.1016/j.bbr.2010.10.029
- Mazoyer, B., Zago, L., Jobard, G., Crivello, F., Joliot, M., Perchey, G., … Soriano-Mas, C. (2014). Gaussian mixture modeling of hemispheric lateralization for language in a large sample of healthy individuals balanced for handedness. PLoS One, 9(6), 9–14. doi:https://doi.org/10.1371/journal.pone.0101165
- McMahon, C. J., McDermott, P., Horsfall, D., Selvarajah, J. R., King, A. T., & Vail, A. (2007). The reproducibility of transcranial Doppler middle cerebral artery velocity measurements: Implications for clinical practice. British Journal of Neurosurgery, 21(1), 21–27. doi:https://doi.org/10.1080/02688690701210539
- Noppeney, U., Phillips, J., & Price, C. (2004). The neural areas that control the retrieval and selection of semantics. Neuropsychologia, 42(9), 1269–1280. doi:https://doi.org/10.1016/j.neuropsychologia.2003.12.014
- Ocklenburg, S., Hugdahl, K., & Westerhausen, R. (2013). Structural white matter asymmetries in relation to functional asymmetries during speech perception and production. Neuro Image, 83, 1088–1097. doi:https://doi.org/10.1016/j.neuroimage.2013.07.076
- Oldfield, R. C. (1971). The assessment and analysis of handedness: The Edinburgh inventory. Neuropsychologia, 9(1), 97–113. doi:https://doi.org/10.1016/0028-3932(71)90067-4
- Patterson, K. E., Nestor, P. J., & Rogers, T. T. (2007). Where do you know what you know? The representation of semantic knowledge in the human brain. Nature Reviews Neuroscience, 8(12), 976–987. doi:https://doi.org/10.1038/nrn2277
- Phillips, N. (2017). yarrr: A companion to the e-Book “YaRrr!: The Pirate’s Guide to R”. R package version 0.1.6. Retrieved from www.thepiratesguidetor.com
- Powell, J. L., Kemp, G. J., & Garcia-Finana, M. (2012). Association between language and spatial laterality and cognitive ability: An fMRI study. NeuroImage, 59(2), 1818–1829. doi:https://doi.org/10.1016/j.neuroimage.2011.08.040
- Pujol, J., Deus, J., Losilla, J. M., & Capdevila, A. (1999). Cerebral lateralization of language in normal left-handed people studied by functional MRI. Neurology, 52(5), 1038–1043.
- Rasmussen, T., & Milner, B. (1977). The role of early left-brain injury in determining lateralization of cerebral speech functions. Annals of the New York Academy of Sciences, 299, 355–359. doi:10.1111/j.1749-6632.1977.tb41921.x
- Ricci, P. T., Zelkowicz, B. J., Nebes, R. D., Meltzer, C. C., Mintun, M. A., & Becker, J. T. (1999). Functional neuroanatomy of semantic memory: Recognition of semantic associations. Neuro Image, 9(1), 88–96. doi:https://doi.org/10.1006/nimg.1998.0386
- Rice, G. E., Ralph, M. A. L., & Hoffman, P. (2015). The roles of left versus right anterior temporal lobes in conceptual knowledge: An ALE meta-analysis of 97 functional neuroimaging studies. Cerebral Cortex, 25(11), 4374–4391. doi:https://doi.org/10.1093/cercor/bhv024
- RStudio Team. (2015). RStudio: Integrated development environment for R. Boston, MA. Retrieved from http://www.rstudio.com/
- Seghier, M. L., Josse, G., Leff, A. P., & Price, C. J. (2011). Lateralization is predicted by reduced coupling from the left to right prefrontal cortex during semantic decisions on written words. Cerebral Cortex, 21(7), 1519–1531. doi:https://doi.org/10.1093/cercor/bhq203
- Somers, M., Aukes, M. F., Ophoff, R. A., Boks, M. P., Fleer, W., de Visser, K. (. ). L., … Sommer, I. E. (2015). On the relationship between degree of hand-preference and degree of language lateralization. Brain and Language, 144, 10–15. doi:https://doi.org/10.1016/j.bandl.2015.03.006
- Somers, M., Neggers, S. F., Diederen, K. M., Boks, M. P., Kahn, R. S., & Sommer, I. E. (2011). The measurement of language lateralization with functional transcranial Doppler and functional MRI: A critical evaluation. Frontiers in Human Neuroscience, 5(March), 31. doi:https://doi.org/10.3389/fnhum.2011.00031
- Stroobant, N., Buijs, D., & Vingerhoets, G. (2009). Variation in brain lateralization during various language tasks: A functional transcranial Doppler study. Behavioural Brain Research, 199(2), 190–196. doi:https://doi.org/10.1016/j.bbr.2008.11.040
- Stroobant, N., & Vingerhoets, G. (2001). Test-retest reliability of functional transcranial Doppler ultrasonography. Ultrasound in Medicine & Biology, 27(4), 509–514. doi:https://doi.org/0.1016/S0301-5629(00)00325-2
- Szaflarski, J. P., Binder, J. R., Possing, E. T., McKiernan, K. A., Ward, B. D., & Hammeke, T. A. (2002). Language lateralization in left-handed and ambidextrous people. Neurology, 59(2), 238–244. doi:https://doi.org/10.1212/WNL.59.2.238
- Tailby, C., Abbott, D. F., & Jackson, G. D. (2017). The diminishing dominance of the dominant hemisphere: Language fMRI in focal epilepsy. NeuroImage: Clinical, 14, 141–150. doi:https://doi.org/10.1016/j.nicl.2017.01.011
- Vernooij, M. W., Smits, M., Wielopolski, P. A., Houston, G. C., Krestin, G. P., & van der Lugt, A. (2007). Fiber density asymmetry of the arcuate fasciculus in relation to functional hemispheric language lateralization in both right- and left-handed healthy subjects: A combined fMRI and DTI study. NeuroImage, 35(3), 1064–1076. doi:https://doi.org/10.1016/j.neuroimage.2006.12.041
- Westerhausen, R., Kreuder, F., Sequeira, S., Dos, S., Walter, C., Woerner, W., … Wittling, W. (2006). The association of macro- and microstructure of the corpus callosum and language lateralisation. Brain and Language, 97(1), 80–90. doi:https://doi.org/10.1016/j.bandl.2005.07.133
- Whitehouse, A. J. O., & Bishop, D. V. M. (2009). Hemispheric division of function is the result of independent probabilistic biases. Neuropsychologia, 47(8–9), 1938–1943. doi:https://doi.org/10.1016/j.neuropsychologia.2009.03.005
- Whitney, C., Kirk, M., O’Sullivan, J., Lambon Ralph, M. A., & Jefferies, E. (2012). Executive semantic processing is underpinned by a large-scale neural network: Revealing the contribution of left prefrontal, posterior temporal, and parietal cortex to controlled retrieval and selection using TMS. Journal of Cognitive Neuroscience, 24(1), 133–147. doi:https://doi.org/10.1162/jocn_a_00123
- Woodhead, Z. V. J., Bradshaw, A., Wilson, A., Thompson, P., & Bishop, D. V. (2019). Testing the unitary theory of language lateralization using functional transcranial Doppler sonography in adults. Royal Society Open Science, 6(3), 181801. doi:https://doi.org/10.1098/rsos.181801
- Woodhead, Z. V. J., Rutherford, H. A., & Bishop, D. V. M. (2020). Measurement of language laterality using functional transcranial Doppler ultrasound: A comparison of different tasks. Wellcome Open Research, 3(May), 104. doi:https://doi.org/10.12688/wellcomeopenres.14720.3
- Woodhead, Z. V. J., Thompson, P. A., Karlsson, E. M., & Bishop, D. V. M. (2020). Investigating multidimensionality of language lateralisation in left and right handed adults: An update on Woodhead et al. 2019. PsyArXiv, September. doi:https://doi.org/10.31234/osf.io/mrkgf