
ABSTRACT
Lyotropic liquid crystal dispersions have commercial importance in the formulation of cleaning products and pharmaceuticals. The anisotropy of such dispersions is an important aspect of their properties and a simple method for measurement would be valuable to formulators. The relatively new optical technique of reflectance anisotropy spectroscopy (RAS) was considered to have potential in this respect. To test the idea, the anisotropy of a binary mixture of an anionic surfactant Aerosol OT (AOT) and glycerol (used as a model for water) was investigated using RAS. The variation in the measured anisotropy parallels the expected behaviour of a dispersion of lyotropic liquid crystals as a function of concentration and temperature. A response surface of anisotropy generated as a function of temperature and surfactant concentration demonstrates the use of RAS as a tool for mapping liquid anisotropy to facilitate the formulation of structured liquids.
Introduction
Lyotropic liquid crystal dispersions in formulations
Lyotropic liquid crystals are well known [Citation1,Citation2]. Lyotropic liquid crystals form when amphiphilic anisotropic molecules (i.e., molecules that are hydrophobic at one end and hydrophilic at the other) self-assemble in both polar and nonpolar solvents.
In formulation studies, phase boundaries apparently observed for lyotropic liquid crystals can be the result of kinetically stable artefacts caused by the self-suspension of dispersions as the viscosity of the formulation increases [Citation3]. Evidence for this effect is provided by fast freezing coupled with electron microscopy which enables the observation of submicron lamellar phase droplets [Citation4].
Lyotropic liquid crystal dispersions at the submicron level have commercial value across a wide range of applications including fabric washing, fabric care (softening) and hard surface cleaning (including dental care) and have potential in the controlled release and delivery of pharmaceuticals.
Lyotropic liquid crystal dispersions are often formulated to utilise the self-assembly of a mixture of anionic and nonionic surfactants in the presence of electrolytes to provide the desired rheological control (or ‘structuring’) of liquids or pastes. Desirable rheological properties include the ability to dynamically suspend minerals such as calcite and silica abrasives with particle sizes of the order of tens of microns in highly shear-thinning liquids, suspension of surfactant in liquids for washing and softening fabrics, and adding ‘cling’ to hypochlorite solutions for cleaning toilet bowls.
The rheological properties of liquid crystal dispersions may be characterised by a flow curve that is a plot of viscosity against shear rate, and are ultimately derived from the alignment of anisotropic units in a shear field. Flow curves can be modelled by mathematical equations to obtain parameters that can be used in formulation optimisation. One such parameter is the limiting viscosity at high shear rate. Such measurements are time-consuming.
Anisotropy
Lyotropic liquid crystals form thermodynamically stable phases, a large proportion of which adopt anisotropic structures, for example, hexagonal phase or lamellar phase. When lyotropic liquid crystals are viewed between crossed polarisers in polarised light microscopy, textures are seen which are characteristic of the different phases formed [Citation2,Citation5]. A particular problem is that submicron lyotropic liquid crystal phase droplets cannot be visualised by this technique with the magnification available to an optical microscope at the limit of its capability. What is desirable is a reasonably fast, non-destructive quantitative measurement of the degree of anisotropy.
Reflectance anisotropy spectroscopy
Reflectance anisotropy spectroscopy (RAS) is a relatively recent optical technique which also relies on polarised light [Citation6]. Derived from spectroscopic ellipsometry, RAS is designed to operate in the visual/UV spectral range (225–825 nm, 1.5–5.5 eV) but with the beam applied at normal incidence. This allows a much less model-dependent analysis of spectra, particularly for the determination of film thickness which is simply proportional to the RAS signal strength. In essence, a beam of collimated, polarised light impinges on a target sample at normal incidence and is reflected and dispersed through a monochrometer on to a detector. The anisotropy of the sample is obtained from the intensity of the reflected beam and is in effect, the difference in intensity as a result of the light absorbance in the plane of the sample in orthogonal directions. For an isotropic sample, the difference is zero. A schematic of the apparatus is shown in .
Figure 1. Schematic of the instrument for the measurement of reflectance anisotropy.
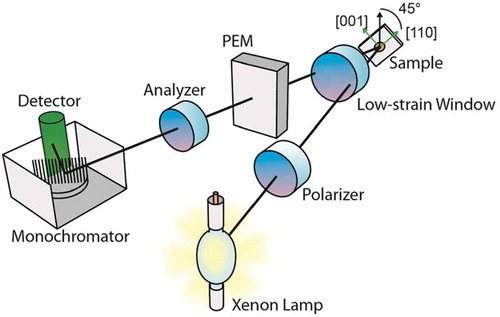
In principle, RAS could provide a relatively simple and fast method for optically quantifying the degree of anisotropy of a formulation, provided there is a suitable chromophore within the spectroscopic range. This will generally be the case for carbon compounds that include the elements of oxygen, nitrogen and sulphur. The ability to map the anisotropy of a given formulation space as a function of composition and temperature would permit the rapid optimisation of formulations that rely on the self-assembly of molecules in solution. The optical anisotropy measured by RAS could, therefore, be a useful parameter for formulation optimisation which could lend itself to high-throughput experimentation. One limitation is that samples need to be transparent as light scattering tends to depolarise light and degrade the signal.
Aim of work
The aim of this work was to explore the possibility of using RAS to map the changes in the degree of anisotropy of solutions of a single surfactant, di-octyl sulphosuccinate in glycerol, held between microscope coverslips, as a function of temperature. Glycerol was used as a model for water in these experiments because of its relatively low volatility given the use of just coverslips to contain the solutions. The two-tailed di-octyl sulphosuccinate molecule is known to form lyotropic liquid crystals in glycerol [Citation7]. Di-alkyl sulphosuccinates have been disclosed in a patent for highly concentrated detergent compositions [Citation8].
Experimental section
Materials
Sodium bis(2-ethyl hexyl) sulphosuccinate () was obtained as Aerosol OT (AOT) from Sigma-Aldrich (Gillingham, UK) (99% purity). Glycerol was also obtained from Sigma-Aldrich and used without purification.
Figure 2. Structure of sodium bis(2-ethyl hexyl) sulphosuccinate.
Methods
Solutions of AOT in glycerol were prepared by weighing and stirring overnight at a temperature of 60°C to ensure complete dissolution. Concentrations of 30, 40 and 50 wt.% of AOT in glycerol were prepared. The solutions were examined between quartz coverslips to confirm optical anisotropy using a polarising light microscope.
Reflectance spectra of these solutions were obtained as a function of wavelength in the range 1.5–5.5 eV and as a function of temperature (23–50°C). The RAS instrument that was used followed the Aspnes design [Citation9] and was equipped with a xenon arc light source. The solutions were contained between quartz coverslips placed on a heating stage equipped with a temperature monitor. The lower coverslip was painted on the underside with a heat-resistant black paint to minimise backscattered light. The heating stage and sample were aligned with the beam. Samples were rotated in the horizontal plane to obtain the optimal orientation for the maximum signal strength for the spectrum. A peak in the sample spectra was located around 4.7 eV (264 nm) and afforded a convenient measure of signal strength. A control using just glycerol showed a relatively flat, featureless spectrum.
Results and discussion
Qualitative optical anisotropy
The work of Petrov et al. [Citation7] has demonstrated the existence of a region of lamellar phase for solutions of 30–50% AOT in glycerol in the temperature region of 20°C to about 50°C. Microscopic examination of our solutions of 40% and 50% AOT in glycerol using polarised light at 25°C clearly showed the features characteristic of lamellar phase – oily streaks and ‘Maltese’ crosses. These features disappeared as the 40% sample was heated to 40°C and the phase melted and so became isotropic.
Quantitative measurement of anisotropy
The anisotropy of the three concentrations of AOT was measured at 4.7 eV (264 nm) at 25°C, 30°C, 40°C and 50°C. The results are presented in .
Table 1. Variation of anisotropy with temperature and concentration of AOT.
The variation of anisotropy with temperature and concentration of AOT gratifyingly shows the changes expected; the anisotropy tends to fall as the temperature is increased and tends to increase with concentration. The relationship between the measured anisotropy and the variables of concentration and temperature was explored using the statistical technique of analysis of variance using the JMP statistical software [Citation10]. The results of the analysis are shown in .
Table 2. Analysis of variance of anisotropy.
The analysis of variance shows a highly significant variation of the measured anisotropy with both temperature and concentration at the 99.7% confidence level. The data was further analysed to obtain the graphical response surface (or map) for the statistically smoothed variation of anisotropy with temperature and concentration of AOT. The response surface analysis (–) clearly shows the effect, a strong interaction between the temperature and the AOT concentration on the anisotropy. Using the parameter estimates (), an equation can be constructed to calculate values for the anisotropy for values of concentration and temperature:
Table 3. Response surface analysis of anisotropy as a function of temperature and concentration of AOT – summary of model fit.
Table 4. Response surface analysis of anisotropy as a function of temperature and concentration of AOT – parameter estimates.
Table 5. Response surface analysis of anisotropy as a function of temperature and concentration of AOT – effect test.
Anisotropy = C0 + C1*AOT + C2*T + C11*AOT*AOT +C22*T*T + C12*AOT*T
where the constants C0, C1, C2, C11, C22 and C12 are substituted for the appropriate parameter estimates from .
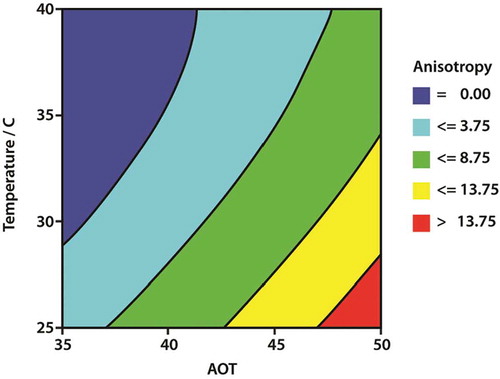
Using this equation, a smoothed response surface was constructed for positive values of the anisotropy using the Persistence of Vision Raytracer (POV-Ray) drawing software [Citation11]. The response surface is shown in .
Figure 3. Response surface of the anisotropy of AOT in glycerol as a function of temperature and concentration (per cent).
Conclusions
This model study has demonstrated the feasibility of using quantitative measurements of anisotropy obtained from RAS to assist formulation studies. The graphical response surface shows the boundary between the concentration of isotropic solutions and the concentration of solutions that contain lyotropic liquid crystal phases. Moreover, boundaries between different regions of anisotropy are likely to be related to the concentration of the LLC phase and could, therefore, assist a formulator to define a suitable concentration to achieve a desired effect such as the suspension of solids over a range of temperatures.
Acknowledgements
This study was carried out by Elizabeth Prescott in partial fulfilment of the requirements of the Master of Research Degree at the University of Liverpool and was supervised by Dr. Caroline Smith under the direction of Professor Peter Weightman with the assistance of Dr. Kenneth Rabone (Honorary Senior Fellow). Dr. Jeremy Rabone (Postdoctoral Fellow, Department of Chemistry) is thanked for creating the response surface. Jonathan Rabone M.A. (Engineering, Cantab.) provided excellent computer support.
Disclosure statement
No potential conflict of interest was reported by the authors.
Additional information
Funding
References
- Collings P, Hird M. Introduction to liquid crystals chemistry and physics. London: Taylor & Francis; 1997.
- Tiddy G. Surfactant-water liquid crystal phases. Phys Rep. 1980;57:1–46. DOI:10.1016/0370-1573(80)90041-1
- Berni M, Lawrence C, Machin D. A review of the rheology of the lamellar phase in surfactant systems. Adv Colloid Interface Sci. 2002;98:217–243. DOI:10.1016/S0001-8686(01)00094-X
- Versluis P, van de Pas J, Mellema J. Microstructure and rheology of lamellar liquid crystalline phases. Langmuir. 1997;13:5732–5738. DOI:10.1021/la9702603
- Rosevear F. Liquid crystals: the mesomorphic phases of surfactant composition. J Soc Cosmet Chem. 1968;19:581–594.
- Weightman P, Martin D, Cole R, et al. Reflection anisotropy spectroscopy. Rep Prog Phys. 2005;68:1251–1341. DOI:10.1088/0034-4885/68/6/R01
- Petrov P, Ahir S, Terentjev E. Rheology at the phase transition boundary: 1. Lamellar Lα phase of AOT surfactant solution. Langmuir. 2002;18:9133–9139. DOI:10.1021/la025792k
- Leng F, Lucassen J, Reed D, et al. United States Patent. Detergent compositions. 1988;4:784–800.
- Aspnes D. Above-bandgap optical anisotropies in cubic semiconductors: a visible-near ultraviolet probe of surfaces. J Vac Sci Technol B. 1985;3:1498. DOI:10.1116/1.582974
- JMP - Statistical Discovery Software from SAS. Buckinghamshire: SAS: Marlow; 2015.
- POV-Ray - Persistence of Vision Raytracer. Melbourne: Persistence of Vision Raytracer Pty, Ltd., 2013.