
 ?Mathematical formulae have been encoded as MathML and are displayed in this HTML version using MathJax in order to improve their display. Uncheck the box to turn MathJax off. This feature requires Javascript. Click on a formula to zoom.
ABSTRACT
Structure and optical transmission properties of spontaneously formed diffraction gratings by bent-core liquid crystalline materials that exhibit a twist-bend nematic (NTB) phase transition, when confined in thin planar cells are reported. We begin with experimentally measuring the polarisation properties of diffraction peaks up to the second-order and observe a generalised behaviour of polarisation of the first-order peaks. Moreover, we show that the study of the second-order diffraction peaks combined with the proposed preliminary model can be an effective tool to predict the spatial variation of the optic axis. Then, we build a continuum model that describes the formation of gratings as a result of competition between surface conditions and bulk strain due to the shrinking of pseudo-layers and determine the threshold conditions on the onset of a 2D pseudo-layer structure of the NTB phase. We use the beam propagation method and transfer matrix method to calculate the transmissivity of diffracted light by using the spatial variation of the optic axis determined from the modelled structure. It is established that the beam propagation method is superior to the transfer matrix method.
1. Introduction
Liquid crystals (LCs) are an intermediate state of matter, they flow like liquids and their physical properties are anisotropic, which is characteristic of crystals. The exhibition of various phases upon changing the temperature defines the thermotropic liquid crystals. In the following, we will limit ourselves to thermotropic LCs made of rod-like and bent-like molecules. Let us first consider LCs made of rod-like molecules with mirror symmetry (achiral molecules). The simplest liquid crystal (LC) phase, nematic (N), is characterised by a long-range orientational order: on average, the long axes of the molecules are oriented along the common direction, which is usually denoted by a unit vector called the director. In the N phase (), there is no arrangement of the centres of mass of the molecules. By lowering the temperature, we can get a transition to the smectic phase, where the molecules are arranged in layers and acquire at least one-dimensional positional order. There is still no arrangement of mass centres within the layers. If the director
is oriented in a direction perpendicular to the smectic layer, the phase is called a smectic-A phase (), and if it is inclined at an angle relative to the layer normal, it is a smectic-C phase [Citation1–3].
Figure 1. (a) Nematic (N) and (b) smectic-A liquid crystalline phase made from achiral rod-like molecules. (c) Cholesteric phase (N*) made of chiral rod-like molecules. and
represents the nematic director, i.e. a local average orientation of the long molecular axes,
is the pitch of the twisted helix and
is the smectic layer thickness.
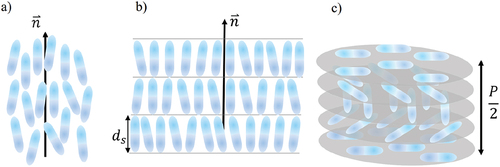
When the constituent molecules are chiral (without mirror symmetry), the number of phases and their complexity increases greatly. Such as the cholesteric phase (N*) (), where a spontaneous twist of the director field appears: the director rotates along an axis perpendicular to it and the
rotation defines the pitch of the helical modulation [Citation1–3]. When the basic building blocks are chiral molecules, many smectic phases are also obtained. Such as the chiral smectic-C phase, which is ferroelectric [Citation4] and very interesting. Due to the direct coupling between the spontaneous polarisation and the electric field, the orientation of the molecules can be changed in a few orders of magnitude in a shorter time than with nematics, thus producing, e.g. fast electro-optic switches. However, it is difficult to make defect-free cells [Citation5], which greatly limits its usefulness.
Here, we report the N LC phase made of bent molecules, in which the spatial modulation of the director field appears that the bent molecules rotate on a cone with an arbitrary conical tilt angle along the heliconical axis (). It therefore forms a chiral structure despite the fact the molecules are achiral. In smectic phases made of bent-core molecules, the tilt of the molecules is no longer necessary to establish polar order, so even the smectic-A phase can be ferroelectric [Citation7,Citation8], which could lead to the improvement of display technologies [Citation9]. The chiral arrangement in achiral bent molecules was first observed two decades ago [Citation10–12], then also the phase transition between the nematic and modulated nematic phase [Citation13], and the modulation was attributed to the twist-bend deformation of the director [Citation14], which was previously predicted theoretically [Citation15,Citation16] and with computer simulations [Citation17]. According to the electro-optical properties of chiral domains, the pitch of the helix was found to be in the order of nanometres [Citation18,Citation19], and further analysis of the structure showed that the pitch is approximately [Citation20–22]. As it turns out, the structure is more complex than a single helix. The resonant soft x-ray scattering revealed that the structure consists of two interlocked and slightly shifted helices [Citation23,Citation24].
Figure 2. (a) in the twist-bend nematic phase, the far ends of the bent molecules rotate on a cone with a heliconical pitch and
is the tilt angle. This is the simplified figure, there are no layers. (b) Three-dimensional undulation of a pseudo-layer of thickness
in a thin planar cell of thickness
(c) results in a striped pattern that acts as a diffraction grating with period
. The yellow lines in (b) represent the local direction perpendicular to the layer (the local direction of the heliconical axis) and thus the local direction of the optical axis. The length of the measurement line in (c) represents the length of
. Reproduced from Ref. [Citation6] with permission from John Wiley & Sons.
![Figure 2. (a) in the twist-bend nematic phase, the far ends of the bent molecules rotate on a cone with a heliconical pitch d and θ is the tilt angle. This is the simplified figure, there are no layers. (b) Three-dimensional undulation of a pseudo-layer of thickness d in a thin planar cell of thickness L (c) results in a striped pattern that acts as a diffraction grating with period d. The yellow lines in (b) represent the local direction perpendicular to the layer (the local direction of the heliconical axis) and thus the local direction of the optical axis. The length of the measurement line in (c) represents the length of 10\mum. Reproduced from Ref. [Citation6] with permission from John Wiley & Sons.](/cms/asset/a79402d3-0702-42da-b715-4574ca79bd2f/tlcy_a_2168968_f0002_c.jpg)
In the following, we discuss the structure of the twist-bend nematic phase (NTB) when confined in thin cells with planar anchoring. Confinement of the phase into planar cells affects the arrangement of the molecules, which is different than in the unconfined phase due to the influence of the surface and gives more insight into the structural properties of the NTB phase.
2. Structure and optical properties of the twist-bend nematic phase
2.1. Formation of diffraction gratings
The diffraction gratings form spontaneously when a liquid crystalline material exhibiting the NTB is confined in thin planar cells. Since the pitch of the NTB phase is much smaller (only molecular lengths) than the wavelength of visible light, NTB is optically uniaxial phase with an optical axis along the helix. The ordinary and extraordinary refractive indices are dependent on the conical tilt angle , which, in turn, depends on the temperature and increases with decreasing temperature. In planar cells with a uniform surface alignment, stripe texture appears and the periodicity of the stripe texture is always approximately twice the cell thickness [Citation6,Citation13,Citation18,Citation19,Citation25–29]. The formation of a periodic stripe texture is explained as follows. Due to the short pitch of the heliconical modulation, the NTB phase behaves as a pseudo-layered medium and the pitch is strongly temperature-dependent close to the N – NTB phase transition; the modulation is formed at the phase transition and the pitch reduces when the temperature is lowered. However, close to the surface, the modulation is ‘anchored’ by the surface forces, so the pitch close to the surface does not change. As a result, pseudo-layers start to undulate in two dimensions: parallel to the surfaces (horizontal chevron) and perpendicular to the surfaces (vertical chevron) (). This leads to a spatial variation of the optic axis direction and, in turn, to the appearance of a stripe pattern in optical textures observed under a polarising microscope (). The stripe pattern acts as a grating, which efficiently diffracts light and also affects the polarisation properties of the scattered light [Citation6,Citation26,Citation29]. A regular stripe texture is formed only when cells are thin enough (up to approximately
), in thicker cells focal conics are formed [Citation6,Citation13,Citation18,Citation19,Citation25–29].
2.2. Measurements of optical transmission properties
First, we measure the properties of the light diffracted by the modulated structure formed in the NTB phase by two bent dimers, CB7CB [Citation14] and CB6OCB [Citation30]. Their molecular structures are shown below (). We prepared the cells with planar surface anchoring of several thicknesses and checked the quality of alignment under a polarising optical microscope. The direction of the optical axis in the NTB phase is determined from the decrease in the birefringence in the NTB phase with respect to the extrapolated birefringence of the nematic measurements [Citation6,Citation29,Citation31]. We measured the polarisation and intensity of the diffracted light. The measurements were performed only in thin cells of CB7CB and CB6OCB ( and
, respectively), as there are too many defects in the thicker ones and consequently the diffracted pattern is not very well defined [Citation6,Citation13,Citation18,Citation19,Citation25–29].
Figure 3. Molecular structure of the two studied materials and their phase transition temperatures in .
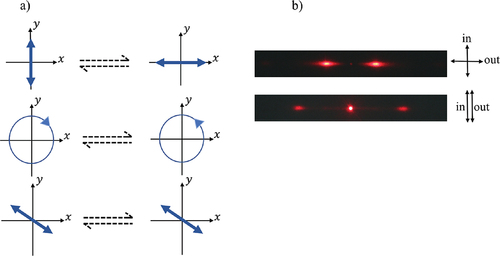
summarises the key properties of diffracted light. We observe diffraction peaks up to the second-order of diffraction and measured the polarisation properties and intensity of the diffracted light. We observed that the polarisation of the direct outgoing beam depends on the birefringence, which together with the cell thickness defines the net phase difference between the ordinary and extraordinary wave upon traversing the cell. At temperatures far below the N – NTB phase transition and 633 nm wavelength incident light, the and -
thick cells of CB7CB and CB6OCB, respectively, behave as a quarter-wave plate for the direct beam: the outgoing direct beam is almost linearly polarised for the circularly polarised (CP) incident light and vice versa. For the first-order diffraction beams the general behaviour is observed for both samples: the horizontally/vertically linearly polarised (H/VLP) incident light is transformed into vertically/horizontally linearly polarised and the right/left circularly polarised (R/LCP) incident light transforms into left/right circularly polarised light. The polarisation plane of the diagonally linearly polarised (DLP) incident light is not rotated (). Polarisation of the second-order diffraction peaks: HLP remains HLP and VLP remains VLP ().
Figure 4. (a) General polarisation properties of first-order diffraction beams: vertically linearly polarised (VLP) incident light has the plane of polarisation rotated by 90 degrees and is horizontally linearly polarised (HLP) after the transition; right circularly polarised light is transformed into left circularly polarised, while diagonally polarised light does not change the plane of polarisation. (b) For VLP and HLP incident light, the plane of polarisation does not change in second-order diffraction beams.
Experimentally, the internal structure of the cell has the greatest effect on the polarisation of the second-order diffraction peaks if the incident light is circularly polarised. The polarisation state of the diffracted light for the LCP incident light changes from being nearly DLP at a lower temperature (deep in the NTB phase) to nearly CP close to the NTB – N phase transition temperature (). In both studied cells, we observed an asymmetry between the second-order diffraction peaks.
Figure 5. Temperature dependence of the polarisation of the second-order diffraction beams (red: , blue:
) in the case of left circularly polarised incident light for CB7CB in a cell with thickness (a)
and (b) CB6OCB in
. The polarisation is represented on the Poincaré sphere, where the Stokes parameters are normalised,
and
related to the inclination of the long axis of the ellipse (
) and ellipticity
. Black arrows show the direction of temperature increase. (a) Adapted from Ref. [Citation6] with permission from John Wiley & Sons.
![Figure 5. Temperature dependence of the polarisation of the second-order diffraction beams (red: +2q0, blue: −2q0) in the case of left circularly polarised incident light for CB7CB in a cell with thickness (a) 1.6μm \mum and (b) CB6OCB in 1.5μm \mum. The polarisation is represented on the Poincaré sphere, where the Stokes parameters are normalised, S1=cos2Ψcos2e, S2=sin2Ψcos2eand S3=sin2e related to the inclination of the long axis of the ellipse (Ψ) and ellipticity e. Black arrows show the direction of temperature increase. (a) Adapted from Ref. [Citation6] with permission from John Wiley & Sons.](/cms/asset/13db1880-c78b-497e-b236-4b3672b29f7d/tlcy_a_2168968_f0005_c.jpg)
3. Theoretical models
3.1. Preliminary model
In the first approach, to account for the observed properties of the diffracted light and to simplify the description of spontaneously formed gratings, we considered different one-dimensional with two variable models [Citation6,Citation29]. In the following, we present only the model which describes best the polarisation properties of the diffracted light. We proposed a model with sinusoidal out-of-plane modulation with a phase shift of as follows:
where and
vary periodically along the
-axis with periodicity
(),
and
are the magnitudes of the conical-tilt angle, which represent the amplitudes of the pseudo-layer modulation along the horizontal and vertical direction, respectively and
represents an arbitrary relative shift.
Figure 6. (a) Spatial variation of the optic axis represented by blue arrows of a model (EquationEquation (1)(1)
(1) ) with the modulation period
. Adopted from Ref. [Citation6] with permission from John Wiley & Sons. (b) Spatial dependence of
(blue) and
(red) with a shift
.
![Figure 6. (a) Spatial variation of the optic axis represented by blue arrows of a model (EquationEquation (1)(1) β=β0cos2πDx+s,(1) ) with the modulation period D. Adopted from Ref. [Citation6] with permission from John Wiley & Sons. (b) Spatial dependence of α (blue) and β (red) with a shift s=0.1D.](/cms/asset/27a2527e-828f-442a-9337-7d15f4a1c26a/tlcy_a_2168968_f0006_c.jpg)
The simple one-dimensional model describes the two-dimensional modulated structure as the horizontal undulation causes the rotation of the optic axis by angle and the vertical undulation rotates the optic axis by the angle
. In thin cells, the undulations are smooth and lead to the periodic stripe texture, while in the thick cells the strongly curved layer becomes localised in some areas and in other areas the layers are almost straight, leading to focal conic domains instead of a stripe texture. In the following (sub-section 3.3, and ), we present the numerically calculated polarisation properties of the diffracted light considering the above-discussed preliminary model and using the transfer matrix method.
3.2. Continuum model
In order to adopt a more systematic approach, we build a continuum model for the spontaneous formation of the stripe texture due to the two-dimensional pseudo-layer undulations. First, we assume that the heliconical structure is formed in the direction along the surface, which means that the pseudo-layers are perpendicular to the surfaces, making a bookshelf structure. The compressibility of the pseudo-layer is comparable to the compressibility of the smectic layers with the layer thickness equal to the heliconical pitch. The direction of the smectic layer normal is equal to the direction of the heliconical axis. As the temperature decreases, the helix becomes shorter. Assuming that at the surface the pseudo-layers are strongly anchored thus the thickness of the pseudo-layer cannot be changed there. However, the heliconical pitch (pseudo-layer thickness) can be shortened by undulating the pseudo-layers, as shown in . Thus, we satisfy the condition that the thickness of the pseudo-layer near the surface is equal to , but inside the cell, it depends on the temperature
and is equal to
. Given that a striped structure is observed in the cells, the formation of this vertical undulation also causes modulation in the direction along the surface (horizontal undulation), see .
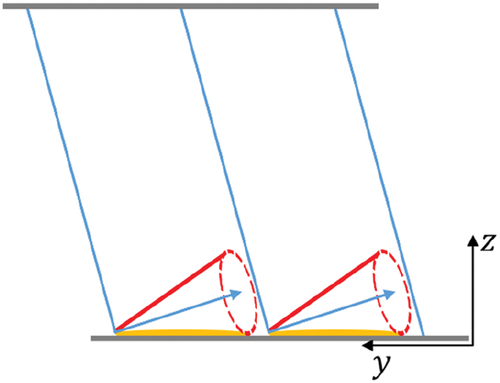
Figure 7. a) a layer that was perpendicular to the surface at the time of its formation and at , displaced by
;
is normal to the smectic layer. b) by undulating the layer, its thickness decreases from
to
. c) Two-dimensional undulation of the pseudo-layer with a period
in the direction of the axis
. Reproduced from [Citation34] with permission from the American physical society.
![Figure 7. a) a layer that was perpendicular to the surface at the time of its formation and at y0, displaced by ux,z; v⇀ is normal to the smectic layer. b) by undulating the layer, its thickness decreases from d to d0T. c) Two-dimensional undulation of the pseudo-layer with a period din the direction of the axis x. Reproduced from [Citation34] with permission from the American physical society.](/cms/asset/a409e631-e5ad-49bb-a573-44cd234b4626/tlcy_a_2168968_f0007_c.jpg)
We are interested in the condition under which a two-dimensional modulated structure is established. We proceed from the condition that the structure with the lowest free energy is stable. The free energy of the system is expressed by the director , which describes the direction of the local heliconical axis and by the complex smectic order parameter
, whose gradient is in the direction perpendicular to the smectic layer,
. We assume that
. As we have already stated, the basic assumption is that the pseudo-layers on the surface are strongly anchored, (see . During the phase transition from N – NTB, the pseudo-layer normal
is in the direction of the
-axis and the heliconical pitch is
. As temperature decreases, the heliconical pitch
reduces and the displacement of the distorted pseudo-layer is represented by the scalar variable,
. For two-dimensional undulations of pseudo-layers, the position of the distorted layer along the
-axis that was initially at
is taken as
The modulation period in the direction -axis is
(). The smectic order parameter is written as
where is . From the assumption the
, director
is then
The competition between the influence of the surface and bulk elastic strain in the NTB phase results in undulations of the pseudo-layers. Therefore, the free energy of the system is written as the sum of bulk and surface free energy:
where is bulk and
is surface free energy density,
and
represent the cell volume and surface area, respectively. The
is written as the sum of the nematic free energy
and free energy density related to smectic layer compressibility
,
The spatial variation of the local heliconical axis is represented by the , which contains contributions due to the splaying, twisting and bending deformation of the director
:
where ,
and
represent splay, twist and bend elastic constants, respectively. The energy density associated with the compressibility of layer thickness is described by the contribution of the form
where and
is the compressibility modulus. The surface energy density is related to the tilt of the pseudo-layer at the surface [Citation32,Citation33]:
where is anchoring strength at the surface. In this work, we consider only two cases: very strong
and very weak
anchoring. In the case of very strong anchoring, it applies
meaning that the pseudo-layers remain perpendicular to the surface. In the case of very weak anchoring, a small tilt is allowed. It should be noted that the surface term (EquationEquation (9))(9)
(9) contains only the slope of the pseudo-layers on the surface. Namely, we assume that the pseudo-layers near the surface, once formed, can no longer move:
For numerical calculation, we introduce dimensionless quantities:
where is the thickness of the cell,
is the amplitude of undulation of the pseudo-layer from the initial position and
is the wavenumber of the modulation in the direction of the
-axis. The dimensionless free Energy
per unit length is defined as
By minimising the dimensionless free energy, we find the threshold conditions for the formation of a modulated structure. The complete procedure of minimising the free energy is described in Ref [Citation34]. In the case of very strong anchoring on the surface , we look for the minimum of free energy with the following displacement field, which satisfies the conditions (EquationEquation (10
(10)
(10) ,Equation11))
(11)
(11) :
In the case of very weak anchoring , the pseudo-layer position should fulfil the condition given by EquationEquation (11)
(11)
(11) and a general tilt on the surface is allowed. Therefore, the displacement field is defined as
We are searching for a condition
at which the modulated structure becomes stable, i.e. the ratio at which the free energy of the modulated structure becomes lower than the energy of the unmodulated structure. We consider the typical parameters [Citation35–38].
the dimensionless parameters are:
The threshold conditions are inversely proportional to the compressibility modulus. In the case of strong anchoring, the threshold is
and in the case of weak anchoring
where represent the threshold value. From EquationEquations (19
(19)
(19) ,Equation20
(20)
(20) ), we see that the threshold value for strong anchoring is higher than the weak anchoring, which is an expected result. Also, the second term in EquationEquations (19
(19)
(19) ,Equation20
(20)
(20) ) are the order of
or lower, which means the modulation becomes stable very close to the N – NTB phase transition.
Until now, we assumed that the pseudo-layers formed at the phase transition to the NTB phase are perpendicular to the surface, which means that the heliconical axis is along the surface and the bent molecules at the surface are tilted. In the following, we assume that the bent molecules lie in the surface plane and the heliconical axis is tilted. So, some finite pre-tilt of pseudo-layers freezes in at the phase transition and therefore the pseudo-layer structure formed at the N – NTB phase transition is titled with respect to the surface. We assume the tilt is equal to the initial conical angle () and when the temperature decreases the heliconical pitch decreases and the tilted layers start to undulate.
Figure 8. The molecules lie with their long axis (yellow) in the plane of the surface, so the axis of the helix (blue arrow) is at some angle to the surface and the layers are no longer perpendicular to the surface.
We follow the same numerical procedure as above to calculate the threshold conditions. In the case of very strong anchoring with a pre-tilt of pseudo-layer, we take the following expression of by adding a pre-tilt term in EquationEquation (14)
(14)
(14) as
where represents the pre-tilt angle. Similarly, in the case of weak anchoring, the corresponding displacement field is
The calculated ratios at which the modulated structure becomes stable are given in . The
increases as the value of
decreases (), the small values of
are consistent with the experimentally measured values of
close to the NTB phase transition [Citation39–41].
Table 1. Numerically calculated values at which the modulated structure becomes stable and the modulation periods
at the formation of the modulated structure at different values of the compressibility modulus
and different pre-tilts of the layers
in the case of very strong and very weak anchoring. Parameter values:
.
Table 2. Theoretically calculated temperature dependence of the polarisation state (azimuth angle and ellipticity
) of the second-order diffraction peaks (
(red dots) and
(blue dots)) for the LCP incident light for CB7CB
, and CB6OCB
, in the case of a very weak and very strong anchoring.
We also searched for the modulation period as a function of
in the region where the modulated structure is stable. The results are shown in . We see that far from N – NTB phase transition temperature, the modulation period in all cases is about twice the cell thickness, which agrees with experimental observations [Citation13].
Figure 9. (a) Period of modulation, and (b) modulation amplitude,
, depending on the ratio
for the case with no pre-tilt of pseudo layers. Red curves: strong anchoring; blue curves: weak anchoring. Parameter values:
,
. Inset in (a) shows the magnified part of
.
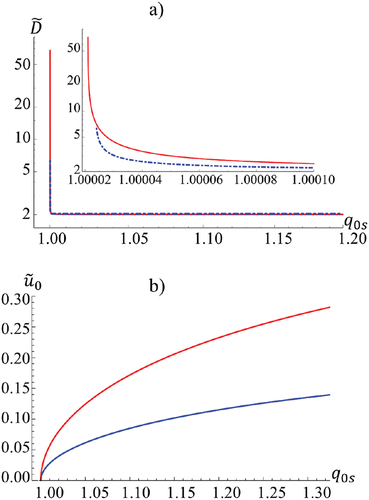
Figure 10. Amplitude of modulation at different values of pre-tilt of pseudo-layers
in the case of (a) very strong and (c) very weak anchoring. The modulation period
is practically the same for (b) very strong and (d) very weak anchoring; blue curves:
, green curves:
and red curves:
. Parameter values:
,
.
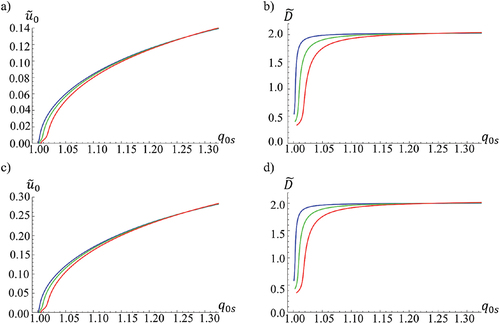
While close to the N – NTB phase transition, the behaviour is highly dependent on the . In the case where
, the period near the transition temperature increases sharply (), while it decreases in the case
()) and also changes in a larger temperature range. From , we see that the amplitude of undulation
is twice for the weak anchoring as compared to the strong anchoring, which is an expected result. The threshold value
also strongly depends on the compressibility modulus.
3.3. Numerically calculated optical properties
In this section, we calculate the optical properties of the diffracted light. First, we consider a preliminary model (), where we used the harmonic approximation for the angles and
varying periodically along
-axis. Let the direction of the optic axis be given as
The polarisation properties are calculated using the transfer matrix method. The detail of the method and used parameters are reported in Ref. [Citation34]. The calculated polarisation values are in line with the experimental values measured far from the phase transition [Citation6,Citation29] (). To understand the deformation of the two-dimensional pseudo-layer structure with temperature, we also compare the measured () and calculated temperature dependence of polarisation properties of the second-order diffraction peaks for the LCP incident light. We start by assuming that the magnitude of the angles and
are equal in the whole temperature range of the NTB phase (). This means that the amplitude of horizontal and vertical undulation remains the same in the NTB phase. In such a case the calculated ellipticity is very low as compared to the experimentally measured when temperature increases towards the NTB – N phase transition (Table 2). However, if we decrease the
(, red-filled circles), the calculated ellipticity significantly increases (Table 2) and the calculated polarisation values show a similar trend to the experimentally measured values (). This clearly shows that the vertical undulation starts to stretch when temperature increases, while there is no change in the horizontal undulation ().
Figure 11. The values of (black circles) and
(red circles) used in numerical calculations of the temperature dependence of the polarisation state of the (± 2q0) diffracted beams (LCP incident beam) for a) CB7CB (
), b) CB6OCB (
) thick cells.
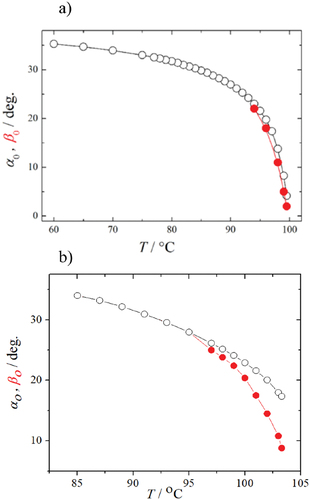
Figure 12. Experimentally measured and theoretically calculated relationships between the intensities of the central peak and the first
and second
diffraction peaks. (a) and (b) CB7CB, (c) and (d) CB6OCB. Black squares: experimental measurements. Very strong anchoring (orange circles: beam propagation method), (blue diamonds: transfer matrix method). Very weak anchoring (red circles: beam propagation method), (green diamonds: transfer matrix method). Adopted from [Citation34] with permission from the American Physical Society.
![Figure 12. Experimentally measured and theoretically calculated relationships between the intensities of the central peak I0 and the first I1and second I2 diffraction peaks. (a) and (b) CB7CB, (c) and (d) CB6OCB. Black squares: experimental measurements. Very strong anchoring (orange circles: beam propagation method), (blue diamonds: transfer matrix method). Very weak anchoring (red circles: beam propagation method), (green diamonds: transfer matrix method). Adopted from [Citation34] with permission from the American Physical Society.](/cms/asset/9b0ad79a-769f-49c7-b42f-d0cd357ae2f1/tlcy_a_2168968_f0012_c.jpg)
Then, for the direction of the optical axis that represents the direction of the local heliconical axis, which is in the direction normal to the smectic layer (EquationEquation (23)(23)
(23) ), we use model calculations of the structure (EquationEquation (4)
(4)
(4) ), where the partial derivatives of the offset of the pseudo-layers from the bookshelf/per-tilt pseudo-layers can be connected with the angles
and
. Where both angles
and
are a function of
and
. The polarisation properties of the diffracted light are numerically calculated using two methods, the transfer matrix method and the beam propagation method. The details of both methods are reported in Ref. [Citation34]. The transfer matrix method is simpler but it does not take into account that the cell is thicker than the wavelength of the light and diffraction inside the cell is not considered. In the beam propagation method [Citation42], the propagation of light in the studied samples is taken into account by directly solving the wave equation and thus the diffraction inside the sample cells is also considered. We used the forward finite difference scheme to obtain the polarisation properties of the diffracted light [Citation42]. The parameters used for the calculated values are mentioned in detail in Ref. [Citation34]. In the case of polarisation of the diffraction peaks of the central beam and first-order diffraction beams, the predictions of both methods agree with experimental measurements for both linearly and circularly polarised incident light (). For second-order diffraction peaks, the predictions of both methods are adequate in the case when the incident light is linearly polarised [Citation34]. If the incident light is circularly polarised, however, the transfer matrix method and beam propagation method are no longer equivalent. Before discussing the numerically calculated values of polarisation properties from both methods, which are shown in Table 2, we first point out that a qualitative agreement with experimental measurements is obtained only in the case if we use the results of modelling the structure with a pre-tilt of pseudo-layers (
). Only in this case we get an asymmetry between the second-order diffraction peaks. Because the angle
becomes asymmetric while the angle
remains symmetric. The phase lag between the ordinary and extraordinary waves results in the asymmetry in the polarisation properties of the diffracted light. In addition, in the case of the pre-tilt of pseudo-layers, we also get a different temperature variation of the amplitudes of the angles
and
, which we had to assume in the preliminary model () without any physical reason.
Table 2 shows the calculated polarisations for all the samples on which we performed measurements (CB7CB and CB6OCB in 1.6 and 1.5 µm thicknesses of cells, respectively) in the case of very strong and very weak anchoring and used the transfer matrix method and the beam propagation method. In comparison with the experimental measurements in , we see that a better agreement with the measurements is obtained in the case of very strong anchoring on the surface. If the anchoring is weak, the model predicts a higher value of ellipticity at temperatures far from the phase transition temperature. Both in the case of very strong and very weak anchoring, the theoretically predicted azimuth angle is found systematically small. We also see that the numerically calculated ellipticity lacks the uniform part deep in the NTB phase and far from the phase transition temperature. Because of the harmonic approximation (EquationEquations (21)(21)
(21) and (Equation22
(22)
(22) )) that works well close to the NTB – N phase transition temperature. However, in the case of very strong anchoring, the overall trend of the temperature dependence of the second-order diffraction peaks is in good agreement with the experimentally measured one (). The experimental conditions are therefore better described by the approximation of very strong surface anchoring. If we compare the predictions of the transfer matrix method and the beam propagation method, we notice that the results are comparable, but they predict the exact opposite asymmetry (position) of the left and right second-order diffraction peaks (Table 2). The asymmetry as predicted by the beam propagation method agrees with the experimental measurements. Therefore, we conclude that in the case of asymmetry, it is crucial to take into account the diffraction of light inside the cell, if we want to correctly predict the polarisation of the second-order diffraction peaks. By comparing experimentally measured and theoretically calculated polarisation values, we find that the modelled structure gives good predictions in the case of very strong anchoring with a pre-tilt of pseudo-layers and by using the beam propagation method.
We also calculated the intensity ratios of the central and first-
and second-order
diffraction peaks (). The match is very good, especially for the ratio
. For the ratio
, the fit is better in the case of very strong anchoring. Since both the polarisation of the diffracted light and the intensity ratios of the diffraction peaks are theoretically better predicted in the case of very strong anchoring. We conclude that the structure of the twist-bend nematic phase of CB7CB and CB6OCB in thin cells is best described by a model with a pre-tilt of pseudo-layers and strong anchoring on the surface.
4. Conclusion
We studied, both experimentally and theoretically, the optical transmission properties of the diffracted light from the spontaneously formed diffraction gratings in the NTB phase. Such gratings are formed due to the two-dimensional undulations of pseudo-layers when a liquid crystalline material exhibiting the NTB phase is confined in thin planar cells. We observed a generalised behaviour of diffraction peaks of such gratings for two different bent dimeric liquid crystalline materials. We also showed that the polarisation state of the second-order diffraction peaks for the LCP incident light has the greatest effect on the structure of the NTB phase when confined in thin planar cells.
To account for the experimental observations, a preliminary model is proposed. This takes an assumption that the amplitude of vertical undulation is smaller than the amplitude of horizontal undulation as the temperature increases towards the NTB – N phase transition and consequently the vertical undulation starts to stretch, while the horizontal undulation remains the same. Also, we modelled the structure of the NTB phase in a thin planar cell by minimising the free energy, which is composed of elastic contributions due to the spatial variation of the heliconical axis and the compressibility of pseudo-layers. We considered the case of very strong and very weak anchoring on the surface with the bookshelf and pre-tilt geometry of the pseudo-layers. From such presented continuum model a good qualitative agreement with measurements and in some cases also quantitative agreement is achieved. We calculated the properties of the diffracted light and used the transfer matrix method, which is simple but does not take into account the diffraction of light in the cell and the beam propagation method (by solving Maxwell’s equations), with which we also took into account the diffraction in the cell, but we still neglected the diffraction in the backward direction. We found that both methods predict the properties of the transmitted light, which agree with the experimental measurements if we use the structure in the cell in the case of very strong anchoring on the surface and with the pre-tilt of pseudo-layer since the latter brings an asymmetry between the diffraction peaks of the second-order. Since the beam propagation method is more computationally expensive than the transfer matrix method, should be used only when we want to describe the asymmetry of the second-order diffraction peaks in more detail. Finally, we want to point out that the NTB phase in thin cells spontaneously arranges itself into a periodic structure without the need for costly surface treatments, which is why this material is an excellent candidate for low-cost modulators and as optical elements in integrated optic structures.
Acknowledgements
I am very grateful to my PhD supervisors Prof. Dr Nataša Vaupotič and Dr hab. Damian Pociecha and to Prof. Ewa Górecka for the consistent guidance throughout the PhD. This work was funded by National Science Center (Poland) under Grant No. 2016/22/A/ST5/00319 and the Slovenian Research Agency (ARRS), through the research core funding no. P1-0055.
Disclosure statement
No potential conflict of interest was reported by the author(s).
Additional information
Funding
References
- Goodby JWG, Collings PJ, Kato T, et al. Handbook of liquid crystals. Vol. 1. Weinheim: Wiley; 1998.
- Stegemeyer H. Liquid crystals. New York (NY): Springer; 1994.
- Vertogen G, de Jeu WH. Thermotropic liquid crystals, fundamentals. Berlin: Springer; 1988.
- Meyer RB, Liebert LS, Strzelecki L, et al. Ferroelectric liquid crystals. J Phys Lett. 1975;36(3):69–71.
- Rieker TP, Clark NA, Smith GS, et al. “Chevron” Local layer structure in surface-stabilized ferroelectric smectic-c cells. Phys Rev Lett. 1987;59(23):2658–2661.
- Vaupotič N, Ali M, Majewski PW, et al. Polarization gratings spontaneously formed from a helical twist-bend nematic phase. Chem Phys Chem. 2018;19(19):2566.
- Amaranatha RR, Zhu C, Shao R, et al. Spontaneous ferroelectric order in a bent-core smectic liquid crystal of fluid orthorhombic layers. Science. 2011;332(6025):72–77.
- Guo L, Gorecka E, Pociecha D, et al. Ferroelectric behavior of orthogonal smectic phase made of bent-core molecules. Phys Rev E. 2011;84(3):031706.
- Shimbo Y, Takanishi Y, Ishikawa K, et al. Ideal liquid crystal display mode using achiral banana-shaped liquid crystals. Jpn J Appl Phys. 2006;45(3L):L282.
- Pelzl G, Eremin A, Diele S, et al. Spontaneous chiral ordering in the nematic phase of an achiral banana-shaped compound. J Mater Chem. 2002;12(9):2591.
- Niori T, Yamamoto Y, Yokoyama H. Dynamics of the nematic phase formed by achiral banana-shaped materials. Mol Cryst Liq Cryst. 2004;409(1):475–482.
- Weissflog W, Sokolowski S, Dehne H, et al. Chiral ordering in the nematic and an optically isotropic mesophase of bent-core mesogens with a halogen substituent at the central core. Liq Cryst. 2004;31(7):923–933.
- Panov VP, Nagaraj M, Vij JK, et al. Spontaneous Periodic Deformations in Nonchiral Planar-Aligned Bimesogens with a Nematic-Nematic Transition and a Negative Elastic Constant. Phys Rev Lett. 2010;105(16):167801.
- Cestari M, Diez-Berart S, Dunmur DA, et al. Phase behavior and properties of the liquid-crystal dimer 1′′,7′′-bis(4-cyanobiphenyl-4′-yl) heptane: a twist-bend nematic liquid crystal. Phys Rev E. 2011;84(3):031704.
- Meyer RB. Les houches summer school in theoretical physics. Balian R Weil G, editors. New York (NY): Gordon and Breach; 1976. p. 273–373.
- Dozov I. On the spontaneous symmetry breaking in the mesophases of achiral banana-shaped molecules. Europhys Lett. 2001;56(2):247–253.
- Memmer R. Liquid crystal phases of achiral banana-shaped molecules: a computer simulation study. Liq Cryst. 2022;29(4):483.
- Panov VP, Balachandran R, Nagaraj M, et al. Microsecond linear optical response in the unusual nematic phase of achiral bimesogens. Appl Phys Lett. 2011;99(26):261903.
- Panov VP, Balachandran R, Vij JK, et al. Field-induced periodic chiral pattern in the Nx phase of achiral bimesogens. Appl Phys Lett. 2012;101(23):234106.
- Chen D, Porada JH, Hooper JB, et al. Chiral heliconical ground state of nanoscale pitch in a nematic liquid crystal of achiral molecular dimers. Proc Natl Acad Sci, USA. 2013;110(40):15931–15936.
- Borshch V, Kim Y-K, Xiang J, et al. Nematic twist-bend phase with nanoscale modulation of molecular orientation. Nat Commun. 2013;4(1):2635.
- Meyer C, Luckhurst GR, Dozov I. Flexoelectrically driven electroclinic effect in the twist-bend nematic phase of achiral molecules with bent shapes. Phys Rev Lett. 2013;111(6):067801.
- Salamończyk M, Vaupotič N, Pociecha D, et al. Structure of nanoscale-pitch helical phases: blue phase and twist-bend nematic phase resolved by resonant soft X-ray scattering. Soft Matter. 2017;13(38):6694.
- Salamończyk M, Mandle RJ, Makal A, et al. Double helical structure of the twist-bend nematic phase investigated by resonant X-ray scattering at the carbon and sulfur K-edges. Soft Matter. 2018;14(48):9760.
- Panov VP, Vij JK, Balachandran R, et al. Properties of the self-deforming Ntb phase in mesogenic dimers. Proc SPIE. 2013;8828:88280X.
- Challa PK, Borshch V, Parri O, et al. Twist-bend nematic liquid crystals in high magnetic fields. Phys Rev E. 2014;89(6):060501(R).
- Panov VP, Varney MCM, Smalyukh II, et al. Hierarchy of periodic patterns in the twist-bend nematic phase of mesogenic dimers. Mol Cryst Liq Cryst. 2015;611(1):180.
- Panov VP, Vij JK, Mehl GH, et al. Twist-bend nematic phase in cyanobiphenyls and difluoroterphenyls bimesogens. Liq Cryst. 2017;44:147.
- Ali M, Vaupotič N, Majewski PW, et al. Spontaneous formation of polarization diffraction gratings in surface-stabilized cells filled with liquid crystal in the modulated nematic phase. Proc SPIE. 2019;10941:109410T.
- Paterson DA, Gao M, Kim YK, et al. Understanding the twist-bend nematic phase: the characterisation of 1-(4-cyanobiphenyl-4′-yloxy)-6-(4-cyanobiphenyl-4′-yl)hexane (CB6OCB) and comparison with CB7CB. Soft Matter. 2016;12(32):6827.
- Meyer C, Luckhurst GR, Dozov I. The temperature dependence of the heliconical tilt angle in the twist-bend nematic phase of the odd dimer CB7CB. J Mater Chem C. 2015;3(2):318–328.
- Ishikawa T, Lavrentovich OD. Undulations in a confined lamellar system with surface anchoring. Phys Rev E. 2001;63(3):030501(R).
- Senyuk BI, Smalyukh II, Lavrentovich OD. Undulations of lamellar liquid crystals in cells with finite surface anchoring near and well above the threshold. Phys Rev E. 2006;74(1):011712.
- Ali M, Gorecka E, Pociecha D, et al. Structure and grating efficiency of thin cells filled by a twist-bend nematic liquid crystal. Phys Rev E. 2020;102(3):032704.
- Gorecka E, Vaupotič N, Zep A, et al. A Twist-Bend Nematic (NTB) phase of chiral materials. Angew Chem Int Educ. 2015;54(35):10155–10159.
- Babakhanova G, Parsouzi Z, Paladugu S, et al. Elastic and viscous properties of the nematic dimer CB7CB. Phys Rev E. 2017;96(6):062704.
- Pociecha D, Crawford CA, Paterson DA, et al. Critical behavior of the optical birefringence at the nematic to twist-bend nematic phase transition. Phys Rev E. 2018;98(5):052706.
- Shi J, Sidky H, Whitmer JK. Novel elastic response in twist-bend nematic models. Soft Matter. 2019;15(41):8219.
- Salili SM, Kim C, Sprunt S, et al. Flow properties of a twist-bend nematic liquid crystal. RSC Adv. 2014;4(101):57419.
- Parsouzi Z, Pardaev SA, Welch C, et al. Light scattering study of the “pseudo-layer” compression elastic constant in a twist-bend nematic liquid crystal. Phys Chem Chem Phys. 2016;18(46):31645.
- Zhou J, Tang W, Arakawa Y, et al. Viscoelastic properties of a thioether-based heliconical twist–bend nematogen. Phys Chem Chem Phys. 2020;22(17):9593.
- Pedrola GL. Beam propagation method for design of optical waveguide devices. Chichester: Wiley; 2016.