

Abstract
This work presents an evaluation of bus structure during a frontal collision. A finite element (FE) model of a bus frontal structure has been simulated under ANSYS/explicit dynamics. Simulation investigated both front-end deformation and generated deceleration was attained byusing two different impact velocities. Lagrangian function has been used to validate the obtained energy absorption. A lumped mass model in MATLAB/Simulink has been constructed to estimate the design parameters for the proposed zones. Multi-objective function optimization strategy used Genetic Algorithm based on both acceptable deformation and deceleration limits. The experimental tests have been carried out to investigate design parameters on four different samples. Simulation results concluded that both deceleration and deformation deviated from the acceptable limits of occupant safety exceeding the first zone. According to the optimization results, the investigated bus structure produces insufficient behaviour during the first crash zone. It is recommended to increase the front zone length.
Disclosure statement
No potential conflict of interest was reported by the author(s).
Figure 21. Energy absorption and specific energy absorbed of four square steel tubes.
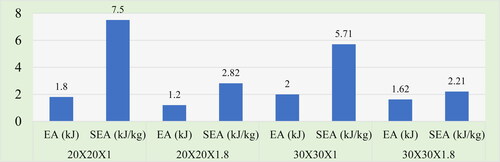
Figure 22. Lumped mass model of bus cabin in three zones.
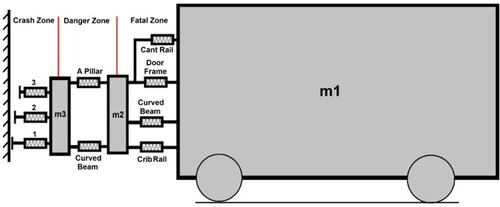
Figure 23. Deformation comparison between lumped mass model and FE model.
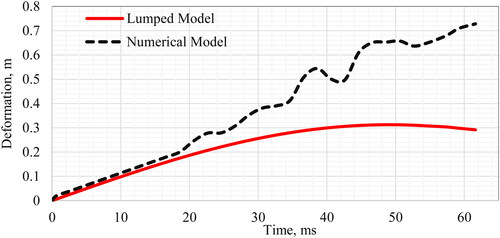
Figure 24. Deceleration comparison between lumped mass model and FE model.
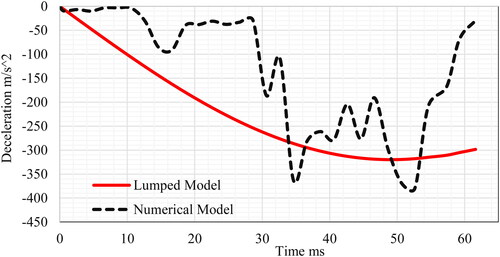
Figure 25. Deceleration history of lumped mass model of two thickness 1.8 and 1 mm.
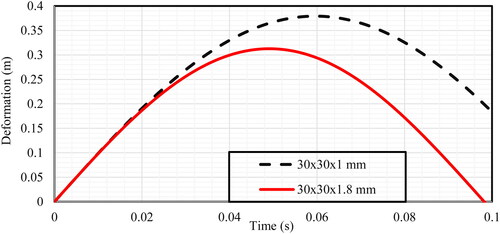
Figure 26. Deformation history of lumped mass model of two thickness 1.8 and 1 mm.
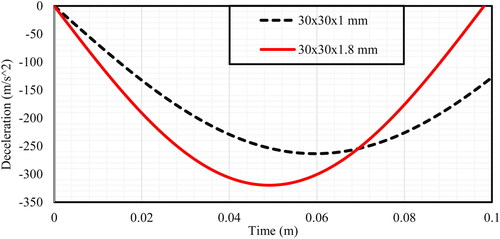
Table 1. Cross sections dimensions of bus structure rails and pillars in millimeters.