
 ?Mathematical formulae have been encoded as MathML and are displayed in this HTML version using MathJax in order to improve their display. Uncheck the box to turn MathJax off. This feature requires Javascript. Click on a formula to zoom.
Abstract
Headgear including helmets are essential and law-enforced in many countries. However, one of the most main reasons drivers give for not wearing helmets is the discomfort and excessive heat that helmets create. More comfortable helmets can potentially increase helmet use among population, thus play a major role in people safety. In this study, a thermoregulation model of the human helmeted head was created using Finite Element Analysis (FEM) and based on an anatomically correct medical image-based CT-scan model. The model investigated three cases with different wind speeds namely; 1km/h, 20km/h, and 50km/h. In addition, the combined FEM Head-helmet model results is verified by an experimental trail. The compared results shown the ability of the model to predict the head temperature profile and results were in good agreement with experiment. The established model is to predict the thermal distribution of the head parts under helmet conditions. Results reflect the thermoregulatory responses of the rider parts, thus providing grounds for suggestions and recommendations for the helmet design and processing.
1. Introduction
Recently, the world has been struck by a major heat wave in a precedential scale never been witnessed before. One can imagine how hard it is to wear a helmet in such conditions. It is well known that Thermal comfort is an important factor affecting the acceptance of protective headgears [Citation1]. In particular, Motorcycle helmets which are designed to cover most of the head than other protective helmets, therefore greatly reduces the thermal interaction of the rider with the environment. Even though, it is well established that helmets increase the survival rate of the rider surviving rate of a motorcycle traffic accident [Citation2–5], a great portion of riders does not wear helmets [Citation6,Citation7]. The main reason according to these studies and field observations, is thermal discomfort [Citation8–11].
Previous studies on full-face motorcycle helmets effects on the rider focused on noise levels [Citation12,Citation13], vision [Citation14], physiological strain [Citation15], microclimate CO2 and O2 levels [Citation13,Citation16] and helmet thermal properties [Citation17–20]. Different methods have been used and developed to allow investigating the helmet-head thermal interaction [Citation21]. These methods include: numerical and analytical, bio-physical, joint numerical and biophysical, and user trials. Numerical techniques are widely used to analyse different characteristics of the helmet. For example; helmets aerodynamic performance was analysed in [Citation22–24]. In addition, ventilation and thermal performance were investigated in [Citation18,Citation25]. Several models have been presented to predict the thermal physiological responses of the human head with different levels of complexity and accuracy [Citation26–29]. Moreover, other models have been applied successfully for predicting thermoregulatory responses in animal applications [Citation30,Citation31] as well as in human applications [Citation32]. However, most of these studies presented a simplified head geometry consisting of cylinders, ellipses or layers. Moreover, verifications were mostly based on mechanical models or manikins. In the presented study an anatomical head model was obtained based on the post-processing of a CT-scan images of a volunteer’s subject. The thermal analysis of the head-helmet interaction under different wind speed is conducted utilising a commercial FEM software (COMSOL Multiphysics 6.0). The model results were then validated through an experimental trail.
2. Materials and methods
2.1. Model construction
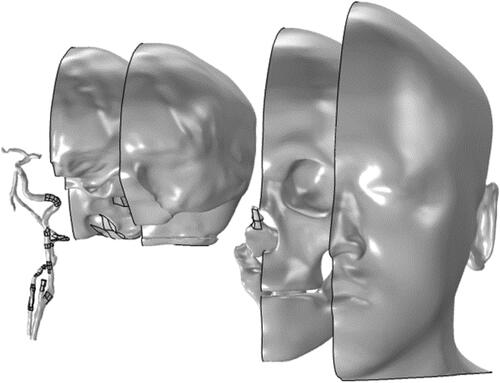
The model is based on a modified geometry of a real human head. With the consent of the hospital ethical committee; a volunteer model (28 years old, healthy adult male, with a body mass index (BMI) of 26.3 kg/m2, was asked to take the supine position, and the CT scanning started ranging from the cranial crest to the fifth lower edge of the cervical spine. The collected CT data was then imported into Mimics (Mimics 17.0, Medical Image Processing Software, Belgium Materiale), and the head tissues were separated by threshold segmentation, and a three-dimensional (3D) model was established to obtain a 3D STL model of the head. Then using Geomagic Studio (2015, Geomagic, USA), a 3D solid geometric model of the head was built based on the STL model before it was imported to COMSOL Multiphysics. In order to reduce the computational cost of the modelling process, the head geometry is adjusted and small organs and tissues were removed. In addition, the head model is presumed to be symmetrical, thus half of the head is processed to reduce complexity. The simplified geometry is anatomically correct and consists of the following organs/tissues: Carotid arteries, Brain, Cerebrospinal fluid, skull, skin and soft tissues (fat and muscles). The model considered same size, real shape with detailed anatomy as shown in Furthermore, a database of biological tissue characteristics was used for the modelling process. All used tissue characteristics were selected from the biological tissue characteristics database provided by [Citation33].
Figure 1. Head model geometry containing (from left to right): carotid arteries, brain, cerebrospinal fluid (CSF), skull, skin and soft tissues.
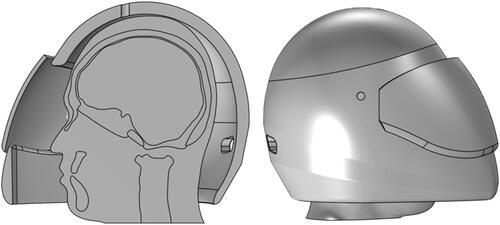
The selected helmet was based on a commercial model chosen arbitrary to be investigated in this study. The 3D model of the full-face motorcycle helmet design contains two ventilations opening located in front and in the back of the helmet body. The helmet is presumed to be made of polyurethane foam. The helmet window is made from fibreglass. The helmet geometry and the head-helmet model are shown in .
Figure 2. Helmet and head model.
2.2. Numerical analysis
Head thermoregulation is controlled by hypothalamus, and is maintained at approximately 36.5 °C. This indicate a heat-transfer mechanisms between the head and the surrounding environment such that heat is retained when in deficit and dissipated when in surplus. This dynamic relation which the head, or the body in total, deploy to keep its thermal balance could be described by the heat-balance equation as follows [Citation34]:
(1)
(1)
where S is the rate of heat storage, M is the metabolic rate, W is the work rate, and the difference between M and W is the rate of heat production. E, C, K, and
are heat transfer through evaporation, convection, conduction, and radiation, respectively. Which occur through respiration (res) as well as at the skin (sk).
The above quantities depend on the environmental conditions and on thermal properties of materials covering the head (e.g. clothing and headgear) as well as the hair which provide substantial thermal insulation. A positive S leads to an increase in body temperature, and vice-versa.
In the presented FEM study, the heat distribution of the head utilises Penne’s bioheat equation with blood perfusion to describe the thermos-physiological transport phenomenon [Citation35]. For each organ or tissue, this could be described as:
(2)
(2)
Where is the amount of bioheat generated by each organ or tissue,
is the tissue density,
is the specific heat,
is the blood perfusion rate, and
is the blood temperature. The metabolic heat generation rate
for each part depends on temperature, and is calculated as:
(3)
(3)
where Q0 is the metabolic heat generation under normal conditions and T0 is the initial temperature.
2.3. Boundary conditions
The heat transfer from the skin to the environment occurs from convection, radiation and evaporation. This was defined by:
(4)
(4)
where qn is the heat flux normal to the boundary, T is the temperature, Text is the ambient temperature, ℎ is the heat transfer coefficient.
is the skin surface emissivity (0.98), and
is the Stefan-Boltzmann constant. Esweat is the heat flux caused by sweat evaporation.
The heat coefficient depends on the surface geometry, and was calculated by:
(5)
(5)
The heat flux caused by sweat was calculated by:
(6)
(6)
Where is the sweat rate, and was presumed as 0.5 g/s [Citation36].
is the latent heat of water evaporation (2264 J/g), and
is the head skin surface area.
2.4. Material properties & initial conditions
In this study, each organ was given specific thermal properties that were derived from literature [Citation33]. displays each thermal property given to each part. These thermal properties are density (ρ), thermal conductivity (λ), specific heat (Cp), Perfusion rate (ω), and metabolic rate (Q). Each of these thermal properties help describe temperature variations within the head.
Table 1. Thermal properties of head model parts.
For dynamic simulations, the initial conditions of the model at rest in a static thermal neutral condition are Text = 28 °C, Air speed (vair) = 0.1 m/s, and relative humidity (RH) = 0.4. The initial temperature of the blood is considered to be 36.5 °C. However, the heat is mainly transferred from conduction and through the blood mostly by convection. Therefore, it is important that the blood temperature changes with respect to the heat gained from the organs or lost to the organs. The blood temperature in the head model varies according to the following equation:
(7)
(7)
Where Vb is the volume of the blood, Tb is the blood temperature, ρb is the density of blood, and Cpb is the specific heat of blood.
2.5. Mesh analysis
Automatic meshing generator within COMSOL Multiphysics was used to generate the default finite element mesh according to physics type. The mesh was refined until the minimum temperature differed by less than ±0.1 °C at a specified location when compared with a coarser mesh. The final meshing of the head model and helmet model was done using tetrahedral elements, with mesh element counts reaching 794,501 and 250,194 respectively, meeting the requirements. In addition, the model adopts a physical field control grid, and the selection of unit sizes is relatively refined. There are 794501 tetrahedral elements and 97380 triangular elements, with a minimum unit mass of 0.04372 and an average unit mass of 0.6634.
2.6. Experimental setup
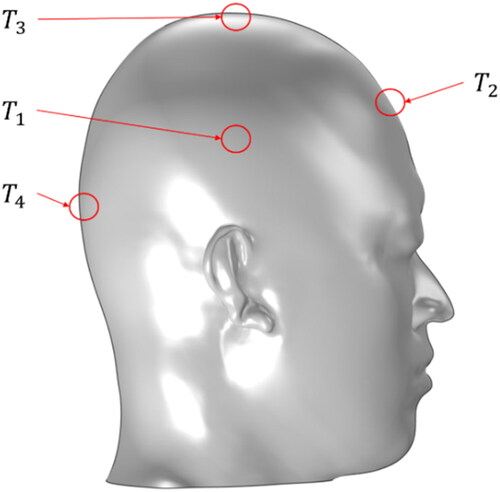
With the consent of the hospital ethical committee, three male volunteers between the age of 25-35 years and with average weight of 70 ± 10 kg, were subjected to a step test during which thermal measurements were made. The test environment included an air conditioner to control the room initial temperature. A fan to simulate the air flow, and a bicycle exercise machine. The test environment was heated up to 34 ± 2 °C. Each subject wore his assigned motorbike’s helmet and suit. A multi-channel high precision thermocouple thermometer (Xi’ma AS877/887, China) was attached to each helmet. The test setup scheme is shown in , while shown four points were chosen to be measured by the thermometer.
Figure 3. Schematic showing the Experimental setup used to measure the head temperature.
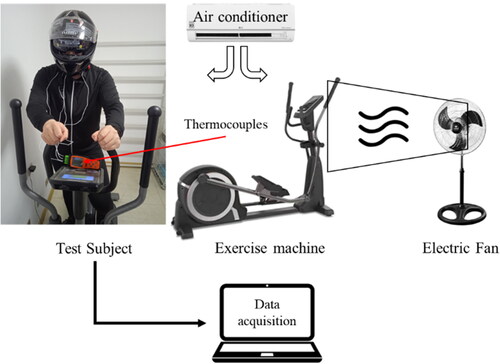
Figure 4. Location of the selected 4 points on the helmeted head to be tested by the thermometer.
In this study, three cases of three different air velocities are conducted and compared. The electric fan was adjusted to simulate the wind speed for the intended 3 cases. The fan settings were set to 50,500,1500 rpm which could approximately deliver a wind speed of 0.5,6 and 14 m/s respectively. Each test subject was asked to exercise for 20 min for each case, and the temperature of each designated point were recorded every minute. All tests were performed in triplicate (n = 3) at different days. All Data were tabulated and statistically analysed using SPSS 11.0 (SPSS Inc., Chicago, IL, USA) software, and were presented as mean ± SD at p < 0.05. Analysis of variance was used to evaluate mean values differences.
3. Results
Simulations of human head thermoregulations are performed for a male motorbike rider, wearing a ventilated full-face motorcycle helmet. The 3D simulation includes three cases at which the air velocity varies to mimic the variation of wind speed.
3.1. Case no.1
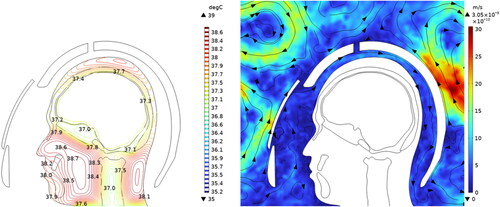
At the first case, the air flow speed was set to 0.5 m/s. It could be seen in that the flow speed is nearly negligible and air is barley swirling around the helmet. also shown the temperature distribution of the helmeted head. The maximum heat calculated was 38.7 °C at the oral cavity. It could be noticed the temperature difference between the inner and outer parts. The brain temperature never exceed 37 °C, while the skin average temperature reaches 38 °C.
Figure 5. Case one temperature and air flow field distribution.
3.2. Case no.2
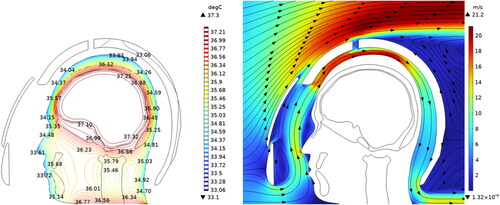
In case two where the wind speed is set to 20 km/h, it could be noticed the air flow distribution in . The maximum speed reaches to 21 m/s right above the helmet, while the air flows at 18 m/s inside the helmet. It could be noticed that the major flow lines take place below the helmet frontal part, and circulate around the head. This high flow velocity significantly impacted the temperature distribution of the head. As shown in the Figure, the temperature of the skin is now below 36 °C. The oral cavity temperature was also significantly decreased compared to case one. The brain maximum temperature was 37.3 °C, similar to that in case one.
Figure 6. Case two temperature and air flow field distribution.
3.3. Case no.3
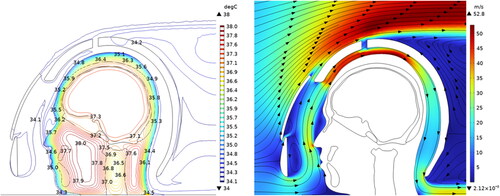
In case three where the wind speed is set to 50 km/h, it could be noticed the temperature and air flow distribution in . The maximum air speed calculated was 52.8 m/s and was right above the helmet. The air speed inside the helmet was approximately 42 m/s. The air flow patter seems similar to that in case two. The extreme high speed of wind seems to have a low effect on the temperature distribution. The maximum head temperature was 38 °C, compared to 37.3 °C in the previous case. However, it could be noticed that the skin temperature at case three is lower than that of case two at each isothermal line.
Figure 7. Case three temperature and air flow field distribution.
3.4. Case no.4
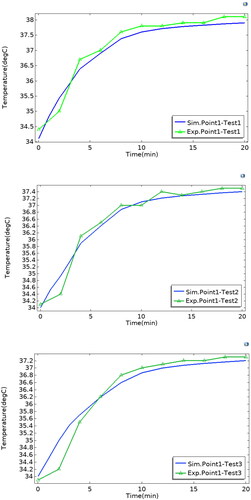
In this case, there is no need to wear a helmet, and the speeds are taken as 2 km/h, 20 km/h, and 50 km/h. Since the temperature changes at measurement points 1, 2, 3, and 4 are roughly the same without a helmet, only the temperature change curves of measurement point 1 at three different speeds were selected and will be discussed in the next section.
3.5. Experimental validation
Convective heat-transfer testing was done to evaluate the heat-transfer characteristics of motorbike helmet for convective heat-transfer mode. The 3 cases described before were mimicked by altering the electric fan rotation speed. The temperatures of the selected four points (shown in ) were recorded using the multi-channel thermometer. Each point was compared with simulation, and results are shown in for cases 1, 2,3 and 4 respectively.
Figure 8. Case no.1 simulation (sim.) and experiment (exp.) results for points 1,2,3 and 4.
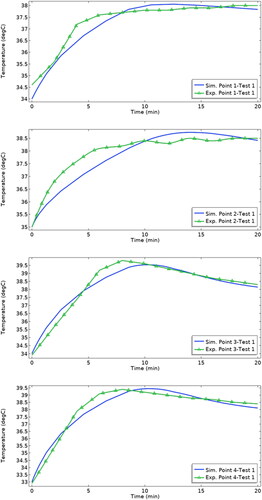
Figure 9. Case no.2 simulation (sim.) and experiment (exp.) results for points 1,2,3 and 4.
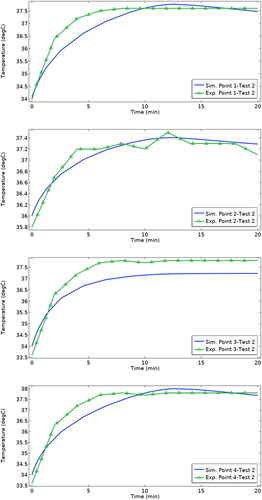
Figure 10. Case no.3 simulation (sim.) and experiment (exp.) results for points 1,2,3 and 4.
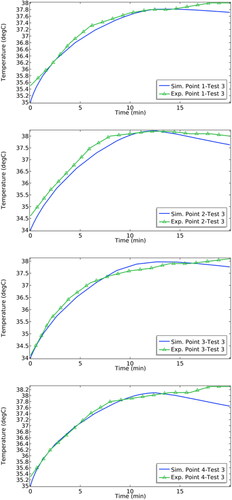
Figure 11. Case no.4 simulation (sim.) and experiment (exp.) results of test1, test2 and test3 for point 1.
In case one, shown in , all results were in good agreement with the experiment. It could be seen that at the start of the exercise, the temperature increases sharply within the first 5 min. However, as the head thermal control kicks in, the thermal balance is retained, and temperatures start to drop until significant variations disappears at the end of the test. Results shown that points 3 and 4 reached 39 °C within an average time of 7 min of the exercise. While points 1 and 2 took an average of 11 min to reach its maximum. These results were also compatible with those shown in .
Similar trends could be observed in case two, shown in . The temperature increases at the start of the exercise test, and then stabilises. However, in this case, as the air flow play a major role in heat transfer, the temperature balance is achieved faster than that in case no.1. It could be noticed that the maximum temperature reached by the four points was at point 4, and the thermal balance reached within an average time of 11 min. Compared to case no.1, it could be noticed that the temperature of the four points were lower, and the head thermal system stabilises the temperature before 15 min of the exercise time.
In case no.3, as the air flow increased significantly, the temperature profile of the four designated points is compared in . As the figures shown, the temperature increased slower than that in case no.1 and 2, with an average of 12 min to reach its maximum. The temperatures were then stabilised faster within an average of approximately 6 min for all points. In contrary to the previous cases, the experimental results at points 1, 3 and 4 did not show a downtrend as the simulation results did. However, no temperature difference was recorded after 20 min of exercise extension.
which compares case no.4 calculations to recorded temperature also shown similar trends to that observed in . Moreover, by comparing these figures it can be observed that the maximum temperature in is higher than that in . This is because rapid motion leads to instability in the air layer on the object’s surface, consequently slowing down the heat dissipation process. When the air layer on the object’s surface is unstable, the hotter air is not effectively replaced by fresh air, resulting in an increased residence time of heat on the object’s surface, thereby reducing the rate of heat dissipation. Additionally, high-speed motion can also cause heat accumulation on the object’s surface, further affecting the efficiency of heat dissipation.
4. Discussion
A helmet is the only way to protect a motorcyclist’s head against mechanical injuries in road collisions [Citation37]. However, one of the most common reasons people give for not wearing helmets is the discomfort and excessive heat that helmets create. More comfortable helmets can potentially increase helmet use among population, thus play a major role in people safety. That is why developing appropriate research methods and increasing the number of experiments examining the effect of helmets and protective equipment is necessary to improve motorcyclists’ safety on the road [Citation14].
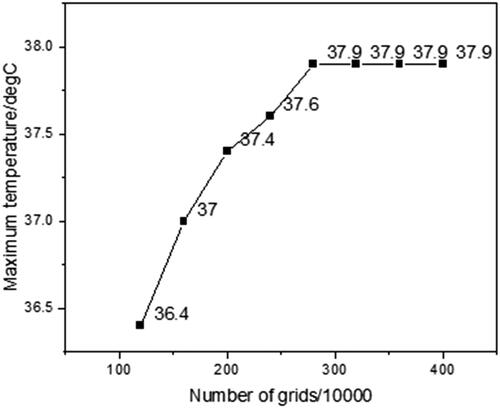
In this work, the temperature variation of a helmeted head during a motorbike riding was investigated. The 3D numerical model from CT images of head were analysed by FEM and compared to experiment. The middle layer thickness in CT is 0.625 mm, the resolution is 512 × 512 pixels, the tube current is 120 mA, and the peak tube voltage (KVP) is 120 kV.We performed tests with volunteers in model conditions to verified by an experimental trail. The compared results shown the ability of the model to predict the head temperature profile and results were in good agreement with experiment. Additionally, shows the study of grid independence. When the number of grid nodes reaches 120000, regardless of the increase in the number of grid nodes, the highest temperature at point 1 is very close to 37.9 degrees Celsius. From this, it can be seen that when the number of grid nodes exceeds 120000, the numerical solution of the model will be independent of the number of grids.
Figure 12. Highest temperature at measurement point 1 as a function of the number of grids.
The validated model provided a quickly and safely approach to determine the effect of wind cooling on the helmeted head. Moreover, the model also illustrated the visible and dynamic tissue temperatures over time. The results showed that for the head model, different ridings speeds could affect the head thermal profile and temperature distribution. The constructed model considered the three major methods used by the human body to achieve thermal balance. The model included the effects of convection, radiation and sweating.
However, there are some limitations for the model to precisely estimate the temperature and thermal distribution of the head under helmet. For the head model, the hair was not considered in the simulation analysis. This deprived the model of a possible heat insulation boundary. Furthermore, hair which could be considered as a porous media could act as a conductive heat material, reducing wind flow between the head and helmet. Thus, by contrast with the in vivo head, the distance between the helmet and head would be shortened. probably inducing larger temperature variations in the head tissues.
Additionally, the presented model neglected the existence of fat layers under the skin. The assumption was made for simplicity to consider the head soft tissues to include fat and muscles. However, the thermal conductivity of fat is about 0.21 W/m.K, lower than that of the muscle. It can be deduced that the thicker the fat layer was, the worse the cooling effect could be. Another assumption is that the brain surface is simplified to be flat without gyri and sulci. Although this method is in accordance with previous studies [Citation38], more detailed brain surface shape would provide more insight on head thermoregulation. The existence of gyri and sulci, it can be inferred that the specific surface area between the cerebrospinal fluid and brain is enlarged as expected, resulting in the increase of heat transfer capacity in the brain tissue. These factors, among others, need to be further improved in the future to find the connections between the geometrical features of the model and heat transfer characteristics.
5. Conclusions
This work aims to predict the thermal field distribution of motorbike rider wearing helmet, by coupling CFD and human thermoregulation and comparing the results to a human trail. The simulation model was constructed based on an accurate anatomically head geometry. The established geometry was then analysed by FEM to investigate the bioheat of the head. The numerical analysis considered the helmeted head as control system, which aims to keep thermal balance. Three cases were investigated in which the air flow speed varies from 0.5-50km/h to mimic motorcycle activity. The simulation results were validated by an experiment. The experimental design included human volunteers in a controlled environment. Each human trail included the test subject performing a 20 min exercise, and temperature was recorded at four points selected in the head. The temperature profiles of the experiments were then compared with the simulation results, and results were shown to be in good agreement. The results shown the ability of the model to predict the human head temperature and validity of the test method deployed.
Acknowledgments
The Authors would like to acknowledge Xi’an Simu Technology Com. Ltd. for assistance with model construction and simulation.
Disclosure statement
The authors declare that they have no conflict of interest.
Additional information
Funding
References
- Hickling EM. Factors affecting the acceptability of head protection at work. J Occupat Accid. 1986;8(3):193–206. doi: 10.1016/0376-6349(86)90005-2.
- Deutermann W. Motorcycle helmet effectiveness revisited. Motorcycle Helmets. 2004. dio: http://lccn.loc.gov/2004438766.
- Keng SH. Helmet use and motorcycle fatalities in Taiwan. Accid Anal Prev. 2005;37(2):349–355. doi: 10.1016/j.aap.2004.09.006.
- Ouellet JV, Kasantikul V. Motorcycle helmet effect on a per-crash basis in Thailand and the United States. Traffic Inj Prev. 2006;7(1):49–54. doi: 10.1080/15389580500338652.
- Houston DJ, Richardson LE. Motorcyclist fatality rates and mandatory helmet-use laws. Accid Anal Prev. 2008;40(1):200–208. doi: 10.1016/j.aap.2007.05.005.
- Sosin DM, Sacks JJ. Motorcycle helmet-use laws and head injury prevention. JAMA. 1992;267(12):1649–1651. doi: 10.1001/jama.267.12.1649.
- Glassbrenner D, Ye TJ, Transportation USDO. et al. Motorcycle Helmet Use in 2007–overall Results. Traffic Safety Facts Research Note. 2007. dio: 10.1007/10201975_99.
- Patel R, Mohan D. An improved motorcycle helmet design for tropical climates. Appl Ergon. 1993;24(6):427–431. doi: 10.1016/0003-6870(93)90175-9.
- Skalkidou A, Petridou E, Papadopoulos FC, et al. Factors affecting motorcycle helmet use in the population of Greater Athens, Greece. Inj Prev. 1999;5(4):264–267. doi: 10.1136/ip.5.4.264.
- Li LP, Li GL, Cai QE, et al. Improper motorcycle helmet use in provincial areas of a developing country. Accid Anal Prev. 2008;40(6):1937–1942. doi: 10.1016/j.aap.2008.06.019.
- Gkritza K. Modeling motorcycle helmet use in Iowa: evidence from six roadside observational surveys. Accid Anal Prev. 2009;41(3):479–484. doi: 10.1016/j.aap.2009.01.009.
- Brühwiler PA, Stämpfli R, Huber R, et al. CO2 and O2 concentrations in integral motorcycle helmets. Appl Ergon. 2005;36(5):625–633. doi: 10.1016/j.apergo.2005.01.018.
- Młyński R, Kozłowski E, Zera J. Attenuation of noise by motorcycle safety helmets. Int J Occup Saf Ergon. 2009;15(3):287–293. doi: 10.1080/10803548.2009.11076810.
- Lai HH, Huang H. Evaluation of visibility of tinted helmet visors for motorcycle riders. Int J Ind Ergonom. 2008;38(11-12):953–958. doi: 10.1016/j.ergon.2008.02.013.
- D'Artibale E, Tessitore A, Capranica L. Heart rate and blood lactate concentration of male road-race motorcyclists. J Sports Sci. 2008;26(7):683–689. doi: 10.1080/02640410701790779.
- Br Hwiler PA. Heated, perspiring manikin headform for the measurement of headgear ventilation characteristics. Measur Sci Technol. 2003;14(2):217.
- Bogerd CP, Brühwiler PA. The role of head tilt, hair and wind speed on forced convective heat loss through full-face motorcycle helmets: a thermal manikin study. Int J Ind Ergonom. 2008;38(3-4):346–353. doi: 10.1016/j.ergon.2008.01.003.
- Pinnoji PK, Haider Z, Mahajan P. Design of ventilated helmets: computational fluid and impact dynamics studies. Int J Crashworthines. 2008;13(3):265–278. doi: 10.1080/13588260801933626.
- Bogerd CP. Physiological and cognitive effects of wearing a full-face motorcycle helmet. Nielsbogerd Com. 2009; dio: 10.3929/ETHZ-A-005831311
- Bogerd CP, Brühwiler PA. Heat loss variations of full-face motorcycle helmets. Appl Ergon. 2009;40(2):161–164. doi: 10.1016/j.apergo.2008.03.001.
- Bland ML, McNally C, Rowson S. Differences in impact performance of bicycle helmets during oblique impacts. J Biomech Eng. 2018, 140(9):091005. dio: 10.1115/1.4040019.
- Defraeye T, Blocken B, Koninckx E, et al. Computational fluid dynamics analysis of drag and convective heat transfer of individual body segments for different cyclist positions. J Biomech. 2011;44(9):1695–1701. doi: 10.1016/j.jbiomech.2011.03.035.
- Sims BW, Jenkins PE. Aerodynamic bicycle helmet design using a truncated airfoil with trailing edge modifications. Asme Int Mech Eng Congr Expos. 2011. dio: 10.1115/IMECE2011-65411.
- Jachowicz M. Properties of thin coatings deposited by physical vapour deposition on safety helmets. Int J Occup Saf Ergon. 2021;27(1):55–62. doi: 10.1080/10803548.2020.1715100.
- Desta TZ, Bruyne GD, Aerts JM, et al. Numerical simulation and ventilation efficiency of bicycle helmets. Comput Model Eng Sci. 2008;31(2):61–69.
- Fiala D, Lomas KJ, Stohrer M. A computer model of human thermoregulation for a wide range of environmental conditions: the passive system. J Appl Physiol (1985). 1999;87(5):1957–1972. doi: 10.1152/jappl.1999.87.5.1957.
- Fiala D, Lomas KJ, Stohrer M. Computer prediction of human thermoregulatory and temperature responses to a wide range of environmental conditions. Int J Biometeorol. 2001;45(3):143–159. doi: 10.1007/s004840100099.
- Dusan F. Physiological modeling for technical clinical and research applications. Front Biosci. 2010;S2(3):939–968.
- Dusan Fiala KJLM. First principles modeling of thermal sensation responses in steady-state and transient conditions. Ashrae Transactions. 2003;109(1):179–186.
- Aerts JM, Berckmans D. VirChick: a virtual chicken for climate control design. Simulation of static and dynamic heat losses. Transact Asae. 2004;47:1765–1772. doi: 10.13031/2013.17619.
- Aerts JM, Wathes CM, Berckmans D. Dynamic Data-Based Modelling of Heat Production and Growth of Broiler Chickens: development of an Integrated Management System. Biosystems Engineering. 2003, 84(3):257-266. dio: 10.1016/S1537-5110(02)00285-4.
- Bruyne GD, Aerts JM, Sloten JV, et al. Transient sweat response of the human head during cycling. Int J Ind Ergonom. 2010;40(4):406–413. doi: 10.1016/j.ergon.2010.02.005.
- Hasgall PA, D. G. F. B. 2018. IT’IS Database for thermal and electromagnetic parameters of biological tissues, Version 4.0. https://itis.swiss/virtual-population/tissue-properties/database/.
- IUPS. Glossary of terms for thermal physiology. Jpn. J. Physiol. 2001;51:245–280.
- Pennes HH. Analysis of tissue and arterial blood temperatures in the resting human forearm. J Appl Physiol. 1948;1(2):93–122. doi: 10.1152/jappl.1948.1.2.93.
- ASHRAE, A.H., Fundamentals. American Society of Heating, Refrigerating and Air-Conditioning Engineers, Atlanta, GA, USA, 1997.
- Bruneau DA, Cronin DS. Head and neck response of an active human body model and finite element anthropometric test device during a linear impactor helmet test. J Biomech Eng. 2020;142(2). dio: 10.1115/1.4043667
- Mao H, Zhang L, Jiang B, et al. Development of a finite element human head model partially validated with thirty five experimental cases. J Biomech Eng. 2013;135(11):111002–111015. doi: 10.1115/1.4025101.