
ABSTRACT
The aim of this study is to explore whether a participatory, organizational intervention can reduce work-related risk factors, and thereby prevent stress-related ill health. We build on the job demand-control and effort-reward imbalance models of stress. It is a two-armed randomized trial, with one primary health care unit receiving the intervention and a two-unit control group. Validated questionnaires for the assessment of psychosocial work environment and health were administered, at the baseline and at 6 and 12-month follow up. The primary outcome was job strain. Secondary outcomes were effort–reward imbalance, exhaustion, sleep, and recovery. Group-level objective data on workload and data about relevant processes during the study were continuously collected. The changes in the intervention group with regard to job strain, effort-reward imbalance, exhaustion, sleep and recovery were not statistically different from changes in the control group. For the non-exhausted employees though, reward was significantly higher at follow up compared to baseline, but only in the intervention group. An important piece of information is that the objective workload was statistically significantly higher in the intervention group throughout the study. Not all the components of the intervention were implemented as intended. Context and process information, such as objective data and implementation fidelity are necessary for a valid interpretation of the results.
Introduction
The development of mental ill-health is affected by a number of factors, one of them being work-related stress (Nieuwenhuijsen, Bruinvels, & Frings-Dresen, Citation2010; Stansfeld & Candy, Citation2006). Work-related stress and sick leave due to stress-related illness have increased both in Europe and globally. According to the European Agency for Safety and Health at Work, 25% of workers experience work-related stress most of the time and report that stress has a negative impact on their health (Eurofond & EU-OSHA, Citation2014). As an example, 15 million working days were lost in the United Kingdom in 2013 due to sickness absence caused by common mental disorders (Labour Force Survey, Citation2016). Work-related stress is also one of the main risk factors for ill health among employees in the health care sector (EU-OSHA, Citation2014), where job demands and job complexity are growing (Uchiyama et al., Citation2013). In the Swedish health care sector, 63% of midwives and nurses and 71% of health care specialists have reported high work load (Arbetsmiljöverket, Citation2016).
Some of the organizational and social work related risk factors for mental ill health (i.e., stressors) are: job strain, high job demands, lack of job control, low support, effort–reward imbalance (ERI), and job insecurity (Stansfeld & Candy, Citation2006). It is therefore logical that a work-related intervention aimed at preventing mental ill-health should address these organizational risk factors. As defined by Montano et al. (Montano, Hoven, & Siegrist, Citation2014), organizational-level interventions address the work organization and environment and “modify specific circumstances under which work is performed”, which by definition is prevention at organizational level. It may not always be realistic or possible to involve the whole organization so interventions are often introduced at a group level (Bauer & Jenny, Citation2013).
The aim of this study is to explore whether a participatory, organizational-level intervention can reduce work-related risk factors and thereby prevent stress-related ill health. A participatory intervention is an intervention “designed to increase employees’ opportunities to make decisions or participate in decision-making process at work” (Egan et al., Citation2007). International studies have shown that a participatory approach has positive effects on employee achievements, attitudes and health (Cawley, Keeping, & Levy, Citation1998). Structured, systematic, and participatory interventions, which aimed to improve psychosocial conditions, organization, and work management, are most likely to improve employee wellbeing (Nielsen, Randall, Holten, & González, Citation2010). Participation can also increase sense of control, support, esteem, reward, and interaction with supervisors (Nielsen et al., Citation2010). In other words, it can have an effect on the known risk factors for mental ill-health. Furthermore, one systematic review (Egan et al., Citation2007) has shown that some organizational-level participatory interventions which aim to increase employee control may have beneficial effects on mental health.
Work-related risk factors, such as demands and control are also sometimes called job design factors, while aspects of their quality (high quality, poor quality) are called job characteristics (Daniels, Gedikli, Watson, Semkina, & Vaughn, Citation2017). How job characteristics are perceived, for example if work demands are perceived as high, may be affected not only by the job characteristics themselves but also by the individuals who perceive them. However, it has been shown that job characteristics can predict mental ill-health regardless of personality, i.e., negative affect (Ferguson, Daniels, & Jones, Citation2006). Furthermore, prevention in the workplace could be even more important for employees with individual risk factors, especially if family demands, socio-economic status and other factors cannot be changed. No matter why an individual perceives job characteristics as negative, the consequences of that perception will affect both the individual and the organization.
Despite the known negative impact of an adverse work environment on employee health, there are still relatively few studies of organizational-level interventions which aim to prevent stress-related risk factors and their consequences (Lamontagne, Keegel, Louie, Ostry, & Landsbergis, Citation2007; Richardson & Rothstein, Citation2008). Furthermore, the conclusions of research into the effects of organizational-level interventions diverge. To some extent this depends on whether a narrative assessment of the research or a meta-analysis was carried out. According to one review (Lamontagne et al., Citation2007) organizationally focused interventions, and interventions that were both organizationally and individually focused, were effective at both individual and organizational levels, while individually focused approaches were effective only at individual level. On the other hand, in a systematic review of primary and secondary work-stress management interventions, Richardson and Rothstein (Citation2008), concluded that organizational interventions demonstrated no effect compared to the control conditions which were no-treatment, or waiting list control (Richardson & Rothstein, Citation2008).
In a more recent review of the effects of organizational-level interventions on employee health (Montano et al., Citation2014), only one such intervention (Schrijnemaekers et al., Citation2003), with burnout as the work-stress related outcome, was classified as being of high quality. The intervention was not found to have any significant effect. Another recent review, looking at health care workers (Ruotsalainen, Verbeek, Mariné, & Serra, Citation2014), reveals that most studies examine cognitive behavioural training and mental and physical relaxation. Of the organizational-level interventions, only changing work schedules has so far proved to have a significant effect on stress.
In conclusion, even though the amount of research into preventive organizational-level interventions has increased since the 1990s, it is still relatively scarce and the findings are mixed. In particular, there is a scarcity of randomized controlled trials (RCT). For example, only 6 of 39 studies included in Montano et al. (Citation2014) are RCTs. This indicates that there is a need for more comparative studies with controlled designs. In spite of the obstacles involved in conducting RCTs in organizational contexts (Montano et al., Citation2014), we agree with the realist RCT approach (Bonell, Fletcher, Morton, Lorenc, & Moore, Citation2012) that controlling for as many factors as possible is desirable; and the randomization process reduces the risk of selection bias. That does not mean that we cannot also take the interaction between an intervention and its mechanisms and the contextual factors into consideration when discussing the results of an intervention (Bonell et al., Citation2012). Furthermore, instead of examining only long-term health outcomes, the proponents of the realist RCT-approach advocate examining mechanisms of change, for example by analyzing intermediate outcomes as secondary outcomes or as pathway variables (Bonell et al., Citation2012).
Ruotsalainen et al. (Citation2014) conclude that interventions should focus on specific stressors in order to achieve a better understanding of how they may lead to stress reduction. The literature about mental ill-health and well-being is extensive. Well-being is a broad term (Briner & Walshe, Citation2015) and can mean anything from enthusiasm and lack of anxiety to mastery or self-acceptance (Daniels et al., Citation2017). Therefore, it is important to be explicit about which aspect of well-being or ill-health the intervention is hypothesized to change (Briner, Citation2012). It is important that the proposed intervention is capable, in theory, of having an impact on the factors which affect that particular aspect of well-being or ill-health (Briner & Walshe, Citation2015).
There are a number of theories that are related to risk-factors for mental ill-health. However, this paper uses the job demand-control (JDC) model (Karasek & Theorell, Citation1990) and the ERI model (Siegrist, Citation1996; Siegrist et al., Citation2004) as it’s theoretical background. According to the JDC model, high job demands and low job control are associated with poor mental health and low well-being among employees. High-strain jobs are characterized by a combination of high job demands and low job control. The negative effect of strain on mental health can result from additive, as well as interactive effects of job demands and job control (Häusser, Mojzisch, Niesel, & Schulz-Hardt, Citation2010). The ERI model combines extrinsic (effort, reward) and intrinsic (over-commitment) factors (Siegrist & Li, Citation2016). Each factor has a direct effect on mental health, but the combination of high effort and low reward has an even more detrimental effect on health than each factor independently (Siegrist & Li, Citation2016). Furthermore, individuals with a coping pattern called over-commitment are at a higher risk of ill-health. The model implies that reducing effort, and/or increasing reward can lead to a balance between effort and reward, thereby reducing the risk of negative effects on health, such as exhaustion.
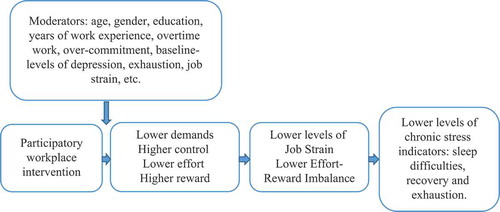
According to these theories and research about risk factors, an intervention that can change employees’ perceptions of demands or effort and/or control or reward (i.e., intermediate outcomes, a pathway of change), could reduce job strain or ERI. This in turn, could lead to improvements in chronic stress indicators, such as exhaustion, impaired sleep, and lack of recovery.
This study explores whether a previously extensively studied intervention for productivity enhancement “Productivity Measurement and Enhancement System” or ProMES, also has preventive effects on the experience of stress, as some studies suggest (Przygodda, Citation1994) and in accordance with the models described above. ProMES is based on the expectancy theory of motivation (Naylor, Pritchard, & Ilgen, Citation1980; Pritchard, Weaver, & Ashwood, Citation2012), as well as on research about feedback, participation in decision-making, goal setting, roles, and role conflict and teams (Pritchard, Harrell, DiazGranados, & Guzman, Citation2008; Pritchard et al., Citation2012). The research hypotheses are that ProMES can:
Reduce perceived levels of job demand, or increase perceived levels of job control, thereby reducing job strain.
Reduce perceived levels of effort, or increase perceived levels of reward, thereby reducing ERI.
Reduce levels of exhaustion or improve sleep and recovery (a hypothetical effect of lower job strain and/or improved effort-reward balance).
ProMES is a profoundly participative intervention (Pritchard et al., Citation2008). Furthermore, over and above participation itself, core strategies of ProMES address work organization and environment, i.e., work-related risk factors such as absence of influence and control, insufficient interaction with co-workers, unclear and conflicting tasks, insufficient participation in decision-making, low esteem reward, and insufficient feedback. Important components of ProMES are: (1) knowing which work results need to be improved and how much; (2) involvement in the development of the evaluation system, thereby increasing the likelihood of perceiving it as accurate and fair; (3) timely feedback about the results of one’s efforts that can be thought of as a positive reinforcement; (4) information sharing; and (5) discussion of problem-solving and work strategies (Pritchard et al., Citation2008, Citation2012). Decision making in ProMES concerns work demands (i.e., deciding which work results should be measured, how they should be measured and how they should be prioritized (Pritchard et al., Citation2008). ProMES can thus give the opportunity to decide freely which aspects of job demands or job control they would like to modify. In other words, it enables employees to tailor the intervention to their contextual needs and circumstances. Furthermore, they are free to choose to work on any other aspect of their psychosocial work environment. In summary, ProMES is a “bottom-up” job redesign intervention that gives opportunities to changes job characteristics and improve job quality (Daniels et al., Citation2017).
In our third hypothesis we chose emotional exhaustion as an outcome because it is a more work-related concept than depression. Furthermore, it is the core dimension of burnout (Maslach et al., Citation2008), is more robust than other burn-out dimensions and is often examined in relation to JDC model (Häusser et al., Citation2010). Impaired sleep is known to be associated with psychological ill-health, such as depression and exhaustion (Åkerstedt, Citation2006). Therefore, improved sleep could be an intermediate sign of an intervention’s positive effect on employee health. Recovery during leisure time presupposes not only relaxation and control over leisure activities, but also not thinking about the job and disengaging from work, i.e., psychological detachment (Siltaloppi, Kinnunen, & Feldt, Citation2009). The hypothesis is that participating in how job demands are defined and having control at work may make it easier not to think about work during leisure hours, thereby affecting psychological detachment and recovery. Recovery is negatively correlated with emotional exhaustion (Sonnentag & Fritz, Citation2007).
Method
Study design
The study is part of a Swedish, practice-based research programme that aims to strengthen corporate health research. One of the objectives of the programme was to support evidence-based practice in the occupational health services by developing and/or evaluating cost-effective, evidence-based interventions for worker health. One of the key characteristics of an evidence-based approach to interventions is not to implement an intervention without having an identified problem (Briner & Walshe, Citation2015). Therefore, to examine the effect of an intervention on job strain, the research team decided that workplaces included in the study should be ones where there is a high probability of employees experiencing job strain. The cut off values for job strain (see also Measures section) are taken from previous research into job strain in a Swedish population (Bergstrom et al., Citation2008). We accordingly selected a type of workplace (primary health care) which, according to Swedish statistics, is highly exposed to stress and stress-related illness (Arbetsmiljöverket, Citation2016). After consulting the partners involved in the research programme, a primary health care division run by a Swedish county council was approached.
In a second step, and in cooperation with the management of the primary health care division and their occupational health services, all primary health care units (n = 29) run by the county council were given information about the project. The first inclusion criterion was that at least 20% of employees should be experiencing job strain (i.e., a combination of low job control and high job demand). The second criterion was that units should not be conducting or planning to conduct any other organizational interventions. Four units agreed to take part in the project. Others were about to start another activity planned at divisional level and were therefore not eligible for this study. The four units were then screened for job strain. All had similar proportions of employees with job strain at screening (between 30% and 40%). The screening questionnaire contained three descriptive questions (sex, age, and sick-leave in the previous three months), and 15 questions about job strain (demands/control). These were taken from the QPS Nordic questionnaire (Dallner et al., Citation2000). The number of employees in the screening procedure is given in . The units’ response rates were between 62% and 75%. Further data collected for each unit included type of catchment area, earlier experience of productivity improvement or stress prevention, employee turnover and staffing levels.
Figure 1. Flow chart for the study.
The study is a two-armed RCT, with the intervention unit working with a group organizational intervention. Two control units were not involved in any organizational interventions. Randomization was carried out at unit level.
Randomization process
Before randomization it was decided for logistical reasons (i.e., there was only one consultant and time was limited), that only one health care unit would be randomized to the intervention group. Because even a small drop out or amount of missing data could leave the study with a very small comparison group, it was decided to randomize two units as one control group. Using a web-based tool for randomization (www.random.org), four numbers between 1 and 12 were chosen by means of a data random generator. Each unit was given one of these numbers. A new randomization of numbers between 1 and 12 was then carried out using the random generator, but before randomization it was decided that the first of these unit numbers to emerge would be an intervention unit. The randomization process resulted in an intervention unit with 56 employees, and a control group with 65 employees (Unit 1 with 29 employees and Unit 2 with 36 employees).
Measurements took place at two baselines (M0 and M1) and at 6-month (M2) and 12-month (M3) follow-ups. The intervention started after the second baseline (M1). Therefore, M1 is used as the baseline in all the analyses in this paper. The first measurement (M0) is only relevant for the collection of objective data (see also section Context data collection and Statistical analysis). Employee stress levels were also followed for almost a year by means of a single- item stress question distributed by weekly text messages. These will be analyzed in a separate paper. The study is registered in ClinicalTrials.gov (ID: NCT02694211).
Participants
Everyone employed at the units at the time of the study was invited to participate. Those not working on a regular basis (i.e., hourly employees) were not included. The cohorts were open, allowing new employees to enter the study. Because of new recruitment, parental leave, staff turnover, etc., there was a natural variation in the number of employees at each measurement point. Employees on long-term leave (parental leave, sick leave, studies) could be included again as soon as they returned to work. However, this was the case for only one employee in the intervention group (who participated at the baseline, was on sick leave at the 6-month follow up and came back soon after that and participated at the 12-month follow up). There was no movement of employees between the intervention and the control group. There was 80 km between the intervention unit and the control unit A, and 5.4 km between the intervention unit and the control group B. To our knowledge, no formal meetings were held where employees from these different units could meet. The three different managers consented not to exchange any information about the project.
Procedures
The logic model. shows the logic model of the study.
Figure 2. The logic model of the study.
Intervention
The intervention was built on the Productivity Measurement and Enhancement System, or ProMES (Pritchard et al., Citation2008, Citation2012), described in the Introduction section. The steps in the intervention are described later and displayed in . For a full description of ProMES see the manual/practical guide (Pritchard et al., Citation2012). The consultant who was working with the intervention group is an independent, external practitioner, who is a certified user of ProMES and a highly experienced ProMES facilitator. He had worked with ProMES for 20 years and was one of the experts at the ProMES International Competence Centre.
Table 1. Steps in the intervention.
A one-hour information meeting was held in June 2013. The intervention itself started with a whole day workshop in September 2013. During this workshop (which was attended by all the employees in the intervention group), the ProMES facilitator talked about issues such as motivation, goals, feedback, feedback meetings, approval from management, objectives, indicators, and efficacy curves (contingencies). The unit members then scrutinized the objectives and measures used in their primary health care division at county council level and worked on their vision and their overarching objectives (i.e., to agree on the important and desirable results for the group). These were as follows: high quality, good deliverability, skills development, a health-promoting, and motivating work environment.
After the initial workshop the unit was divided into one overarching design team and seven occupational design teams. The latter represented a variety of professions, such as physicians, nurses, physiotherapists, medical secretaries, laboratory technicians, counselors working in general medicine, and one team for staff working in child and maternity care. In this way, teams could work with indicators specific to their professions and employee participation could be maximized (rather than having only one design team for the entire unit). Design teams consisted of 2–4 persons, meaning that at least half of the employees in the intervention group were at some point actively involved in the work of the design teams. Furthermore, the design team members could sometimes rotate, which means that it was not necessarily the same person from the occupational group who participated in all meetings. Some meetings were held with all the members of a particular professional group. For small professional groups all the members were part of the design team (for example counsellors and laboratory technicians. See also Results section, ). Between design team meetings, occupational group meetings and workplace meetings were used to share information, get input from all employees and discuss and work on the development of evaluation systems. Written information was shared by email and on notice boards. Design team meetings for nurses, secretaries, and physicians started in October 2013 and for laboratory staff, physiotherapists and consultants in November 2013. Employees at the child care centre and maternity clinic started in December 2013. All design teams, except for the child care/maternity clinic and counsellors, had five to six meetings during the intervention period. Another whole day workshop for the entire unit was held in December 2013. Here the occupational subgroups presented their work so far, how and why they had chosen their indicators, and how these were related to the common vision of the unit. Improvement measures, either already implemented or planned, were also presented. The subgroups then continued to work on their indicators. The second half of the day was devoted to working jointly on the overarching indicators “high quality” and “skills development”. In particular, joint measurement of patient-perceived quality was discussed.
Table 2. Descriptive data, intervention and control group, at baseline measurement (M1), 6-month (M2) and 12-month (M3) follow-up.
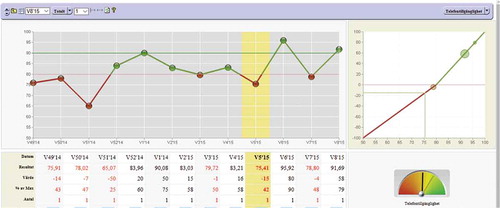
As described earlier, all professional subgroups worked (discussion to consensus) with their own specific indicators and contingencies related to overarching objectives. Every objective had several indicators. These included, for example: total number of completed dictations (medical secretaries, objective: deliverability); number of minutes devoted to skills development (nurses, objective: skills development); positive feedback to each other (child care/maternity clinic, objective: health promoting and motivating work environment). A contingency (see Appendix 1 for an example from this study, phone availability) is the relationship between the amount of one indicator (horizontal axis, in our example percent of phone calls answered) and the effectiveness of that amount, i.e., its contribution to the organization (Pritchard et al., Citation2012). The scale ranges from +100 (maximum, highly positive) to −100 (minimum, highly negative) effectiveness. A zero point is the expected level of effectiveness, i.e., minimum level of acceptable performance, neither good nor bad. In this example it was 80%. The function line shows how a certain level of an indicator is related to effectiveness. The overall range shows the relative importance of each indicator and the zero point translates measurement into evaluation. For a more detailed description see Pritchard et al. (Citation2008).
Control group
The control groups are so-called waiting list controls. They were promised by the management of the primary health care division that they too would be able to take part in an intervention after the end of the study. As a minimal intervention, a few weeks after the first baseline measurement, two members of the research group gave a 1-hour general feedback on selected results from the baseline questionnaire to the management of the two control groups. The groups were also given written feedback material in the form of power point presentations of results using simple bar charts with mean values and brief explanations of the presented work factors. This material was to be used at their discretion. No other interventions were carried out and the management had further agreed not to engage in any new organizational-level interventions.
Measures
A two-part web-based questionnaire was administered. The first part aimed to assess the psychosocial work environment, health and lifestyle. It was developed and used in the AHA-study (Bergstrom et al., Citation2008) and based primarily on QPS-Nordic (Dallner et al., Citation2000). The second part was the ERI questionnaire (Leineweber et al., Citation2010; Siegrist, Citation2013).
Primary outcome measure: job strain
The AHA-questionnaire (Bergstrom et al., Citation2008) is a comprehensive compilation of validated instruments mainly taken from QPS Nordic. It includes scales for the measurement of job demands and job control, in accordance with the JDC model of work-related stress. We chose JDC rather than the JDC-S model because it is more strongly supported by research with regard to emotional exhaustion (Häusser et al., Citation2010). The job-demands subscale measures quantitative workload and cognitive demands and comprises seven questions. Examples of these are: “Is your work load irregular so that the work piles up?” and “Does your work require quick decisions?” The job control subscale comprises eight questions. Examples of these are: “Can you influence the amount of work assigned to you?” and “Can you influence decisions that are important for your work?” Answers are given on a 5-point Likert scale (ranging from 1 = very seldom or never to 5 = very often or always). Job demands and job control subscales are continuous variables and are used as such when they are regarded as dependent variables themselves (first part of Research question 1). When used for computation of job strain (second part of the research question 1) they are dichotomized as suggested in the procedures described by Karasek (Karasek & Theorell, Citation1990), i.e., the quadrant approach. Job strain is the relationship between high job demands and low job control. The cut off values for “high” and “low” are taken from previous research into job strain in a Swedish population. (Bergstrom et al., Citation2008). Low job control was defined as < 3 and high job demands as ≥ 2.857). Cronbach’s α for the job demands scale for this population was .77 (baseline 2), .74 (6-month measurement), and .76 (12-month measurement). The corresponding α’s for job control were .79, .83, and .81.
Secondary outcome measures
ERI is measured by the ERI Questionnaire (Siegrist, Citation1996, Citation2013). The German version of ERI questionnaire had already been translated into Swedish (Fahlén et al., Citation2006) and validated (Leineweber et al., Citation2010; Siegrist et al., Citation2014). It contains six questions about effort (for example: “I am under constant time pressure due to a heavy work load”) and 11 about reward (for example: “Considering all my efforts and achievements, I receive the respect and credit I deserve at work”). Answers are given on a 4-point Likert scale (ranging from 1 = strongly disagree to 4 = strongly agree). ERI is a ratio of effort and reward subscales, with a ratio of above 1.0 regarded as imbalance (Siegrist, Citation2013). Cronbach’s α for the effort scale for this population at baseline 2, and at 6 and 12 month measurement was .64, .56, and .64, respectively. Corresponding alphas for the reward scale were .77, .73, and .66.
Exhaustion is measured by the validated Swedish version of the Oldenburg Burnout Inventory-OLBI (Demerouti, Bakker, De Jonge, Janssen, & Schaufeli, Citation2001; Peterson, Citation2008). It has eight questions, for example: “After my work, I usually feel worn out and weary” and “During my work I often feel emotionally drained”. The answers are given on a 4-point Likert scale (ranging from 1 = strongly disagree, to 4 = strongly agree). Possible scores are 8–32. The higher the score, the more exhaustion is indicated. (0–17.59 non-exhaustion; 17.60–21.99 mild exhaustion; 22–32 severe exhaustion). Cronbach’s α for the exhaustion scale for this population at baseline 2, and at 6- and 12-month measurement was .84, .82, and .84.
Problems with sleeping because of thinking about work are measured by the validated question from the Swedish project “Schools in development” (Aronsson, Svensson, & Gustafsson, Citation2003): “Does it happen that you find it difficult to sleep, lying awake thinking about the job?”. The validated question measuring recovery is from the same project: “Do you feel you have recovered and are thoroughly rested when you start a working week?” Response alternatives are on a 5-point Likert scale from (1) “never” to (5) “very often”.
Measures used as covariates
Depression is measured by the Swedish validated version of the Hospital Anxiety and Depression Scale-HAD (Lisspers, Nygren, & Söderman, Citation1997; Zigmond & Snaith, Citation1983). Example of questions: “I still enjoy things I used to enjoy” and “I feel as if I am slowed down”. Answers are given on a 4-point scale, from 0 (Not at all) to 3 (Nearly all the time). Cut off points are 0–7.99 non-depression, 8–11 mild depression, 11.01–21 severe depression. Cronbach’s α for this population was .86, .85, and .84 at the baseline, and at 6 and 12 month measurement, respectively.
Over-commitment was measured by the ERI questionnaire (Siegrist, Citation1996, Citation2013). This consists of six questions such as “As soon as I get up in the morning I start thinking about work problems” or “People close to me say I sacrifice too much for my job”. Answers are given on a 4-point scale (ranging from 1 = strongly disagree to 4 = strongly agree). Higher scores indicate over-commitment. In most comparable studies the mean is between 11.79 and 15.95 (Siegrist, Li, & Montano, Citation2014). This population’s Cronbach’s αs for the over-commitment scale at the baseline, and at 6- and 12-month measurements were .81, .86, and .84.
Context data collection
The measurement of job demands and job control is based on employees’ subjective appraisal. It is important, wherever possible, to have some kind of measure of objective work characteristics. This benefits both the process analysis and the interpretation of results (Häusser et al., Citation2010). Monthly, group-level objective data about workload for the intervention and control groups were collected from the central administrative office of the county council. Measures included hours worked, total number of tasks, total number of patient visits, number of administrative tasks, number of patients on the unit’s list, and total number of telephone calls taken. In addition, information about important events, such as group activities was collected throughout the project, starting at the time of the screening procedure. Information was collected by means of documents, checklists and short, bimonthly telephone interviews with unit managers.
Statistical analysis
All analysis was performed with IBM-SPSS Statistics V.22. Significance level of .05 (two-sided) was used in all the analyses. The power varies from approximately 60–80% depending on the assumptions made. The number of employees in the two randomized control units was small and would be reduced still further by non-response, thus making analysis difficult. The two control units were therefore merged into one control group. T-test (for age, working hours per week, overtime and overall health), and Mann–Whitney test (for ordinal variables), were used to examine differences between the intervention and control groups with regard to background variables. The following steps were taken to test whether ProMES helps to reduce job-strain, ERI, sleep difficulties, recovery and exhaustion. First, the unadjusted effect of ProMES was tested by means of Generalized Estimating Equations (GEE). Second, to determine which covariates should be adjusted for, we applied Modified Poisson regression or Linear regression analysis to examine whether the variables age, overtime, experience (years at organization and years in the profession), over-commitment, depression, and exhaustion were correlated with the outcome variables. The analysis was explorative for the age, overtime and experience, while the over-commitment was hypothesized to be a possible moderator in accordance with earlier research (Siegrist & Li, Citation2016). Also, depression is known to alter cognitive functioning (Clark, Chamberlain, & Sahakian, Citation2009), and could therefore also affect perceptions of control, reward, etc. Depression and exhaustion share several common characteristics (Iacovides, Fountoulakis, Kaprinis, & Kaprinis, Citation2003), and are significantly correlated in this sample. Because exhaustion is a more work-related concept than depression, we included exhaustion as a covariate in the final models. Furthermore, baseline levels of outcome variables were included as covariates. GEE analysis was also used in a final, adjusted analysis of the effect of the remaining independent variables (and their interactions) on the outcome variables.
For the objective data, monthly group-level ratios between the total number of tasks (Tasks) and the total number of hours worked (Time) were calculated, as well as ratios between Time and total number of visits (including home visits and group visits); Time and number of administrative tasks and Time and number of telephone calls taken. T-test for dependent observations was used to analyze differences between the groups (Norman, Citation1971).
Results
Baseline participant characteristics
The study population consisted of three units with a total of 118 employees at inclusion baseline (M1), 123 at 6-month follow-up (M2), and 130 at 12-month follow-up (M3). For all response rates and characteristics of the population (age, working hours per week, overtime, overall health, etc.) at the different measurement points see and .
Neither the T-test (for age, working hours per week, overtime, and overall health) nor the Mann–Whitney test (for ordinal variables) revealed significant differences between the intervention and the control groups at any measurement point.
Objective production data
displays ratios between objective monthly organizational data collected during the project period, i.e., between first measurement (M0) in May 2013 and last measurement (M3) in September 2014. T-test for dependent observations was used to analyze differences between the groups (see ). The intervention group had a significantly higher Task/Time ratio (1.515 tasks per hour worked), i.e., less time per task. The intervention unit also had significantly more administrative tasks per hour worked (i.e., 2.135 h worked per administrative task) and significantly more telephone calls taken per hour worked (1.863 h worked for every phone call). The difference between the groups regarding the number of patient visits per hour worked was not significant. Neither was the difference between groups regarding the ratio between the number of patients and hours worked, although the variance in the intervention group was large in this case. The number of patients on the intervention unit’s list rose by 4.2% from M0 to M3, while the equivalent rise for the control group was 0.7%.
Table 3. Group-level monthly ratio between the total number of tasks (Tasks) and the total number of hours worked (Time); Time and total number of visits (including home visits, group visits, etc.); Time and total number of administrative tasks (Admin); Time and total number of telephone calls taken (Phone); and total number of patients on unit list (List) and Time. The results are given for the intervention group (I) and the control group (C).
Table 4. The difference in the quantitative workload between the intervention group (I) and the control group (C). T-test for dependent observations.
Additional context information about the participating groups
All units had experience of and had worked with Lean Production and Breakthrough series model (IHI, Citation2003). The intervention unit manager described its catchment area as “both urban and rural”, but not a socially challenged area. The intervention unit had a high staff turnover and overcrowded premises, which were scheduled for rebuilding. The control units were described as socially challenged and with either a high proportion of elderly residents (25%) or immigrant-dense areas.
Intervention fidelity and control group activities
A comprehensive process analysis for the SPA project will be published separately; in the present paper we only present the information that is most important for the above results.
Intervention fidelity
Because of a high workload and the difficulty of obtaining information from the central administrative office, the design teams and their professional groups did not complete the intervention during the project. For example, they did not fully develop contingencies (i.e., operationalized the relationship between results and evaluation for all indicators). As a consequence, full feedback reports could not be developed. Nor was it then possible to conduct regular feedback meetings to follow up full feedback reports. However, this does not mean that no feedback meetings were held. For example, phone availability feedback reports could be completed and followed up; they showed that phone availability increased during the intervention. Another example is feedback about measurement of patient satisfaction which also showed a tendency to increase.
Control group activities
According to a telephone interview with the manager, the entire workforce of control subgroup A, (see , Flow chart) took part in four full-day seminars with a consultant psychologist specialized in health psychology, between spring 2013 and September 2014. The first seminar took place before the study start (spring 2013). The starting point was positive psychology and the group worked with roleplay about their particular roles. They also discussed which factors could facilitate or prevent achievement of their goals. During the same period, control subgroup B worked without a consultant on the following: (a) an inventory of areas in need of improvement (two days, April 2013, i.e., before the intervention start); (b) how to bring about improvements following on from the inventory (six 1-hour sessions during autumn 2013); (c) discussion of how to implement b (all employees, half day, autumn 2013); (d) work with the basic values of the primary health care division (this was decided at division level, with all employees divided into working groups for five 3-hour sessions, January–September 2014). Control subgroup B worked with a wide range of questions, which included everything from common working calendar to work routines, improvement proposals in different areas, collaboration with other care givers, etc.
Descriptive outcome data
displays descriptive data for the outcome variables and the variables used in the analysis as covariates, at M1, M2, and M3.
Table 5. Descriptive data for the outcome variables and the variables used in the analysis as covariates, at baseline measurement (M1) and at the 6-month (M2) and 12-month (M3) follow-ups.
Main analysis
The initial analysis indicated that neither age, overtime, experience (years at organization and years in profession) nor their interaction were significantly correlated with the outcome variables. They were therefore not included in the further analysis. A corresponding analysis for depression, exhaustion and over-commitment demonstrated significant correlations with the outcome. Because depression and exhaustion are correlated and exhaustion is a more work-related concept than depression, we included exhaustion as a covariate in the final models.
Research hypotheses 1: ProMES can reduce perceived levels of job demand, or increase perceived levels of job control, thereby reducing job strain.
There was no significant difference in the change in levels of job strain between the intervention and the control groups, neither in the unadjusted nor the adjusted model (RR = .947; 95% CI = .730; 1.229). For a detailed account, see Appendix 2. Nor was any significant difference between groups found for job control. In the adjusted model only the baseline level of job strain predicted job strain at M2 and M3 (b = 1.144; 95% CI = .547; 1.741; p = .001). Similarly, only the baseline level of job demand predicted job demand at M2 and M3, while only the baseline level of job control predicted job control at M2 and M3.
Research hypotheses 2: ProMES can reduce perceived levels of effort, or increase perceived levels of reward, thereby reducing effort-reward imbalance.
There was no significant difference in the change in ERI between the intervention and the control groups (b = .003; 95% CI = −.052; .059; p = .903). For details, see Appendix 2. In the adjusted model, only the baseline level of effort-reward predicted effort-reward at M2 and M3.
Initial analysis revealed a significant interaction effect between baseline exhaustion and group. In the intervention group the changes in ERI differed between the subjects who showed signs of exhaustion and those who did not, with employees with high exhaustion (Olbi>22) at baseline (M1) having significantly higher ERI at follow up (Diff.: .070; 95% CI = .005; .134; p = .034).
There was no significant difference between the groups with regard to effort, with only the baseline level of effort predicting effort at M2 and M3. However, a significant three-way interaction was identified, and the dataset was therefore divided into the intervention and the control group before interaction analysis was performed. This analysis () shows that for the intervention unit’s employees with low baseline effort (M1 effort ≤ 7), effort at M2 was higher than at M3 (i.e., effort decreased over time). For the employees with high baseline effort (M1 effort >18.4), effort at M3 was higher than at M2 (i.e., increasing over time). No significant interaction was found for the control group, where effort at M3 was higher than at M2 regardless of the baseline level of effort (M1). In other words, the perception of effort increased in the control group regardless of the baseline level of effort.
Table 6. Interaction analysis for the intervention group, effort as outcome.
A non-significant effect in favour of the intervention group was found for positive development of reward (b = 1.215; 95% CI = −.055; 2.485; p = .061). For details, see Appendix 2. An interaction effect was revealed in the analyses with two interaction terms (group and exhaustion, group and reward). For low values of exhaustion at baseline (exhaustion at M1 < 17), reward levels were significantly higher at follow up for the intervention group (). The reverse is true for high values of exhaustion at baseline (exhaustion at M1 ≥ 23).
Research hypotheses 3: ProMES can reduce levels of exhaustion or improve sleep and recovery (a hypothetical effect of lower job strain and/or improved effort-reward balance).
Table 7. Interaction analysis, reward as outcome. Difference in reward between the control and the intervention groups for different values of baseline (M1) exhaustion as measured by Oldenburg Burnout Inventory (Olbia).
There was no significant difference between groups regarding problems with sleeping (b = .097; 95% CI = −.303; .497; p = .634) or recovery (b = .036; 95% CI = −.353; .425; p = .857).
Furthermore, there was no significant difference in exhaustion over time (b = .431; 95% CI = −.755; 1.616; p = .477) between the intervention and the control groups. For a detailed account, see Appendix 3.
Discussion
The results of the present study show that the changes in levels of job strain that occurred in the intervention group were not statistically different from the changes that occurred in the control group. The hypothesis was that perceptions of work demands and/or work control would change when employees were given the opportunity to participate in goal setting; defining job demands and priorities; measuring results; developing evaluation systems; information sharing; and increased interaction with coworkers. This hypothesis could not be confirmed in this study. Furthermore, no significant differences between the groups were found for sleep difficulties caused by thinking about work, or for recovery or exhaustion.
One interpretation of the results could be that the statistically insignificant differences between the groups indicate that the intervention did not have any effect on stress and its consequences. This would be in line with research showing that there is a lack of empirical evidence that organizational-level interventions are effective against stress (Lamontagne et al., Citation2007; Montano et al., Citation2014; Richardson & Rothstein, Citation2008; van der Klink, Blonk, Schene, & van Dijk, Citation2001). However, if the information about objective workload is taken into consideration, another, possibly more perceptive interpretation emerges. If objective demands are constantly higher in the intervention group, but the perception of job strain, at least at group level, does not increase, then job strain being equal at follow up could actually mean that the intervention did have some preventive effects which are confounded by higher work load. The intervention might have prevented a higher perception of stress during a period when the objective workload was high and rising. This is in line with ideas about the importance of taking context and process into consideration when interpreting the results of an intervention (Biron & Karanika-Murray, Citation2014). Information about context and process are vital for a more comprehensive understanding of the variance in the outcomes (Biron & Karanika-Murray, Citation2014). Information about the objective, quantitative workload is clearly important contextual information. Undesirably high job demands may have a negative impact on health, regardless of the amount of job control (Häusser et al., Citation2010). If the effects of job demands and job control are additive, then even active jobs (high demands/high control jobs) can lead to a deterioration in health, if the job demands are perceived as too high. It may not be possible to detect significant effects of the intervention in this study as long as greater control given by the intervention is thwarted by increasing demands.
The trial revealed a complex and interesting picture of the secondary outcome, namely the ERI and its constituent subscales effort and reward. Interaction analysis shows that for employees who were not exhausted at baseline, there was a significant difference between groups in perception of reward. In other words, after the intervention the subgroup of non-exhausted employees in the intervention group perceived their work to be more rewarding than did the members of the control group. The opposite is true for the subgroup of employees who perceived themselves as exhausted at baseline. The same pattern was detected in the intervention group for effort and ERI. In other words, the effects of an organizational intervention can differ between subgroups depending on their level of exhaustion at baseline. An intervention could well have a preventive effect on healthy individuals, but this effect might cease when they become exhausted (or might even put extra strain on individuals who perceive themselves as already being over-burdened).
It can also be argued, as above with regard to the JDC model, that an effort-reward balance (effort-reward ratio < 1) does not suffice for good health as long as effort is undesirably high: the population of the present study was mildly exhausted despite having effort-reward balance. If effort is too high but is balanced by high reward the ratio could be under one (1) and the individual would still be in a risk zone. It might therefore be wise in future interventions to supplement efforts to provide control and reward with measures targeting objective workload (or, more specifically, objective workload in relation to the individual resources of each employee). Some research has shown that socio-technical interventions (workload interventions, work schedule interventions, work procedure interventions) appear to be more effective than psychosocial organizational interventions (Hurrell, Citation2005). However, the research regarding stress prevention is in no way conclusive, and the lack of evidence should not be seen as proof that there are no effective psychosocial organizational interventions. Furthermore, the combination of psychosocial organizational interventions and socio-technical interventions might give an important synergetic effect.
Another synergetic effect might possibly be achieved by combining an organizational-level intervention such as ProMES with efforts at individual level. Preventive organizational interventions are by definition not meant to be therapeutic. It is our opinion that the present study indicates that secondary or tertiary interventions targeting individuals should be offered in conjuction with organizational interventions for individuals who are demonstrating signs of exhaustion or depression at baseline. This is because people with work-related stress complaints usually have cognitive impairments (especially prospective memory, speed and complex working memory) (Eskildsen, Andersen, Pedersen, Vandborg, & Andersen, Citation2015). Furthermore, there is a significant difference between healthy controls and patients with stress-related exhaustion in terms of executive function, attention, learning, episodic memory, and recall (Jonsdottir et al., Citation2013). Finally, a systematic review and meta-analysis has also shown that cognitive impairment is a core feature of depression (Rock, Roiser, Riedel, & Blackwell, Citation2014). Employees already showing signs of exhaustion, depression or other minor mental disorders, such as adjustment disorder, will therefore have deficiencies in executive functions (including prospective memory, decision-making and problem solving). If they are not adequately supported they might experience any intervention as additional load. Our results showing differential effects of ProMES on exhausted/not exhausted employees (regarding the perception of how rewarding work is), is in line with this reasoning. Employees showing signs of exhaustion should be given greater opportunity to plan and pace their own work (Berg, Robroek, Plat, Koopmanschap, & Burdorf, Citation2011). They may, however, need support to implement this. Problem-solving techniques/therapy would therefore appear to be a logical individual-level intervention when executive functions are affected. Certain problem-solving activities at team level are feature of ProMES intervention, but they are probably not sufficient for employees who are already affected.
Problem-solving therapy has been shown to have positive effects on depression (Cuijpers, van Straten, & Warmerdam, Citation2007), return to work (RTW) related to sickness absence due to mental disorders (Dewa, Loong, Bonato, & Joosen, Citation2015) and in facilitating partial RTW in adults with adjustment disorder (Arends et al., Citation2012). The above is also consistent with other research showing that the best effects may be achieved by a combination of organizational and individual interventions (Lamontagne et al., Citation2007). As Egan and colleagues argue (Egan et al., Citation2007), participative organizational interventions may be of some benefit, but “may not protect employees from generally poor working conditions”, or, as in the case of this study, higher objective workload, overcrowded premises, high turnover and steadily increasing numbers of listed patients.
Furthermore, a recent systematic review (Daniels et al., Citation2017) indicates that the most effective organizational interventions to date are those that combine job redesign and training (such as training in risk assessment, ergonomic training, etc.) or job redesign and system-wide changes (for example human resource management practices, resource planning system etc.). This indicates that really successful actions against stress require a very broad approach combining psychosocial organizational interventions, socio-technical interventions, system-wide changes, training, and individual level support (problem solving) for individuals in the risk zone (or already affected). Stress and stress-related ill-health are complex problem which may well require equally complex solutions.
One factor which was important for the interpretation of the results is that one of the control groups had very high non-response rates: 35% at M2 and 30% at M3. Twenty-seven percent failed to answer because of perceived high workload. This raises the question of whether we may be observing a kind of healthy worker effect (Shah, Citation2009), i.e., that severely affected employees failed to answer, thereby biasing levels of job strain. This would be especially likely in the control groups, which had higher levels of non-responders (see the flow chart) and is of additional importance for how we interpret the results. Levels of strain could in reality be higher in the control group, but confounded by healthy worker effect, which then can obscure the statistical effect.
Another question worth considering is whether data collection about the control group’s activities shows that the intervention under study could have been compared to other kinds of intervention, rather than to the non-intervention, as intended. This is not necessarily of huge importance here. We intended a comparison with a treatment-as-usual condition. However, in a complex organizational life a whole range of activities could count as “treatment-as-usual” and a total absence of activities may not be possible. A further option is to regard these activities as an alternative intervention, which means that we would be comparing two interventions. Again, this might not necessarily be a problem. Within other areas of research, such as therapy research, alternative therapies and not only waiting list controls are commonly used as comparison groups. What we can be confident about here is that ProMES in this study, even if not fully implemented and implemented under condition of increasing objective, quantitative work load, is at least comparable to these “alternative interventions”. An important piece of information though is that none of the activities in the control groups addressed demands and control.
There are several limitations to this study. The major limitation concerns implementation fidelity. The unit was split into professional groups and seven design teams were formed. This was done to boost participation and to be able to give feedback that was clearly linked to the efforts and results that the specific professional group had control over. This division can be debated because it made detailed information at professional level necessary, which was difficult to obtain. Furthermore, research about ProMES showed that problems can arise if the time between the start of the project and feedback is too long, i.e., more than 7–8 months (Pritchard et al., Citation2012). This was the case here, partly due to the fact that only one facilitator worked with all the subgroups and therefore could not start all the groups at the same time. Two of the core components of ProMES (building contingencies and regular monthly feedback meetings) were never fully implemented in all occupational subgroups. This was partly due to time constraints but mostly to the difficulty in obtaining the information necessary for building the contingencies from the central administration. Engagement of all levels of management is important for the successful implementation of an intervention. This study also shows the importance of engaging other parts of the organization, such as the central administration.
Second limitation is that, due to lack of interested units at the time of the study (most units were about to start another activity), we only had a small number of units to randomize. A further limitation is that, due to the small number of employees in the control units, we could not perform separate analyses for the two groups, which could have given more information about differences between the control groups and the intervention group. Finally, a longer follow-up period of 18 months or more might be preferable for complex interventions (Biron & Karanika-Murray, Citation2014).
Studies of workplace interventions should strive for high methodological quality (Hammer et al., Citation2015). Even though it is difficult to control all the processes and variables in organizational intervention research, RCTs make it possible to control some important factors such as interaction between interventions and contextual factors (Bonell et al., Citation2012). Without a randomized control group we might attribute changes to the intervention when they are actually caused by other factors. To interpret results correctly it is important to supplement statistical analysis and significance testing with as much other information as possible, including contextual, process, and preferably also objective data. Statistical significance is only one piece of information in the evaluation of an organizational intervention. Where the part of the intervention evaluated in this study is concerned, it will be necessary to carry out a repeat study with full implementation before its efficacy for stress prevention can be fully judged. Meanwhile, its efficacy as a method for productivity enhancement has once again been demonstrated. For example, phone availability increased during the intervention, as did patient satisfaction. An interesting future study would be to train managers to work with the ProMES as an integrated organizational tool that can be implemented in the entire organization. This would probably remove implementation obstacles met in this study. Our study also demonstrates the importance of collecting data about objective work load in order to fully understand the results. A complementary, comprehensive process evaluation, including a focus group and interviews, will be published elsewhere and will give a picture of employees’ views and experiences of working with ProMES.
In conclusion, the results of this study do not support our hypotheses that a participative organizational intervention for productivity enhancement also can have stress preventive effects in terms of reduced levels of job strain or ERI. Because of the implementation limitations and the objectively higher work load in the intervention group we cannot draw general conclusions on the basis of the findings of this study.
Ethical approval
Stockholm regional Ethical Review Board has approved this project. 2012/2200-31/5. Clinical trials protocol: ClinicalTrials.gov ID: NCT02694211
Acknowledgments
We are grateful to Eva Nilsson and Camilla Martinsson for their valuable help with data collection, and to the management and the employees of the three primary health care units in the Örebro County Council, who made this study possible. We acknowledge the financial support for this study from AFA Insurance and the Swedish Research Council for Health, Working Life and Wellfare.
Disclosure statement
The authors declare that they have no potential conflicts of interest.
Additional information
Funding
References
- Åkerstedt, T. (2006). Psychosocial stress and impaired sleep. Scandinavian Journal of Work, Environment & Health, 32, 493–501.
- Arbetsmiljöverket. (2016). The work environment 2015. Stockholm: Sweden.
- Arends, I., Bruinvels, D. J., Rebergen, D. S., Nieuwenhuijsen, K., Madan, I., Neumeyergromen, A., … Verbeek, J. H. (2012). Interventions to facilitate return to work in adults with adjustment disorders. Cochrane Depression, Anxiety and Neurosis Group, 12. doi:10.1002/14651858.CD006389.pub2
- Aronsson, G., Svensson, L., & Gustafsson, K. (2003). Unwinding, recuperation, and health among compulsory school and high school teachers in Sweden. National Institute for Working Life, 10, 217–234.
- Bauer, G. F., & Jenny, G. J. (2013). From fidelity to figuration: Current and emerging approaches to organizational health intervention research. In G. F. Bauer & G. J. Jenny (Eds.), Salutogenic organizations and change: The concepts behind organizational health intrevention research. Dordrecht. Netherlands: Springer Science+Business Media.
- Berg, T., Robroek, S., Plat, J., Koopmanschap, M., & Burdorf, A. (2011). The importance of job control for workers with decreased work ability to remain productive at work. International Archives of Occupational and Environmental Health, 84, 705–712.
- Bergstrom, G., Bjorklund, C., Fried, I., Lisspers, J., Nathell, L., Hermansson, U., … Jensen, I. B. (2008). A comprehensive workplace intervention and its outcome with regard to lifestyle, health and sick leave: The AHA study. Work, 31, 167–180.
- Biron, C., & Karanika-Murray, M. (2014). Process evaluation for organizational stress and well-being interventions: Implications for theory, method, and practice. International Journal of Stress Management, 21, 85–111.
- Bonell, C., Fletcher, A., Morton, M., Lorenc, T., & Moore, L. (2012). Realist randomised controlled trials: A new approach to evaluating complex public health interventions. Social Science & Medicine, 75, 2299–2306.
- Briner, R. B. (2012). Developing evidence-based occupational health psychology. In J. Houdmont, L. Stavroula, & R. R. Sinclair (Eds.), Contemporary occupational health psychology: Global perspectives on research and practice (Vol. 2). Chichester, UK: John Wiley and Sons, Ltd.
- Briner, R. B., & Walshe, N. D. (2015). An evidence-based approach to improving the quality of resource-oriented well-being interventions at work. Journal of Occupational and Organizational Psychology, 88, 563–586.
- Cawley, B. D., Keeping, L. M., & Levy, P. E. (1998). Participation in the performance appraisal process and employee reactions: A meta-analytic review of field investigations. Journal of Applied Psychology, 83, 615–633.
- Clark, L., Chamberlain, S. R., & Sahakian, B. J. (2009). Neurocognitive mechanisms in depression: Implications for treatment. Annual Review of Neuroscience, 32, 57–74.
- Cuijpers, P., van Straten, A., & Warmerdam, L. (2007). Problem solving therapies for depression: A meta-analysis. European Psychiatry, 22, 9–15.
- Dallner, M., Lindström, K., Elo, A.-L., Skogstad, A., Gamberale, F., Hottinen, V., … Örhede, E. (2000). Användarmanual för QPSNordic. Frågeformulär om psykologiska och sociala faktorer i arbetslivet utprovat i Danmark, Finland, Norge och Sverige. Nordiska Ministerrådet. Solna. Stockholm. http://www.niwl.se/arb/
- Daniels, K., Gedikli, C., Watson, D., Semkina, A., & Vaughn, O. (2017). Job design, employment practices and well-being: A systematic review of intervention studies. Ergonomics, 1–80. doi:10.1080/00140139.2017.1303085
- Demerouti, E., Bakker, A. B., De Jonge, J., Janssen, P., & Schaufeli, W. B. (2001). Burnout and engagement at work as a function of demands and control. Scandinavian Journal of Work, Environment & Health, 27, 279–286.
- Dewa, C. S., Loong, D., Bonato, S., & Joosen, M. C. W. (2015). The effectiveness of return-to-work interventions that incorporate work-focused problem-solving skills for workers with sickness absences related to mental disorders: A systematic literature review. BMJ Open, 5, e007122-e007122.
- Egan, M., Bambra, C., Thomas, S., Petticrew, M., Whitehead, M., & Thomson, H. (2007). The psychosocial and health effects of workplace reorganisation. 1. A systematic review of organisational-level interventions that aim to increase employee control. Journal of Epidemiology & Community Health, 61, 945–954. 61/11/945 [pii].
- Eskildsen, A., Andersen, L. P., Pedersen, A. D., Vandborg, S. K., & Andersen, J. H. (2015). Work-related stress is associated with impaired neuropsychological test performance: A clinical cross-sectional study. Stress, 18(2), 198–207.
- EU-OSHA. (2014). Current and emerging issues in the health care sector, including home and community care. European Risk Observatory. Luxembourg: Publications Office of the European Union.
- Eurofond, & EU-OSHA. (2014). Psychosocial risks in Europe: Prevalence and strategies for prevention. Luxembourg: Publications Office of the European Union.
- Fahlén, G., Knutsson, A., Peter, R., Åkerstedt, T., Nordin, M., Alfredsson, L., & Westerholm, P. (2006). Effort–Reward imbalance, sleep disturbances and fatigue. International Archives of Occupational and Environmental Health, 79, 371–378.
- Ferguson, E., Daniels, K., & Jones, D. (2006). Negatively oriented personality and perceived negative job characteristics as predictors of future psychological and physical symptoms: A meta-analytic structural modelling approach. Journal of Psychosomatic Research, 60, 45–52.
- Hammer, L. B., Truxillo, D. M., Bodner, T., Rineer, J., Pytlovany, A. C., & Richman, A. (2015). Effects of a workplace intervention targeting psychosocial risk factors on safety and health outcomes. (Research Article)(Report). doi:10.1155/2015/836967
- Häusser, J. A., Mojzisch, A., Niesel, M., & Schulz-Hardt, S. (2010). Ten years on: A review of recent research on the Job Demand–Control (-Support) model and psychological well-being. Work & Stress, 24, 1–35.
- Hurrell, J. J. (2005). Organizational stress intervention. In J. E. Barling, K. Kelloway, & M. R. Frone (Eds.), Handbook of work stress (pp. 623–647). Thousand Oaks, CA :SAGE Publications, Inc. Online Pub. Date: June 22, 2009.
- Iacovides, A., Fountoulakis, K. N., Kaprinis, S., & Kaprinis, G. (2003). The relationship between job stress, burnout and clinical depression. Journal of Affective Disorders, 75, 209–221.
- IHI. (2003). The breakthrough series: IHI’s collaborative model for achieving breakthrough improvement. IHI Innovation Series white paper. Boston: Institute for Healthcare Improvement
- Jonsdottir, I. H., Nordlund, A., Ellbin, S., Ljung, T., Glise, K., Währborg, P., & Wallin, A. (2013). Cognitive impairment in patients with stress-related exhaustion. Stress, 16, 181–190.
- Karasek, R., & Theorell, T. (1992). Healthy work: Stress, Productivity, and the Reconstruction Of Working Life. Basic books. New York.
- Labour Force Survey. (2016). Retrieved from www.ons.gov.uk:
- Lamontagne, A. D., Keegel, T., Louie, A. M., Ostry, A., & Landsbergis, P. A. (2007). A systematic review of the job-stress intervention evaluation literature, 1990–2005. International Journal of Occupational and Environmental Health, 13, 268–280.
- Leineweber, C., Wege, N., Westerlund, H., Theorell, T., Wahrendorf, M., & Siegrist, J. (2010). How valid is a short measure of effort-reward imbalance at work? A replication study from Sweden. Occupational and Environmental Medicine, 67, 526–531[pii].
- Lisspers, J., Nygren, A., & Söderman, E. (1997). Hospital anxiety and depression scale (HAD): Some psychometric data for a Swedish sample. Acta Psychiatrica Scandinavica, 96, 281–286.
- Maslach, C., Leiter, M., & Schaufeli, W. (2008). Measuring burnout. in Cartwright, S., & Cooper, C. (Eds.), The Oxford Handbook of Organizational Well Being. : Oxford University Press. Retrieved 26 Jan. 2018, from http://www.oxfordhandbooks.com/view/10.1093/oxfordhb/9780199211913.001.0001/oxfordhb-9780199211913.
- Montano, D., Hoven, H., & Siegrist, J. (2014). Effects of organisational-level interventions at work on employees’ health: A systematic review. BMC Public Health, 14, 1–9.
- Naylor, J. C., Pritchard, R. D., & Ilgen, D. R. (1980). A theory of behavior in organisations. New York: Academic Press.
- Nielsen, K., Randall, R., Holten, A.-L., & González, E. R. (2010). Conducting organizational-level occupational health interventions: What works? Work & Stress, 24, 234–259.
- Nieuwenhuijsen, K., Bruinvels, D., & Frings-Dresen, M. (2010). Psychosocial work environment and stress-related disorders, a systematic review. Occupational Medicine, 60, 277–286. kqq081 [pii].
- Norman, M. F. (1971). Statistical inference with dependent observations: Extensions of classical procedures. Journal of Mathematical Psychology, 8, 444–451.
- Peterson, U. (2008). Stress and burnout in healthcare workers. Stockholm: Karolinska institutet.
- Pritchard, R. D., Harrell, M. M., DiazGranados, D., & Guzman, M. J. (2008). The productivity measurement and enhancement system: A meta-analysis. Journal of Applied Psychology, 93, 540–567. 2008-05281-005.
- Pritchard, R. D., Weaver, S. J., & Ashwood, E. L. (2012). Evidence-based productivity improvement: A practical guide to the productivity measurement and enhancement system (ProMES). New York: Routledge.
- Przygodda, M. (1994). Die Förderung der Effektivität in Arbeitsgruppen: Eine Evaluation des Managementsystems PPM (Unpublished doctoral dissertation). Shaker-Verlag, Aachen.
- Richardson, K. M., & Rothstein, H. R. (2008). Effects of occupational stress management intervention programs: A meta-analysis. Journal of Occupational Health Psychology, 13, 69–93.
- Rock, P. L., Roiser, J. P., Riedel, W. J., & Blackwell, A. D. (2014). Cognitive impairment in depression: A systematic review and meta-analysis. Psychological Medicine, 44, 2029–2040.
- Ruotsalainen, J. H., Verbeek, J. H., Mariné, A., & Serra, C. (2014). Preventing occupational stress in healthcare workers (Review). Cochrane Database of Systematic Reviews, 12. doi:10.1002/14651858.CD002892.pub4
- Schrijnemaekers, V. J. J., van Rossum, E., Candel, M. J. J. M., Frederiks, C. M. A., Derix, M. M. A., Sielhorst, H., & van den Brandt, P. A. (2003). Effects of emotion-oriented care on work-related outcomes of professional caregivers in homes for elderly persons. The Journals of Gerontology Series B: Psychological Sciences and Social Sciences, 58, S50–S57.
- Shah, D. (2009). Healthy worker effect phenomenon. Indian Journal of Occupational and Environmental Medicine, 13, 77–79.
- Siegrist, J. (1996). Adverse health effects of high-effort/low-reward conditions. Journal of Occupational Health Psychology, 1, 27–41.
- Siegrist, J. (2013). Psychometric properties of the Effort-Reward Imbalance Questionnaire. Germany: Department of medical sociology, Faculty of Medicine, Dûsseldorf University.
- Siegrist, J., Dragano, N., Nyberg, S. T., Lunau, T., Alfredsson, L., Erbel, R., … Kivimäki, M. (2014). Validating abbreviated measures of effort-reward imbalance at work in European cohort studies: The IPD-Work consortium. International Archives of Occupational and Environmental Health, 87, 249–256.
- Siegrist, J., & Li, J. (2016). Associations of extrinsic and intrinsic components of work stress with health: A systematic review of evidence on the effort-reward imbalance model. International Journal of Environmental Research and Public Health, 13, 432.
- Siegrist, J., Li, J., & Montano, D. (2014). Psychometric properties of the Effort-Reward Imbalance Questionnaire. Germany: Department of medical sociology, Faculty of Medicine, Dûsseldorf University.
- Siegrist, J., Starke, D., Chandola, T., Godin, I., Marmot, M., Niedhammer, I., & Peter, R. (2004). The measurement of effort-reward imbalance at work: European comparisons. Social Science & Medicine, 58, 1483–1499.
- Siltaloppi, M., Kinnunen, U., & Feldt, T. (2009). Recovery experiences as moderators between psychosocial work characteristics and occupational well-being. Work & Stress, 23, 330–348.
- Sonnentag, S., & Fritz, C. (2007). The recovery experience questionnaire: Development and validation of a measure for assessing recuperation and unwinding from work. Journal of Occupational Health Psychology, 12, 204–221.
- Stansfeld, S., & Candy, B. (2006). Psychosocial work environment and mental health–A meta-analytic review. Scandinavian Journal of Work, Environment & Health, 32, 443–462. 1050 [pii].
- Uchiyama, A., Odagiri, Y., Ohya, Y., Takamiya, T., Inoue, S., & Shimomitsu, T. (2013). Effect on mental health of a participatory intervention to improve psychosocial work environment: A cluster randomized controlled trial among nurses. Journal of Occupational Health, 55, 173–183.
- van der Klink, J. J., Blonk, R. W., Schene, A. H., & van Dijk, F. J. (2001). The benefits of interventions for work-related stress. American Journal of Public Health, 91, 270–276.
- Zigmond, A. S., & Snaith, R. P. (1983). The hospital anxiety and depression scale. Acta Psychiatrica Scandinavica, 67, 361–370.