
 ?Mathematical formulae have been encoded as MathML and are displayed in this HTML version using MathJax in order to improve their display. Uncheck the box to turn MathJax off. This feature requires Javascript. Click on a formula to zoom.
ABSTRACT
The present study examines whether video-based situational judgement test (SJT) formats provide benefits over “traditional” text-based SJTs. Focusing on three SJT conditions – two video-based conditions (with and without text), and a text-based condition – we investigated mean differences in applicant reactions and SJT scores, subgroup differences (ethnicity and gender), and relations between SJT scores and applicant reactions. Using a quasi-experimental design, 290 prospective teachers (56.6% female) were randomly assigned to one of the three SJT conditions. SJT scores did not significantly differ between conditions, but both video-based formats were perceived as more engaging than the text-based format. Results from a multigroup path model indicated that there were statistically significant gender effects for the text-based condition (females outperforming males), but not for the two video-based conditions. However, ethnicity effects (members from majority groups outperforming members from minority groups) occurred in all conditions. Differentiated patterns of relations were found between applicant reactions and SJT performance, with engagement statistically significantly predicting SJT performance in the video without text condition. Implications for future research and teacher selection practice are discussed.
1. Introduction
Situational Judgement Tests (SJTs) can be defined as a scenario-based assessment method designed to measure individuals’ judgement in complex and contextualized workplace settings (e.g., Bledow & Frese, Citation2009; Guenole et al., Citation2015; Oostrom et al., Citation2010; Ryan & Ployhart, Citation2014). Considerable empirical evidence on the predictive and incremental validity of SJTs underlines their added value for selection into different professions and study programmes (see e.g., Koczwara et al., Citation2012; Lievens et al., Citation2008; McDaniel et al., Citation2001; Patterson et al., Citation2012). However, while the use of SJTs as a selection method is well-established in organizational psychology, they have just recently been introduced to educational (psychology) research as a tool for the selection into initial teacher education programmes (ITE) (e.g., Klassen et al., Citation2014; Klassen et al., Citation2020). To date, there are still notable gaps in our knowledge and areas in need of more research with regard to SJTs for teacher selection as well as SJTs more generally.
For instance, the rise of technology has played a vital role in personnel selection (e.g., Bruk‐Lee et al., Citation2016) and SJTs relying on multimedia formats have been employed in various settings (e.g., for police applicants, De Meijer et al., Citation2010; for medical school applicants, e.g.; Fröhlich et al., Citation2017; Lievens, Citation2013). Several advantages are put forward in the context of video-based SJTs (see e.g., Pollard & Cooper-Thomas, Citation2015), among those the potential to reduce subgroup differences (e.g., Anderson, Citation2003; Chan & Schmitt, Citation1997), more favourable applicant reactions (e.g., Richman-Hirsch et al., Citation2000), and critically, the opportunity for applicants to judge the interpersonal cues (e.g., facial expressions, body language) that are present in video formats.
The overall aim of the current study is therefore to explore SJT formats (video and text) and their combinations (video with text, video without text) to address the question whether video-based SJTs provide sufficient benefits over more “traditional” text-based SJTs for selection of prospective teachers, and to enhance our understanding of the interplay and relative importance of different SJT features, such as video and text. We report the findings from a quasi-experiment in which prospective teachers were randomly assigned to one of three SJT conditions – two video-based conditions (3D animated video with text and 3D animated video without text), and a text-based condition – as part of selection into an initial teacher education (ITE) programme. In addition to investigating the mean differences in applicant reactions (i.e., perceptions of job relatedness, fairness, effort, engagement, test anxiety) and SJT scores between the three conditions, this study aims to shed light on whether video-based formats might influence subgroup differences in terms of ethnicity and gender. Furthermore, we want to understand the relations between applicant reactions to the three SJT formats and their performance on the SJT. Finally, we aim to link SJT performance in the three conditions to typically collected assessment centre data, such as scores on interviews and group tasks.
1.1. SJTs for teacher selection
Text-based SJTs have recently been introduced in teacher education as a way to assess the non-cognitive attributes of applicants for teacher training programs. Teachers’ non-cognitive attributes cover a range of constructs tapping into, for example, teachers’ motivation and personality. Whereas cognitive abilities (as measured by e.g., college entrance exam tests) seem to be rather weak predictors of teacher effectiveness (e.g., Aloe & Becker, Citation2009; Bardach & Klassen, Citation2020), a number of non-cognitive attributes have been found to be significantly related to teacher effectiveness (e.g., Klassen & Tze, Citation2014; Klassen et al., Citation2018; Kim et al., Citation2019; Kunter et al., Citation2013), underscoring the necessity to include appropriate measures of non-cognitive attributes in teacher selection processes. Nonetheless, researchers and practitioners have struggled with the assessment of non-cognitive (teacher) attributes as they are difficult to measure and, when using classical self-reports, are prone to response biases and faking (e.g., Johnson & Saboe, Citation2011; Klassen & Kim, Citation2017). By contrast, SJTs offer a more indirect and implicit assessment of what applicants deem as appropriate responses (Motowidlo & Beier, Citation2010; Motowidlo et al., Citation2006). While SJTs are still vulnerable to faking, Hooper et al. (Citation2006) concluded that SJT faking effects are smaller than those observed in personality self-report measures.
By adopting selection models based on selection research in other disciplines, a set of text-based SJTs capturing non-cognitive teacher attributes have been developed and are currently in use for teacher selection (see e.g., Klassen & Kim, Citation2017 for an overview, also see e.g., Klassen et al., Citation2014; Klassen et al., Citation2020). The target attributes of the SJTs (adaptability and resilience, organization and planning, empathy and communication, conscientiousness, mindset, and emotion regulation) were developed using both inductive and deductive approaches (e.g., Guenole et al., Citation2017; Schubert et al., Citation2008; Weekley et al., Citation2006; see Klassen et al., Citation2014; Klassen et al., Citation2017, Citation2020 for detailed descriptions of the development process). Previous studies employing these text-based SJTs demonstrated high levels of reliability and strong evidence of concurrent validity with other non-cognitive assessment methods (Klassen et al., Citation2017, Citation2020). Nevertheless, to date, research and development on SJTs for teacher selection has only included text-based formats, in spite of the apparent advantages that video-based formats may offer (see next section for a review).
Relying on a sample of prospective teachers, the present study therefore compares three different formats of SJTs: two video-based SJTs (one with and one without accompanying text) as well as a text-based SJT. This study offers theoretical and practical contributions. From a theoretical perspective, our study establishes a more fine-grained understanding of SJT formats by exploring the promises and pitfalls of video-based SJT formats with varying features (i.e., video with and without text). This is an important extension, as most existing work on video-based SJTs compares video- and text-based formats against (e.g., Chan & Schmitt, Citation1997; MacCann et al., Citation2016). Our study is, to the best of our knowledge, furthermore the first to test potential gender differences in addition to ethnicity differences in research on SJT formats and we investigate a rich set of external linkages in terms of applicant reactions as well as assessment centre tasks. From a practical perspective, we provide information to ITE programs and test developers about whether potential advantages of video SJTs (e.g., positive applicant reactions, reduced ethnicity differences) justify the cost-intensive development of video SJTs.
1.2. Research on video-based SJTs
In recent decades, assessments for personnel selection have become increasingly interactive and media-rich (e.g., Bruk‐Lee et al., Citation2016). As an example of these technological developments, video-based SJTs are nowadays a popular medium for selection and research purposes (e.g., Fröhlich et al., Citation2017; Juster et al., Citation2019). Videos allow for incorporating interpersonal cues (e.g., facial expressions, body language) and interpreting and adequately reacting to interpersonal situations is central in various professions, e.g., for medical doctors, police officers, and teachers. Specifically, the ability to accurately interpret teacher-student interpersonal situations is of fundamental importance in teaching, because teacher-student relationships form the very core of the profession (Wentzel, Citation2016; Wubbels et al., Citation2012). Video-based SJTs can involve live action videos with actors or, as in our study, 3D-animated characters, with some research suggesting favourable applicant reactions to this format (Bruk‐Lee et al., Citation2016). One advantage of the animated format is that developers can easily control the body language and facial expression of characters; for example, by adding non-ambiguous facial expressions to indicate basic emotions.
Given that research on video-based SJTs using animations is scarce, we mainly draw on research using video-SJTs in this section. In addition, as no study in the context of teacher education has investigated video SJTs, we base our hypotheses on existing findings derived in other contexts. We suggest that this approach is appropriate due to the lack of research on why relations, such as the effects of ethnicity on SJT scores, should function differently in samples of (prospective) teachers than in samples from other populations.
1.2.1. Video-based SJTs and subgroup differences
Although SJTs that measure non-cognitive attributes have generally been found to produce fewer subgroup differences than cognitive tests (e.g., Lievens et al., Citation2008; Whetzel & McDaniel, Citation2009), research indicates that members of ethnic majority groups outperform those of minority groups and females typically outperform males on SJTs (e.g., Husbands et al., Citation2015; Lievens et al., Citation2016; see Whetzel et al., Citation2008 for a meta-analysis). Reducing subgroup differences is critical in any selection process, but may be of particular importance for selection of prospective teachers, with a relative paucity of minority group teachers (e.g., Nguyen & Redding, Citation2018) representing an issue of serious and ongoing concern.
Consequently, researchers have sought to gain an understanding of why subgroup differences occur and how they can be reduced. There are numerous approaches to explain ethnicity differences in (selection) tests, but research on SJTs has mainly focused on measurement-related aspects: For example, meta-analytic findings suggest that mean ethnicity differences in SJT scores may be related to the “cognitive loading” of the SJT: the larger the cognitive load (i.e., the association with scores on cognitive ability tests), the larger the mean difference, as cognitive ability tests typically disadvantage ethnic minority group members (Whetzel et al., Citation2008). Crucially, in a study conducted in a high stakes test setting with medical school applicants in which the authors compared a video-based SJT with its text-based counterpart, the video-based version had a lower correlation with scores on a cognitive ability test than the written version (Lievens & Sackett, Citation2006; see also Weekley & Jones, Citation1997). This led the authors to conclude that the written version of an SJT was more heavily “cognitively weighted” than a video-based SJT. Aligned with the findings on the higher “cognitive load” of written vs. video SJTs (e.g., Lievens & Sackett, Citation2006) and the role of “cognitive load” of SJTs in increasing ethnicity differences (Whetzel et al., Citation2008), results from a laboratory experiment revealed that a video-based SJT had a significantly less adverse impact than a text-based (paper and pencil) SJT (Chan & Schmitt, Citation1997). The results of this study indicated that while White applicants scored higher on both the written and the video-based SJT than Black applicants, this gap was substantially reduced for the video-based SJT. In sum, prior research suggests that ethnicity differences may be influenced by the inclusion of video material. In light of existing evidence, we therefore propose that although ethnicity effects might occur in all conditions, they will be larger for the conditions including text.
Hypothesis 1: There will be significant ethnicity differences in SJT scores – with members from majority groups obtaining higher scores than members from minority groups – in all three condition. The effects will be larger in the two conditions with text (video with text, text-based).
With regard to gender differences, Whetzel et al. (Citation2008) concluded that SJT scores favoured females when SJTs were related to the personality traits of conscientiousness and agreeableness. Moderate gender differences favouring females have been found for the text-based SJTs developed for prospective teacher selection (Klassen et al., Citation2020), which might partially be due to the fact that conscientiousness represents one of the target attributes assessed by these SJTs. To the best of our knowledge, no study has yet contrasted gender differences in the scores of various formats of SJTs, and previous studies on video-based SJTs have, like text-based SJTs, revealed a scoring pattern favouring female test-takers (e.g., Juster et al., Citation2019; Lievens, Citation2013). However, it is possible that video formats may increase gender disparity in SJT performance. One robust finding from meta-analyses and literature reviews is that females outperform males in recognizing basic facial emotions (e.g., Kret & de Gelder, Citation2012), a finding supported by gender socialization theories (e.g., Social Role Theory, Eagly, Citation1987) that propose communication differences based on differential gender socialization. The interpersonal cues afforded by video formats over text formats (e.g., the ability to read facial expressions and body language) may lead to an increase in the SJT performance gaps between male and female applicants (e.g., Wingenbach et al., Citation2018). Hence, for our study, we assume gender differences in SJT scores will occur in all conditions but will be accentuated on the video-based formats due to documented sex differences in facial emotion recognition (e.g., Wingenbach et al., Citation2018).
Hypothesis 2: There will be significant gender differences (females scoring higher than males) in all three conditions. The effects will be larger in the two conditions with videos (video with text, video without text).
1.2.2. Video-based SJTs, applicant reactions, SJT performance, and relations to assessment centre tasks
Applicant reactions reflect how applicants perceive and respond to selection tools (such as SJTs) on the basis of their experience of the selection process. These reactions include, for example, perceptions of fairness, job relatedness, and levels of motivation. Robust evidence exists on the effects of applicant reactions on attitudes, intentions, and behaviours, underlining their implications for the design and implementation of selection tests (McCarthy et al., Citation2017; also see e.g., Nikolaou et al., Citation2015).
Importantly, simulations with greater realism, such as video-based SJTs, offer assessments that might be perceived as more job-related to candidates than traditional selection tools, such as strictly text-based assessments. It has been argued that this increased face validity is rooted in the fact that these formats present the information in a way more similar to how it would be experienced in daily (working) life, thus providing a more authentic presentation of information to the applicant (Zenisky & Sireci, Citation2002). More favourable applicant perceptions of face validity have been reported for video-based SJTs than for written SJTs using the same content (Chan & Schmitt, Citation1997; Richman-Hirsch et al., Citation2000; but see Lievens & Sackett, Citation2006, who did not find a significant difference). Furthermore, from a procedural justice perspective, perceptions of the selection process regarding the formal test characteristics, such as particular features of the selection methods themselves, strongly influence applicants’ perceptions of fairness (Patterson et al., Citation2011; see also Gilliland & Steiner, Citation2001). The realism and concreteness inherent in video SJTs, which invites applicants to picture themselves in the situation, might prompt applicants to rate them as fairer than the more abstract text-based SJTs. Aligned with this assumption, it has been shown that SJTs including video components received better scores for perceived fairness (e.g., Kanning et al., Citation2006). Simulation-based assessments relying for instance, on videos have moreover been found to be more engaging, which might be due to the fact that they allow the capture of rich, ambient details of scenarios which are typically lost in text-based versions of the same content, help applicants to visualize the problem or situation they are being asked to evaluate, and include more nuanced and nonverbal cues (Bruk‐Lee et al., Citation2013; Patterson et al., Citation2017; Tuzinski et al., Citation2012). Administering a simulation might also result in increased test motivation, i.e., invested effort (e.g., Gutierrez & Meyer, Citation2013): Videos, as compared to text, can bring the scenario “to life” and might thus be more likely to spark applicants’ interest and willingness to put forth effort. Hence, we hypothesize that the video-component might be key to offering a more enjoyable test experience and that applicants will report more positive reactions with regard to job-relatedness, fairness, engagement, and effort in both conditions including videos than in the text-based condition.
On the other hand, relations to test anxiety have, as far as we know, not yet been subject to empirical investigations in the context of video-based SJTs, meaning that our study is the first to address this issue. At this point, a remark on the measurement of anxiety in this study is warranted: Two items were employed to measure test anxiety, one of them focusing on anxiety in a narrow sense and the other (recoded) item describing feelings of relaxation during the test situation. In addition to the complete lack of research on anxiety and different SJT formats, we acknowledge the ambiguities concerning the measurement of the anxiety construct in our study. Accordingly, we cautiously propose that applicant anxiety may vary by condition, but we do not outline a priori which conditions might differ with regard to anxiety levels.
Hypothesis 3a: Applicants will report significantly higher applicant reaction (job-relatedness, fairness, engagement, and effort) in the two conditions involving videos than in the text-based condition.
Hypothesis 3b: Levels of anxiety will differ significantly between the conditions.
Furthermore, meta-analytic evidence indicates that applicants’ reactions are significantly related to their performance on selection tests (e.g., Hausknecht et al., Citation2004; McCarthy et al., Citation2013; Oostrom et al., Citation2012). While we propose that mean levels of applicant reactions and performance may vary between conditions, we do not see a reason to believe why the relations between the constructs–and thus, the assumed functioning of positive experiences during a test situation contributing to better results in this test–should differ. Instead, we suggest that the link between (more favourable) applicant reactions and (higher) performance should equally pertain to all conditions. We, therefore, hypothesize that more positive applicant reactions in terms of job-relatedness, fairness, engagement, and effort will predict higher SJT performance in all three conditions (e.g., Hausknecht et al., Citation2004). Again, considering the operationalization and measurement of test anxiety in this study, which mixes anxiety with the feeling of simply not being (too) relaxed, we do not specify a direction of effects a priori and simply test whether anxiety significantly predicts SJT performance in the three conditions. While anxiety most likely interferes with test performance (e.g., Von der Embse et al., Citation2018), we argue that a certain level of arousal (i.e., not feeling [too] relaxed) assists applicants to mobilize cognitive resources required to perform well. Hence, theoretically, both directions of effects (positive and negative) seem plausible.
Hypothesis 4a: There will be a significant and positive relation between applicant reactions in terms of job-relatedness, fairness, engagement, and effort and SJT performance in all three conditions.
Hypothesis 4b: There will be a significant relation between anxiety and SJT performance in all three conditions.
In addition to studying applicant reactions to video-based SJTs, researchers have also explored differences in SJT performance for video vs. text-based formats. Chan and Schmitt (Citation1997) showed in their study that SJT performance was significantly higher when the test had been administered in a video-based format rather than in written (paper and pencil) format. In contrast, although Lievens and Sackett (Citation2006) did not test mean differences in video vs. text-based SJT scores for statistical significance, they reported means of virtually the same size, 15.86 (SD = 2.45), for a video condition and 15.68 (SD = 2.46) for a text condition. More research on differences in SJT performance between different formats is clearly needed; however, due to the inconclusive state of current research, we refrain from specifying a priori how mean scores might differ and simply test whether significant differences between SJT conditions can be found.
Hypothesis 5: SJT scores will differ significantly between the conditions.
As a fourth contribution, we examine whether prospective teachers’ SJT scores in the three conditions can be used to predict their assessment centre scores (i.e., interview, group task, and role play). The original text-based SJTs developed for teacher selection have already been found to be related to similar assessment centre components, with associations of small to medium sizes (Klassen et al., Citation2020). While we assume that the SJTs used in this study will produce similar patterns of relations to assessment centre data, we leave it as an open question whether the relations will differ between conditions.
Hypothesis 5: SJT scores in all three conditions will be significantly and positively related to assessment centre tasks.
provides an overview of the relations tested in the current study.
Figure 1. Theoretical model tested in the current study and overview of the three conditions
2. Method
2.1. Sample and procedure
A total of 290 participants (164 female, 123 male, 3 other or not disclosed) completed the SJTs as part of the first stage of selection into a science, technology, engineering, and mathematics-focused (STEM) teacher education program. The mean age of participants was 20.15 years (SD = 0.96). In total, 57.6% of participants identified as White, 28.3% as Asian or Asian British, 5.9% as Black, African, Caribbean, or Black British, 5.2% as multiple ethnic groups, and 3.1% as other ethnic groups.
Applicants were invited to a half-day assessment centre with a teacher education provider based on their application form and academic merit (i.e., predicted undergraduate degree classification and A-level results). As part of the selection criteria, applicants were required to be in their second year of studying a STEM subject at a higher education institution with a predicted grade of 2:1 or above, or to have A-levels in two STEM subjects. Assessment dates took place over 8 days between November 2018 and March 2019. The assessment centre included the SJT, an interview, a group task and discussion, and a role play activity. To save time, the three tasks role play, interview, and group discussion took place in parallel, meaning that the order of the activities could differ between applicants. The SJT was the last task applicants had to work on after finishing the other three tasks. The SJT was not used for decision-making in the admission process as this study served as a pilot study testing the different formats.
For the SJT, each participant was provided with a tablet and headphones to complete a randomized SJT format using an online survey platform. The SJT did not include a time limit so that applicants who might need more time very were not disadvantaged by adding a “speed-component” to the test and was invigilated by a member of the research team or an employee of the teacher education provider. The SJT contained instructions and a consent form advising applicants that their participation was voluntary and that their SJT performance would not affect their assessment centre results. Applicant reactions to the SJT were measured directly after participants had completed the SJT. All stages of the research (i.e., development and administration) were reviewed and approved by the authors’ university ethics review board and by the selection and recruitment team at the teacher education provider. The authors of the current article are not formally affiliated with the teacher education provider in question and were not involved in making selection decisions.
2.2. Measures
2.2.1. SJT
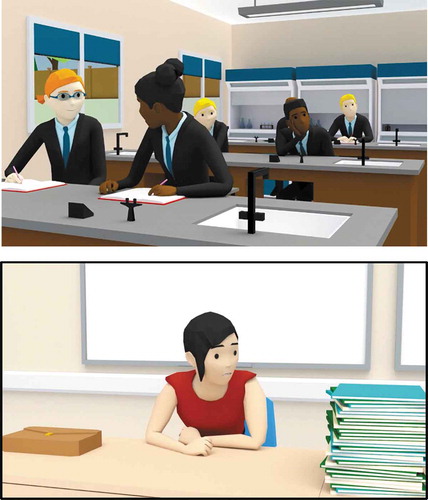
Participants were randomly allocated into one of three SJT format conditions: (a) a video with text-version, (b) a video without text-condition, and (c) a text-based version. The video with text version included 3D characters involved in various school-based activities, while a voice-over simultaneously described the scenario (see for an overview). The animated characters were designed to show basic emotions through facial expressions (e.g., surprise, happiness, anger, sadness, confusion). At the end of the video, a text version of the scenario content presenting exactly the same information as the voice-over appeared on the screen. The video without text version also included videos and the voice-over; however, it did not contain the text description at the end of the video (see for an example image from one of the videos). The text-based version included the scenario text and the voice-over. Hence, the two versions with video shared the video feature, whereas the video with text and the text-based version used the same text description of the scenario. Moreover, there was an audio-component (i.e., the voice-over) included in all three conditions so that applicants with visual or reading difficulties were not disadvantaged. For the text with audio condition, the audio automatically played when the screen loaded. It was possible to pause the audio if applicants wished to do so; however it was highly unlikely that applicants chose to do so as the audio would have already started playing. All versions of the SJT included exactly the same 15 school-based scenarios that had previously been piloted in text format (see Klassen et al., Citation2020) and measured the target attributes of adaptability and resilience, organization and planning, empathy and communication, conscientiousness, mindset, and emotion regulation. Each scenario had four response options and applicants were asked to rate the appropriateness of each of the options, from (1) appropriate to (4) inappropriate, in consideration of what a beginning teacher should do in the circumstances described in the scenario. The response options and the rating of the responses were text-based for all conditions.
Figure 2. Example images from two of the videos used in the situational judgement test
The scoring key for the SJT had been established based upon concordance panels with subject matter experts (SMEs) in the field. A hybrid approach was adopted (see Bergman et al., Citation2006 for details), whereby SMEs developed the initial scoring key which was subsequently adapted based upon level of expert consensus, item difficulty, item-total correlations, and applicant scoring patterns. The scoring was based on the scoring system described by Patterson et al. (Citation2013), where points are allocated based on the extent to which participants’ responses align with the established scoring key. For example, participants were allocated three points if their response was in direct alignment with the scoring key, two points if their answer was one position away, one point if their answer was two positions away, and no points if three positions away. Therefore, there were 12 points available for each scenario (4 response options x 3 maximum points) equating to a total available score of 180 (15 scenarios x 12 maximum points). The reliability coefficients (Cronbach’s α) for the three conditions were αvideo with text (vt) =.75; αvideo (v) = .55; and αaudio with text (at) = .70.
2.2.2. Assessment centre data
Apart from the SJT, the assessment centre included (a) a one-to-one interview assessing candidates’ competencies and motivation for entering the teaching profession (30 minutes), (b) a group discussion exercise and presentation (15 minutes), (c) a one-to-one role play with an assessor (5 minutes) followed by a written self-evaluation task (8 minutes). For the interview, group discussion, and role play, applicants were assessed against three to four competencies (e.g., resilience, problem solving ability). Each competency was scored from 1–10, and the mean score was calculated for each activity. Applicants were required to meet a certain standard (i.e., a certain score, such as 7 out of 10) in at least one of the competencies in order to be made an offer for the ITE program. Reliability coefficients for the interview were α vt = 80; α v = .65; and α at = .81, for the group task αvt = .90; αv = .91; αat = .86, and for the role play αvt = .79; αv = .84; αat = .82.
2.2.3. Ethnicity
Due to the relatively smaller number of non-White participants, we coded White participants as “majority” and all other ethnic groups as “minority” and used these two categories in our analyses.
2.2.4. Applicant reactions
Applicant reactions to the SJT were measured using 14 items, which comprised of five subscales: effort, engagement, test anxiety, fairness, and job relatedness. The measures were adapted from previously tested motivation, emotion, and applicant reaction scales (Bruk‐Lee et al., Citation2016; Frenzel et al., Citation2016; Knekta & Eklöf, Citation2015; Smither et al., Citation1993; see also e.g., R. Klassen et al., Citation2014). The scale assessing effort consisted of two items (sample item: “I did my best on this test”), the scale for engagement included three items (sample item: “It was fun to do this test”), the scale for test anxiety consisted of two items (sample item: “The test made me anxious”), the scale for fairness had three items (sample item: “Overall, I believe the test was fair”), and the scale for job relatedness used four items (sample item: “This test presented realistic scenarios”). Participants were asked to rate each item from (1) strongly disagree to (7) strongly agree. Reliability coefficients ranged from satisfactory to very good for all scales and all conditions (effort: αvt = .76; αv = .69; αat = .66; engagement: αvt = .88 αv = .83 αat = .84; overall α = .85; test anxiety: αvt = .67 αv = .79 αat = .61; fairness: αvt = .87; αv = .84;αat = .90; job relatedness: αvt = .84; αv = .87; αat = .78).
2.3. Statistical analyses
All analyses were performed using Mplus 8.2 (Muthén & Muthén, Citation1998–2010). We conducted a multi-group path model, with all effects estimated separately for the three conditions. As a first step, we tested mean differences regarding SJT scores and applicant reactions between the three groups for significance by using the Mplus MODEL CONSTRAINT command (Green & Thompson, Citation2012). We then modelled the effects of gender, ethnicity, and applicant reactions on SJT scores. Furthermore, we investigated whether applicants’ SJT scores predicted their assessment centre scores; that is, the scores on the role play, the group task, and the interview (see for a graphical representation of the tested path model).
The Bayesian Markov chain Monte Carlo (MCMC) method based on non-informative prior distributions according to the program’s default settings was used to estimate the multigroup-model (see Muthén & Muthén, Citation1998–2010). Bayesian estimation has several advantages over maximum likelihood estimation; for example, Bayes estimation provides more accurate results if parameters are not normally distributed, as it can deal with asymmetric distributions (e.g., Van de Schoot et al., Citation2014). Moreover, it has been shown that Bayesian estimation can outperform maximum likelihood estimation when sample sizes are small (e.g., Lee & Song, Citation2004; Van de Schoot et al., Citation2014). Following recommendations by Hox et al. (Citation2012), convergence was assessed using the Gelman-Rubin criterion with a stricter cut-off value of 0.01 rather than the default setting of 0.05. Eight chains were requested for the Gibbs sampler and a minimum number of 10,000 iterations were specified. Starting values were based on the maximum likelihood estimates of the model parameters. Gelman-Rubin convergence statistics (Gelman & Rubin, Citation1992) were inspected to check for convergence.
Usually, the GROUPING statement in Mplus is used to run multigroup models, but multigroup modelling is currently not available in Mplus in combination with a Bayesian estimator. We, therefore, relied on an alternative approach to specify such a model and used the mixture module in Mplus with three known classes and no latent class. This exactly mimics the results of the multiple group option and is available with a Bayesian estimator (see e.g., Van de Schoot et al., Citation2013). In addition, instead of simply comparing patterns of significant and non-significant findings between conditions, the Mplus MODEL CONSTRAINT command was used to test the difference in regression slopes for all effects (effects of gender, ethnicity, and applicant reactions on SJT scores, effects of SJT scores on assessment centre data) for the video with text vs. the video without text vs. the text-condition for statistical significance.
We report unstandardized and standardized regression coefficients. The standardized regression coefficients can be interpreted according to Cohen’s guidelines (Cohen, Citation1988), with values over .10, .30, and .50 reflecting small, moderate, and large effect sizes, respectively. We conducted all analyses with a statistical significance level of α = .05. Even though it would also be possible to test the hypotheses using Bayesian factors, we decided to test our hypotheses applying a critical alpha level because this is the most commonly applied approach in statistical hypothesis testing. There were no missing data on the item level for the scales assessing applicant reactions, the SJT scores, and the single item asking participants to indicate their ethnicity. However, as three applicants had indicated that they did not want to report their gender or did not identified as males or females, their values on “gender” were coded as missing values. Bayesian estimation was used to deal with the very small amount of missing data (1% missing values on gender). It should be mentioned that we obtained virtually the same results when excluding these participants from the analyses.
3. Results
provides the descriptive statistics (mean, standard deviation, minimum, maximum) for SJT scores, assessment centre data, and applicant reactions separately for the three conditions and displays the descriptive statistics (mean, standard deviation) for the SJT scores and applicant reactions by gender and ethnicity separately for the three conditions. In we report the bivariate correlations between all the variables for the three conditions. As the multigroup model included a set of predictors, we first checked whether the data met the assumption of no multicollinearity. The tests indicated that multicollinearity was not a concern (for the video with text condition: Tolerance ranging between = .350 and .889, VIF ranging between = 1.125 and 2.856, for the video without text condition: Tolerance ranging between = .415 and .964, VIF ranging between = 1.037 and 2.408; for the text-condition: Tolerance ranging between = .372 and .969, VIF ranging between = 1.032 and 2.690).
Table 1. Descriptive statistics among all variables separately for the three conditions
Table 2. Descriptive statistics for SJT and applicant reactions by gender and ethnicity
Table 3. Correlations between SJT, assessment centre scores, and applicant reactions for video with text condition
Table 4. Correlations between SJT, assessment centre scores, and applicant reactions for video without text condition
Table 5. Correlations between SJT, assessment centre scores, and applicant reactions for the text-based condition
The multigroup model converged properly. Below we report the main results (mean differences in SJT scores and applicant reactions; effects of gender and ethnicity, relations between applicant reactions and SJT scores; and relations between SJT scores and assessment centre data) in separate sections.
3.1. Mean differences in SJT scores and applicant reactions
Tests for mean differences in SJT scores indicated no significant difference in mean SJT scores between the three conditions (all ps > .05). Significant mean differences in applicant reactions were found for engagement, with significantly higher mean scores for the video without text-condition than for the text-based condition, p < .05, and for the video with text than for the text-based condition, p < .05. The results indicated no statistically significant mean differences in engagement between the two video conditions, p > .05. For all other applicant reactions, no significant mean differences between any of the conditions occurred (all ps > .05; see for the mean scores of all scales assessing applicant reactions and the SJT mean scores).
3.2. Effects of gender and ethnicity on SJT scores
No significant effect of gender on SJT scores was found for the two conditions involving videos (for the video with text condition: unstandardized = −1.63, p > .05; for the video without text condition, unstandardized
= −0.37, p >.05), while gender significantly predicted SJT performance in the text-based condition (females scoring significantly higher than males, unstandardized
= −2.85, p < .05). The results furthermore indicated significant effects of ethnicity, with members from majority groups showing a significantly higher performance, in all three conditions: −.3.02, p < .05 in the video without text-condition; −.3.41, p < .01 in the video without text-condition, and −.2.61, p < .05 in the text-based condition). However, none of the differences in regression slopes attained statistical significance (all p’s > .05). reports the SJT mean scores by gender and ethnicity separately for the three conditions.
3.3. Relations between applicant reactions and SJT scores
SJT scores were significantly and positively predicted by engagement (unstandardized = 1.42, p < .05) in the video without text-condition, whereas none of the other effects for applicant reactions were statistically significant (unstandardized
ranging between −1.42 and 0.63, all ps > .05). There were no statistically significant effects for the video with text-condition (unstandardized
ranging between 0.35 and 1.22, all ps > .05) and the text-based condition (unstandardized
ranging between −1.87 and 1.10, all ps > .05, see for all effects). For the effect of anxiety predicting SJT performance (two-tailed test), the regression slopes of the video with text and the text-based condition differed significantly (p < .05), with a non-significant positive effect in the first (unstandardized
= 1.22, p > .05) and a non-significant negative effect in the second condition (unstandardized
= −0.87, p > .05). All other effects did not differ significantly between the three conditions (all ps > .05). To provide additional information for interested readers, displays the mean scores of the scales assessing applicant reactions separately by gender and ethnicity separately for the three conditions.
Table 6. Unstandardized and standardized estimates of all effects separately for the three conditions
3.4. Relations between SJT scores and assessment centre data
For the video with text-condition, SJT scores did not significantly predict scores on the assessment centre tasks (unstandardized = 0.03 for the interview, unstandardized
= 0.02, for the group task, unstandardized
= 0.0, for the role play, all ps >.05). In the video without text conditions, SJT scores did not significantly predict interview scores (unstandardized
= 0.01, p < .05); however, SJT scores significantly and positively predicted scores on the group task (unstandardized
= 0.03, p < .05) and scores on the role play (unstandardized
= 0.05, p < .01). The same pattern emerged for the text-based condition, with no significant effect of SJT scores on interview scores (unstandardized
= 0.01, p < .05), but significant and positive effects on group task scores and role play scores (unstandardized
= 0.03, p < .05, and unstandardized
= 0.04, p < .05). Testing differences in regression slopes for statistical significance between conditions did not reveal any statistically significant difference (all ps > .05). displays all unstandardized effects and standardized effects.
4. Discussion
The present study contributes to research on SJTs by investigating whether different formats of SJTs elicit qualitatively different experiences, i.e., applicant reactions, and affect prospective teachers’ performance on the SJTs. Moreover, we studied the effects of gender and ethnicity on SJT performance and explored the link between applicant reactions and SJT test performance. A further aim of our work was to look at the relations between SJT format and assessment centre data. These questions were addressed in a quasi-experiment with prospective teachers randomly assigned to one of the three conditions, providing a reliable context in which to examine different SJT formats.
First, consistent with our hypothesis, we found that the video-based conditions elicited more positive applicant reactions for engagement in the selection process. Our results showed that applicants perceived that video-based SJTs were significantly more engaging than the text-based format. The findings for engagement are in line with prior research reporting that stimulation-based assessments using videos can promote applicants’ feeling of engagement (Tuzinski et al., Citation2012). We, thus, conclude that employing video-SJTs in teacher selection might be a way to offer applicants interesting and pleasant experiences that prompt them to engage with, and enjoy working on, the provided complex classroom situations. On the other hand, strong evidence for the benefits of video-based SJTs in terms of applicant reactions could not be established for its aspects of fairness, job relatedness, test anxiety, and effort (e.g., Kanning et al., Citation2006; Richman-Hirsch et al., Citation2000). Furthermore, overall SJT scores did not differ significantly between conditions, suggesting that the addition of 3D video material may not increase applicants’ performance on SJTs. This finding is in line with the study by Lievens and Sackett (Citation2006), but contradicts the conclusions presented in Chan and Schmitt (Citation1997) work that the presumably more concrete and realistic video-conditions should boost applicants’ performance.
The second key findings of our study relate to differential impacts of format in terms of gender and ethnicity. We had expected gender effects (females > males) in all conditions, with larger effects in the two video-based conditions due to the robust finding that females outperform males in recognizing basic facial emotions. The results demonstrated that females scored higher than males in the text-based, but not in the two video-based conditions where no significant gender effects occurred. A potential explanation could be that the combination of video and audio-component might have been particularly beneficial for male applicants. The voice-over explicitly described emotional features (e.g., “angry parent”, “upset pupil”) that they could also find in the video. This might have allowed to compensate for the lower facial recognition performance of males. Even though the text-based format also included the audio-component, it might be less advantageous to read and hear exactly the same information than hearing it and simultaneously watching a vivid and lively video sequence complementing the heard information. In addition, our study was not designed to answer questions about personality and gender interactions, but it is feasible that video-based SJTs require a different way of processing that is less dependent on personality characteristics, thereby reducing advantages for females arising from “personality load” of SJTs (Whetzel et al., Citation2008). Of course, as other studies on video SJTs find gender bias (e.g., Lievens, Citation2013; MacCann et al., Citation2016), it can be questioned whether the finding here might be specific to our study and sample. Moreover, it has to be mentioned that none of the regression slopes differed significantly. Nonetheless, we suggest that the pattern of significant vs. non-significant gender effects points towards potential practical implications for prospective teacher selection practices. For instance, shortages of male teachers have commonly been observed in areas such as primary education (e.g., OECD, Citation2018). Although the female-male imbalance is not as much of an issue for STEM teachers (e.g., Nguyen & Redding, Citation2018), and although replications in other samples of prospective teachers and different educational contexts are clearly needed, our findings underline the potential usefulness of video-based SJTs including a voice-over component in decreasing gender gaps.
In contrast to the differentiated findings for gender, our study revealed ethnicity bias for all three conditions, with medium to large effects and no significant differences in the regression slopes between the conditions. Hence, our hypotheses building on the promising and widely cited findings of Chan and Schmitt (Citation1997) that video-based conditions would lead to smaller effects of ethnicity on SJT scores had to be rejected. In search for possible explanations, we acknowledge various differences between our work and that of Chan and Schmitt (Citation1997) in terms of the formats (e.g., paper and pencil written format in Chan and Schmitt (Citation1997) vs. computerized formats in all of our conditions). Furthermore, our studies differed in the samples (prospective teachers vs. undergraduate students), the ethnicity categories (Black and White participants in Chan and Schmitt), and the development of the content (Chan and Schmitt developed written SJTs based on existing video-SJTs; the opposite sequence was employed in our study). This makes comparisons between ours and Chan and Schmitt (Citation1997) results difficult and it has to be emphasized that both studies represent isolated findings. We, thus, call for increased research efforts paying attention to SJT formats to gain clarity on whether certain formats may assist in reducing the challenges related to ethnicity differences in SJTs. The cognitive load of SJTs has been discussed as a possible contributor to ethnicity differences, and we used a cognitive load argument to frame our hypotheses; still, we did not test the cognitive loading of our SJT formats. In addition, it might be that the video formats in our study added further irrelevant cues (e.g., Weekley & Jones, Citation1997), making them different from video-based SJT formats in other studies (Chan & Schmitt, Citation1997).
Third, the link between applicant reactions and SJT performance indicated that engagement positively predicted SJT performance in the video without text-condition. As such, while higher mean scores for engagement were found in both video conditions, higher engagement translated into higher performance only in the video-condition without text. We suggest that the additional text in the video-condition with text displayed prior to the rating of the different response options might have added a distraction component diverting applicants’ attention from the task. On the other hand, none of the other effects regarding the link between applicant reactions and SJT scores were significant. With the sole exception of the effect for anxiety predicting SJT performance, none of the differences in regression slopes attained statistical significance. Anxiety was not statistically significantly and positively related to SJT performance in the video with text-condition and not statistically significantly and negatively related to SJT performance in the text-based condition, and these effects differed significantly. Taking a closer look at the measurement of test anxiety and characteristics of the video with text-condition might aid in understanding this finding. In our study we assessed test anxiety using two items, one of them focusing on anxiety in a narrow sense and the other item that was recoded describing feelings of relaxation during the test situation. Anxiety most likely interferes with test performance (e.g., Von der Embse et al., Citation2018). On the other hand, a certain level of activation in that applicants do not feel (too) relaxed might help them to focus on the task at hand, and thus might even be required to perform well. We further suggest that the need for a certain level of arousal might be especially relevant in the video with text-condition, in which applicants had to make sense of the information presented in the video, the voiceover, and the text. In the video without text-condition, the information on the scenario was restricted to the video and the voiceover, and in the text-based condition, to the voiceover and the text.
Fourth, we examined the relations between the SJT scores and applicants’ scores on three assessment centre tasks (i.e., interview, role play, and group task). The results revealed that SJT performance was not significantly related to interview performance. Role play and group task scores were positively associated with SJT scores in the video without text and in the text conditions, but not in the video with text-condition. The potential distraction component added by the additional text in the video with text-condition that we discussed as reason for the lack of a statistically significantly effect of engagement predicting SJT performance in the video with text-condition (see above) might also come into play here. It might be that applicants in the video with text-condition, who were better able or willing to e.g., stay focused and blank out redundant cues, scored higher, meaning that the SJT score did not reflect “pure” SJT performance. This ability or motivational tendency might be less relevant for the role play and group task as well as the other SJT conditions and these differences in the sets of skills and motivations required to perform well could maybe explain the results. All in all, the findings concerning the relations between video- and text-based SJTs extend our knowledge of SJTs for teacher selection as prior research relying on strictly text-based formats yielded mainly (small to medium) positive relations with partially overlapping assessment centre tasks (Klassen et al., Citation2020). However, it should be mentioned that none of the regression slopes differed significantly between conditions. Methodologically, our work, therefore, clearly highlights the value of testing regression slopes for statistical significance instead of merely relying on the interpretation of the pattern of results obtained for different groups or formats for future studies in selection research. Solely paying attention to the size of effects and the statistical significance of paths can be misleading and might hamper research progress and consequently theory-building by producing information that potentially exaggerates differences among groups/formats.
4.1. Limitations and future lines for research
Several possible limitations to the present study are worth noting. One limitation concerns the fact that we discussed the role of cognitive and personality load but did not examine the relations between SJTs and measures of cognitive ability and personality. Thus, it might be useful to directly test these relations in future studies. In addition, while we considered the effects of gender and ethnicity, an exploration of the impact of numerous other individual difference variables and their interaction with SJT presentation formats still lies ahead. We therefore believe that future research would do well to expand the insights gained in our study by considering further individual difference variables ranging from e.g., disability status, socio-economic status, or scholastic achievement to individual differences in motivational patterns, e.g., in how individuals’ approach learning and achievement situations (achievement goals, e.g., Elliot, Citation2005; see also e.g., Bardach, Oczlon, et al., Citation2019; Bardach, Lüftenegger, et al., Citation2019) or their beliefs in their own abilities to succeed in a given task (self-efficacy, e.g., Klassen & Tze, Citation2014). From a methodological perspective, a further limitation relates to the sample size (around 100 applicants in each condition). This did not allow us to conduct latent variable modelling, and, specifically, measurement invariance testing to examine whether the same (latent) construct is being assessed in each condition and in the different subgroups (females vs. males and majority vs. minority). We highly recommend that future studies relying on a larger pool of prospective teachers thoroughly explore these issues. Finally, our study offered important insights into the functioning of video and text-based SJTs. Still, much more can be done in this area and we aim to encourage researchers to explore further design features, e.g., video vs. text-based response options, and their effects.
4.2. Conclusions
The current work used a quasi-experimental design to investigate open questions targeting at and linking three prominent areas of selection research; namely, technological advancements, subgroup differences, and applicant reactions. In conclusion, a key finding of our study is that video-based SJTs might counteract gender-related gaps in SJT performance. Nevertheless, we caution against overstating the benefits of video-based SJTs because of the significant ethnicity effects that were found for all conditions and that need to be addressed in future studies. In addition, prospective teachers rated video-based SJTs as more engaging, whereas other applicant reactions (e.g., perceptions of fairness) did not differ between the three formats. As the first study comparing different SJT formats designed for teacher selection, our work can be seen as an important step towards obtaining a more comprehensive understanding of the role that SJT presentation formats might play in this context and could serve as an inspiration for future studies further unravelling the interplay between SJT formats, gender and ethnicity, and applicant reactions in teacher selection.
Acknowledgments
The authors would like to thank Liz Maxwell and Mark Davies for research support underpinning this work.
Disclosure Statement
No potential conflict of interest was reported by the authors.
Additional information
Funding
References
- Aloe, A. M., & Becker, B. J. (2009). Teacher verbal ability and school outcomes: Where is the evidence? Educational Researcher, 38(8), 612–624. https://doi.org/10.3102/0013189X09353939
- Anderson, N. (2003). Applicant and recruiter reactions to new technology in selection: A critical review and agenda for future research. International Journal of Selection and Assessment, 11(2–3), 121–136. https://doi.org/10.1111/ijsa.2003.11.issue-2-3
- Bardach, L., & Klassen, R. M. (2020). Smart teachers, successful students? A systematic review of the literature on teachers’ cognitive abilities and teacher effectiveness. Educational Research Review, 30, 100312. Advance Online Publication. https://doi.org/10.1016/j.edurev.2020.100312
- Bardach, L., Lüftenegger, M., Yanagida, T., Spiel, C., & Schober, B. (2019). Achievement or agreement - Which comes first? Clarifying the temporal ordering of achievement and within-class consensus on classroom goal structures. Learning and Instruction, 61, 72–83. https://doi.org/10.1016/j.learninstruc.2019.01.003
- Bardach, L., Oczlon, S., Pietschnig, J., & Lüftenegger, M. (2019). Has achievement goal theory been right? A meta-analysis of the relation between goal structures and personal achievement goals. Journal of Educational Psychology. Advance Online Publication. https://doi.org/10.1037/edu0000419
- Bergman, M. E., Drasgow, F., Donovan, M. A., Henning, J. B., & Juraska, S. E. (2006). Scoring situational judgment tests: Once you get the data, your troubles begin. International Journal of Selection and Assessment, 14(3), 223–235. https://doi.org/10.1111/j.1468-2389.2006.00345.x
- Bledow, R., & Frese, M. (2009). A situational judgment test of personal initiative and its relationship to performance. Personnel Psychology, 62(2), 229–258. https://doi.org/10.1111/j.1744-6570.2009.01137.x
- Bruk‐Lee, V., Drew, E. N., & Hawkes, B. (2013). Candidate reactions to simulations and media-rich assessments in personnel selection. In M. Fetzer & K. Tuzinski (Eds.), Simulations for personnel selection (pp. 43–60). Springer.
- Bruk‐Lee, V., Lanz, J., Drew, E. N., Coughlin, C., Levine, P., Tuzinski, K., & Wrenn, K. (2016). Examining applicant reactions to different media types in character‐based simulations for employee selection. International Journal of Selection and Assessment, 24(1), 77–91. https://doi.org/10.1111/ijsa.2016.24.issue-1
- Chan, D., & Schmitt, N. (1997). Video-based versus paper-and-pencil method of assessment in situational judgment tests: Subgroup differences in test performance and face validity perceptions. Journal of Applied Psychology, 82(1), 143–159. https://doi.org/10.1037/0021-9010.82.1.143
- Cohen, J. (1988). Statistical power analysis for the behavioral sciences (2nd ed.). Erlbaum.
- De Meijer, L. A., Born, M. P., van Zielst, J., & van der Molen, H. T. (2010). Construct-driven development of a video-based situational judgment test for integrity. European Psychologist, 15(3), 229–236. https://doi.org/10.1027/1016-9040/a000027
- Eagly, A. H. (1987). Sex differences in social behavior: A social-role interpretation. Erlbaum.
- Elliot, A. J. (2005). A conceptual history of the achievement goal construct. In A. J. Elliot & C. S. Dweck (Eds.), Handbook of competence and motivation (pp. 52–72). Guilford Press.
- Frenzel, A. C., Pekrun, R., Goetz, T., Daniels, L. M., Durksen, T. L., Becker-Kurz, B., & Klassen, R. M. (2016). Measuring teachers’ enjoyment, anger, and anxiety: The Teacher Emotions Scales (TES). Contemporary Educational Psychology, 46, 148–163. https://doi.org/10.1016/j.cedpsych.2016.05.003
- Fröhlich, M., Kahmann, J., & Kadmon, M. (2017). Development and psychometric examination of a German video‐based situational judgment test for social competencies in medical school applicants. International Journal of Selection and Assessment, 25(1), 94–110. https://doi.org/10.1111/ijsa.12163
- Gelman, A., & Rubin, D. B. (1992). Inference from iterative simulation using multiple sequences. Statistical Science, 7(4), 457–472. https://doi.org/10.1214/ss/1177011136
- Gilliland, S., & Steiner, D. (2001). Causes and consequences of applicant perceptions of unfairness. In R. Cropanzano (Ed.), Justice in the workplace: From theory to practice (Vol. 2, pp. 175–196). Lawrence Erlbaum Associates, Publishers.
- Green, S. B., & Thompson, M. S. (2012). A flexible structural equation modeling approach for analyzing means. In R. H. Hoyle (Ed.), Handbook of structural equation modeling (pp. 393–416). Guilford Press.
- Guenole, N., Chernyshenko, O., Stark, S., & Drasgow, F. (2015). Are predictions based on situational judgement tests precise enough for feedback in leadership development? European Journal of Work and Organizational Psychology, 24(3), 433–443. https://doi.org/10.1080/1359432X.2014.926890
- Guenole, N., Chernyshenko, O. S., & Weekly, J. (2017). On designing construct driven situational judgment tests: Some preliminary recommendations. International Journal of Testing, 17(3), 234–252. https://doi.org/10.1080/15305058.2017.1297817
- Gutierrez, S., & Meyer, J. (2013). Managerial Simulations. In M. Fetzer & K. Tuzinski (Eds.), Simulations for personnel selection (pp. 215–230). Springer.
- Hausknecht, J. P., Day, D. V., & Thomas, S. C. (2004). Applicant reactions to selection procedures: An updated model and meta‐analysis. Personnel Psychology, 57(3), 639–683. https://doi.org/10.1111/j.1744-6570.2004.00003.x
- Hooper, A. C., Cullen, M. J., & Sackett, P. R. (2006). Operational threats to the use of SJTs: Faking, coaching, and retesting issues. In J. A. Weekley & R. E. Ployhart (Eds.), Situational judgment tests: Theory, measurement, and application (pp. 205–232). Lawrence Erlbaum.
- Hox, J. J., van de Schoot, R., & Matthijsse, S. (2012). How few countries will do? Comparative survey analysis from a Bayesian perspective. Survey Research Methods, 6(2), 87–93. https://doi.org/10.18148/srm/2012.v6i2.5033
- Husbands, A., Rodgerson, M. J., Dowell, J., & Patterson, F. (2015). Evaluating the validity of an integrity-based situational judgement test for medical school admissions. BMC Medical Education, 15(144), 1–9. https://doi.org/10.1186/s12909-015-0424-0
- Johnson, R., & Saboe, K. (2011). Measuring implicit traits in organizational research: Development of an indirect measure of employee implicit self-concept. Organizational Research Methods, 14(3), 530–547. https://doi.org/10.1177/1094428110363617
- Juster, F. R., Baum, R. C., Zou, C., Risucci, D., Ly, A., Reiter, H., Miller, D. D., & Dore, K. L. (2019). Addressing the diversity-validity dilemma using situational judgment tests. Academic Medicine: Journal of the Association of American Medical Colleges, 94(8), 1197–1203. Advance online publication. https://journals.lww.com/academicmedicine/Abstract/publishahead/Addressing_the_Diversity_Validity_Dilemma_Using.97608.aspx
- Kanning, U. P., Grewe, K., Hollenberg, S., & Hadouch, M. (2006). From the subjects’ point of view: Reactions to different types of situational judgment items. European Journal of Psychological Assessment, 22(3), 168–176. https://doi.org/10.1027/1015-5759.22.3.168
- Kim, L., Jörg, V., & Klassen, R. M. (2019). A meta-analysis of the effects of teacher personality on teacher effectiveness and burnout. Educational Psychology Review, 31(1), 163–195. https://doi.org/10.1007/s10648-018-9458-2
- Klassen, R., Durksen, T., Rowett, E., & Patterson, F. (2014). Applicant reactions to a situational judgment test used for selection into initial teacher training. International Journal of Educational Psychology, 3(2), 104–124. http://dx.doi.org/10.4471/ijep.2014.07
- Klassen, R., & Tze, V. M. C. (2014). Teachers’ self-efficacy, personality, and teaching effectiveness: A meta-analysis. Educational Research Review, 12, 59–76. https://doi.org/10.1016/j.edurev.2014.06.001
- Klassen, R. M., Durksen, T., Kim, L., Patterson, F., Rowett, E., Warwick, J., Warwick P., & Wolpert, M. A. (2017). Developing a proof-of-concept selection test for entry into primary teacher education programs. International Journal of Assessment Tools in Education, 4(2), 96–114. https://doi.org/10.21449/ijate.275772
- Klassen, R. M., Durksen, T. L., Al Hashmi, W., Kim, L. E., Longden, K., Metsäpelto, R. L., Poikkeus, A.-M., & Györi, J. G. (2018). National context and teacher characteristics: Exploring the critical non-cognitive attributes of novice teachers in four countries. Teaching and Teacher Education, 72, 64–74. https://doi.org10.1016/j.tate.2018.03.001
- Klassen, R. M., & Kim, L. E. (2017). Assessing critical attributes of prospective teachers: Implications for selection into initial teacher education programs. In D. W. Putwain, & K. Smart (Eds.), British Journal of Educational Psychology Monograph Series II: Psychological Aspects of Education (pp. 5–22). Oxford: Wiley.
- Klassen, R. M., Kim, L. E., Rushby, J., & Bardach, L. (2020). Can we improve how we screen applicants for initial teacher education? Teaching and Teacher Education, 87, 102949. Advance Online Publication. https://doi.org/10.1016/j.tate.2019.102949
- Knekta, E., & Eklöf, H. (2015). Modeling the test-taking motivation construct through investigation of psychometric properties of an expectancy-value-based questionnaire. Journal of Psychoeducational Assessment, 33(7), 662–673. https://doi.org/10.1177/0734282914551956
- Koczwara, A., Patterson, F., Zibarras, L., Kerrin, M., Irish, B., & Wilkinson, M. (2012). Evaluating cognitive ability, knowledge tests and situational judgement tests for postgraduate selection. Medical Education, 46(4), 399–408. https://doi.org/10.1111/j.1365-2923.2011.04195.x
- Kret, M. E., & de Gelder, B. (2012). A review on sex differences in processing emotional signals. Neuropsychologia, 50(7), 1211–1221. https://doi.org/10.1016/j.neuropsychologia.2011.12.022
- Kunter, M., Kleickmann, T., Klusmann, U., & Richter, D. (2013). The development of teachers’ professional competence. In M. Kunter, J. Baumert, W. Blum, U. Klusmann, S. Krauss, & M. Neubrand (Eds.), Cognitive activation in the mathematics classroom and professional competence of teachers (pp. 63–77). Springer.
- Lee, S., & Song, X. (2004). Evaluation of the bayesian and maximum likelihood approaches in analyzing structural equation models with small sample sizes. Multivariate Behavioral Research, 39(4), 653–686. https://doi.org/10.1207/s15327906mbr3904_4
- Lievens, F. (2013). Adjusting medical school admission: Assessing interpersonal skills using situational judgement tests. Medical Education, 47(2), 182–189. https://doi.org/10.1111/medu.12089
- Lievens, F., Patterson, F., Corstjens, J., Martin, S., & Nicholson, S. (2016). Widening access in selection using situational judgement tests: Evidence from the UKCAT. Medical Education, 50(6), 624–636. https://doi.org/10.1111/medu.13060
- Lievens, F., Peeters, H., & Schollaert, E. (2008). Situational judgment tests: A review of recent research. Personnel Review, 37(4), 426–441. https://doi.org/10.1108/00483480810877598
- Lievens, F., & Sackett, P. R. (2006). Video-based versus written situational judgment tests: A comparison in terms of predictive validity. Journal of Applied Psychology, 91(5), 1181. https://doi.org/10.1037/0021-9010.91.5.1181
- MacCann, C., Lievens, F., Libbrecht, N., & Roberts, R. D. (2016). Differences between multimedia and text-based assessments of emotion management: An exploration with the multimedia emotion management assessment (MEMA). Cognition and Emotion, 30(7), 1317–1331. https://doi.org/10.1080/02699931.2015.1061482
- McCarthy, J., Bauer, T., Truxillo, D., Anderson, N., Costa, A., & Ahmed, S. (2017). Applicant perspectives during selection: A review addressing “so what?,” “what’s new?,” and “where to next?” Journal of Management, 43(6), 1693–1725. https://doi.org/10.1177/0149206316681846
- McCarthy, J., Van Iddekinge, C., Lievens, F., Kung, M., Sinar, E., & Campion, M. (2013). Do candidate reactions relate to job performance or affect criterion-related validity? A multistudy investigation of relations among reactions, selection test scores, and job performance. Journal of Applied Psychology, 98(5), 701–719. https://doi.org/10.1037/a0034089
- McDaniel, M. A., Morgeson, F. P., Finnegan, E. B., Campion, M. A., & Braverman, E. P. (2001). Use of situational judgment tests to predict job performance: A clarification of the literature. Journal of Applied Psychology, 86(4), 730–740. https://doi.org/10.1037/0021-9010.86.4.730
- Motowidlo, S. J., & Beier, M. E. (2010). Differentiating specific job knowledge from implicit trait policies in procedural knowledge measured by a situational judgment test. Journal of Applied Psychology, 95(2), 321. https://doi.org/10.1037/a0017975
- Motowidlo, S. J., Hooper, A. C., & Jackson, H. L. (2006). Implicit policies about relations between personality traits and behavioral effectiveness in situational judgment items. Journal of Applied Psychology, 91(4), 749–761. https://doi.org/10.1037/0021-9010.91.4.749
- Muthén, L. K., & Muthén, B. O. (1998–2010). Mplus user’s guide (6th ed.). Muthén & Muthén.
- Nguyen, T. D., & Redding, C. (2018). Changes in the demographics, qualifications, and turnover of American STEM teachers, 1988–2012. AERA Open, 4(3), 1–13. https://doi.org/10.1177/2332858418802790
- Nikolaou, I., Bauer, T. N., & Truxillo, D. M. (2015). Applicant reactions to selection methods: An overview of recent research and suggestions for the future. In I. Nikolaou & J. K. Oostrom (Eds.), Current issues in work and organizational psychology. Employee recruitment, selection, and assessment: Contemporary issues for theory and practice (pp. 80–96). Routledge/Taylor & Francis Group.
- OECD. (2018). Education at a glance 2018: OECD indicators. http://dx.doi.org/10.1787/eag-2018-en
- Oostrom, J. K., Born, M. P., Serlie, A. W., & van der Molen, H. T. (2010). Webcam testing: Validation of an innovative open-ended multimedia test. European Journal of Work and Organizational Psychology, 19(5), 532–550. https://doi.org/10.1080/13594320903000005
- Oostrom, J. K., Bos-Broekema, L., Serlie, A. W., Born, M. P., & van der Molen, H. T. (2012). A field study of pretest and posttest reactions to a paper-and-pencil and a computerized in-basket exercise. Human Performance, 25(2), 95–113. https://doi.org/10.1080/08959285.2012.658928
- Patterson, F., Ashworth, V., & Good, D. (2013). Situational judgement tests: A guide for applicants to the UK Foundation Programme. 2nd ed. London, UK: Work Psychology Group.
- Patterson, F., Ashworth, V., Zibarras, L., Coan, P., Kerrin, M., & O’neill, P. (2012). Evaluations of situational judgement tests to assess non‐academic attributes in selection. Medical Education, 46(9), 850–868. https://doi.org/10.1111/j.1365-2923.2012.04336.x
- Patterson, F., Cousans, F., Edwards, H., Rosselli, A., Nicholson, S., & Wright, B. (2017). The predictive validity of a text-based situational judgment test in undergraduate medical and dental school admissions. Academic Medicine, 92(9), 1250–1253. https://doi.org/10.1097/ACM.0000000000001630
- Patterson, F., Zibarras, L., Carr, V., Irish, B., & Gregory, S. (2011). Evaluating candidate reactions to selection practices using organisational justice theory. Medical Education, 45(3), 289–297. https://doi.org/10.1111/j.1365-2923.2010.03808.x
- Pollard, S., & Cooper-Thomas, H. D. (2015). Best practice recommendations for situational judgment tests. The Australasian Journal of Organisational Psychology, 8, E7. https://doi.org/10/1017/orp.2015.6
- Richman-Hirsch, W., Olson-Buchanan, J., & Drasgow, F. (2000). Examining the impact of administration medium on examinee perceptions and attitudes. Journal of Applied Psychology, 85(6), 880–887. https://doi.org/10.1037/0021-9010.85.6.880
- Ryan, A. M., & Ployhart, R. E. (2014). A century of selection. Annual Review of Psychology, 65(1), 693–717. https://doi.org/10.1146/annurev-psych-010213-115134
- Schubert, S., Ortwein, H., Dumitsch, A., Schwantes, U., Wilhelm, O., Kiessling, C., Schubert, S., Ortwein, H., Dumitsch, A., Schwantes, U., Wilhelm, O., & Kiessling, C. (2008). A situational judgement test of professional behaviour: Development and validation. Medical Teacher, 30(5), 528–533. https://doi.org/10.1080/01421590801952994
- Smither, J. W., Reilly, R. R., Millsap, R. E., Pearlman, K., & Stoffey, R. W. (1993). Applicant reactions to selection procedures. Personnel Psychology, 46(1), 49–76. https://doi.org/10.1111/j.1744-6570.1993.tb00867.x
- Tuzinski, K., Drew, E. N., Bruk-Lee, V., & Fetzer, M. (2012). Applicant perceptions of multimedia situational judgment tests [Paper presentation]. Annual meeting of the Society for Industrial and Organizational Psychology, San Diego, CA.
- Van de Schoot, R., Kaplan, D., Denissen, J., Asendorpf, J. B., Neyer, F. J., & van Aken, M. A. G. (2014). A gentle introduction to Bayesian analysis: Applications to developmental research. Child Development, 85(3), 842–860. https://doi.org/10.1111/cdev.12169
- Van de Schoot, R., Verhoeven, M., & Hoijtink, H. (2013). Bayesian evaluation of informative hypotheses in SEM using Mplus: A black bear story. European Journal of Developmental Psychology, 10(1), 81–98. https://doi.org/10.1080.17405629.2012.732719
- Von der Embse, N., Jester, D., Roy, D., & Post, J. (2018). Test anxiety effects, predictors, and correlates: A 30-year meta-analytic review. Journal of Affective Disorders, 227, 483–493. https://doi.org/10.1016/j.jad.2017.11.048
- Weekley, J. A., Ployhart, R. E., & Holtz, B. C. (2006). On the development of situational judgment tests: Issues in item development, scaling, and scoring. In J. A. Weekley & R. E. Ployhart (Eds.), Situational judgment tests: Theory, measurement, and application (pp. 157–182). Lawrence Erlbaum Associates Publishers.
- Weekley, J. A., & Jones, C. (1997). Video‐based situational testing. Personnel Psychology, 50(1), 25–49. https://doi.org/10.1111/j.1744-6570.1997.tb00899.x
- Wentzel, K. R. (2016). Teacher-student relationships. In K. R. Wentzel & D. B. Miele (Eds.), Handbook of motivation at school (2nd ed., pp. 211–229). Routledge.
- Whetzel, D. L., & McDaniel, M. A. (2009). Situational judgment tests: An overview of current research. Human Resource Management Review, 19(3), 188–202. https://doi.org/10.1016/j.hrmr.2009.03.007
- Whetzel, D. L., McDaniel, M. A., & Nguyen, N. T. (2008). Subgroup differences in situational judgment test performance: A meta-analysis. Human Performance, 21(3), 291–309. https://doi.org/10.1080/08959280802137820
- Wingenbach, T. S. H., Ashwin, C., & Brosnan, M. (2018). Sex differences in facial emotion recognition across carrying expression intensity levels from videos. PLoS One, 13(1), e0190634. https://doi.org/10.1371/journal.pone.0190634
- Wubbels, T., den Brok, P., van Tartwijk, J., & Levy, J. (2012). Interpersonal relationships in education: An overview of contemporary research. Sense Publishers.
- Zenisky, A. L., & Sireci, S. G. (2002). Technological innovations in large-scale assessment. Applied Measurement in Education, 15(4), 337–362. https://doi.org/10.1207/S15324818AME1504_02