
ABSTRACT
Widening participation in higher education for under-represented groups is a priority internationally. In Australia, the most common entry pathway for domestic undergraduate students is by obtaining an Australian Tertiary Admission Rank (ATAR) in the final year of secondary school. The ATAR system, however, has been criticised as disadvantaging certain equity groups. Consequently, widening participation policy has encouraged alternative entry pathways into university, including enabling/bridging courses, vocational education qualifications, or portfolio entry based on demonstrated skills and experience. There is, however, relatively scarce evidence of student use of these pathways, including those from equity groups. Drawing on national enrolment data and institution-specific pathway data for 16 Australian universities, this study’s examination of admission data found increasing use of alternative pathways among most student equity groups, with variations by discipline. The findings inform stakeholder understanding of the relative success of alternative entry pathways in widening participation, informing strategies for improvement and future policy.
Introduction
Policies to increase underrepresented groups’ participation in higher education have emerged across developed countries in recent years. Australia is no exception with successive governments adjusting higher education systems and funding mechanisms to promote greater equity and access, particularly among six equity student groups (Australian Government, Citation1990). This focus continues with equity, participation and democracy prominently featured in the Government’s Accord Panel review (Australian Government, Citation2023) which considers challenges for the sector and redesigns it to meet future national needs. In Australia, underrepresented students, including those from regional and remote areas, who identify as Indigenous, are of low socioeconomic status (SES), have disability, are from non-English-speaking backgrounds (NESB), or are women from non-traditional areas of study, including Science, Technology, Engineering, and Mathematics (STEM; Dawkins Citation1990). A further underrepresented group is mature-age students (Heagney & Benson, Citation2017), included as an equity group in this study.
Examples of widening participation policy include the shift from capped to demand-driven funding in 2012 to improve access for all students (Cunninghame et al., Citation2016) and the introduction of performance-based funding where university funding became partially contingent on participation by certain equity groups (Australian Government, Citation2019b). Such policies encourage all students to garner the benefits of higher education, such as skill development for labour market success (Productivity Commission, Citation2019), and intend to advance national economies through increased productivity, growth, and innovation (Organisation for Economic Co-operation and Development [OECD], Citation2016).
The push for widening participation has also led to policy that encourages alternative entry pathways into universities (Martin, Citation2015). The most common pathway for domestic, Bachelor (undergraduate) student entry in Australian universities is by obtaining an Australian Tertiary Admission Rank (ATAR). Students who complete ATAR subjects in their final year of secondary schooling are provided with a percentile rank up to 99.95 in 0.05 increments, comparing them with others also completing school that year (Higher Education Standards Panel, Citation2016). The system has attracted significant criticism with assertions that it fails to prepare students for future work and can disadvantage certain equity groups (O’Connell et al., Citation2019; Productivity Commission, Citation2019). This has encouraged alternative entry pathways and increasing numbers of students accessing higher education through non-secondary education routes (Tertiary Education Quality and Standards Agency [TEQSA], Citation2019). These include completing a university preparation/bridging course; using achieved vocational education and training (VET) qualifications, or portfolio-entry based on demonstrated skills, knowledge, and work and life experience.
Policy has resulted in some progress towards greater access and participation in higher education among equity groups. For example, Koshy (Citation2019) reported a 20% growth in domestic student enrolments from low-SES students between 2013 and 2018 at Australian universities; by 50% for those with disability; and 42% for Indigenous students, compared with an overall growth in domestic student enrolments of almost 13% over the same period. However, Koshy has observed only very modest growth in equity student enrolments since 2016 and students from disadvantaged backgrounds remain underrepresented in higher education, reflecting global trends (Salmi & D’Addio, Citation2021). Access and participation therefore remain a priority for higher education policy (Harvey et al., Citation2016).
Despite more diverse ways of entering higher education, there lacks analysis of university admission trends, and by equity groups. Further insights will help stakeholders understand how different pathways are being utilised, by which groups, and identify opportunities to enhance equity group participation in higher education. This study aimed to fill this gap by posing the following research questions. First, what are the proportions of students who enter undergraduate study through secondary education and alternative admission pathways in Australian universities? Second, what are the proportions, numbers and trends over time of students by equity group status who access university education through secondary education and alternative admission pathways, and in different fields of education? We addressed these questions using national higher education enrolment data and institution-specific pathway data for 16 Australian universities.
Background
Widening participation in higher education
There are many contributing factors to the underrepresentation of certain student groups in higher education. Policymakers have classified initiatives to widen participation into five ‘A’ categories which recognise the diverse experiences and constraints of different groups. These are awareness (understanding available opportunities), aspiration (motivation to participate in higher education), affordability, achievement (meeting education attainment entry thresholds) and access (Pitman et al., Citation2016).
Cardak et al. (Citation2022) assert that a primary contributing factor to not attending university is high school achievement, advocating that ‘educational interventions need to take a longer-term view and consider student high school achievement and preparedness for university study when
seeking to widen participation by disadvantaged students’ (p. 2). Indeed, equity students that experience educational disadvantage, such as low SES, regional and Indigenous students, often perform less well at school (e.g., Cardak et al., Citation2017) which may inhibit their achievement of a requisite ATAR for university entry. Students who are disadvantaged economically, those with disability and from NESB, may have relatively weakly developed cultural and social capital which could find them less able to understand and connect with higher education processes and culture and impact on their sense of belonging (Harvey et al., Citation2018; Vaccaro et al., Citation2015). This, and their lack of access to networks and relationships that can role-model and support their access to higher education, can negatively impact on their aspirations to attend and their ability and confidence in deciphering different pathways and navigating increasingly complex application and admission processes (Cardak et al., Citation2015; Gale et al., Citation2013).
Geography can pose additional cultural tensions, making it difficult for some remote/regional students to leave their close communities and relocate for study (O’Shea, Citation2019). A further challenge is the little, or poor, career advice and information that equity students are given on post-secondary school pathways, particularly those of low SES (Krause et al., Citation2009). Parents, known to be career influencers (Sattler, Citation2021), who are less educated or affluent, may have less positive attitudes towards education (Tsoi, Citation2015) and may discourage their children from applying for higher education due to perceptions that they are less likely to succeed (Cunninghame et al., Citation2016). Alternative admission pathways into STEM courses, such as access schemes and higher education course transfer, could support the relative lack of females and leaky talent pipeline into STEM professions (Blackburn, Citation2017). Interventions at secondary school are important with female students reportedly less confident in mathematics and science and having less affiliation with these subjects due to socialisation and gender stereotyping (see Edwards et al., Citation2023).
Importantly, while access schemes and adjustments to ATAR thresholds can effectively lower entry standards to correct disadvantage among underrepresented students, universities must ensure they are adequately prepared for university study. This is critical given evidence that performance and success at university is closely linked to the achieved ATAR (see Diamond & O’Brien-Malone, Citation2018).
Labour market demands, changing community attitudes, government policy and the motivations of underrepresented students themselves are key drivers for widening participation in higher education (see Diamond & O’Brien-Malone, Citation2018). As well as the economic benefits from a skilled workforce, equitable access allows more to harness the significant benefits associated with completing higher education study. These include better career outcomes, enhanced wellbeing and greater engagement with lifelong learning and personal development (Lamb & Huo, Citation2017). Participation has long been recognised as providing labour market advantage, affirmed by superior full-time employment outcomes among higher education compared with VET graduates or school leavers who transition directly to work (OECD, Citation2019). Career benefits are important for graduating students, and for universities whose comparative graduate outcomes are intensely scrutinised in Australia (for example, Good Education Group, Citation2020).
With respect to improving access to higher education, an early government policy measure was the abolition of fees in 1974. This, however, was not accompanied by changes to university admission criteria and did not result in a proportionate rise of low SES students (Martin, Citation2016). This policy was later replaced by the Higher Education Contribution Scheme following significant reforms in the sector due to the fiscal burden of growing student demand (Dawkins, Citation1990).
A significant policy change in 2012 was the shift from a capped enrolment system to demand-driven funding whereby public Australian universities could enrol an unlimited number of Australian domestic students into funded undergraduate places. The intent was to increase youth participation in higher education to meet national skill demands, as well as improve access for underrepresented students, particularly those of low SES (Cardak et al., Citation2022). Potential strategies for universities to grow their enrolments included lowering their ATAR thresholds and/or supporting more students through alternative admission pathways. Capped public expenditure on higher education was reimposed in 2018 and higher education institutions’ funding later became partially contingent on their graduate employment outcomes, participation by certain equity groups, student experience (satisfaction), and student success (attrition) (Australian Government, Citation2019).
Although this paper is focused on alternative admission pathways into higher education, it is important to acknowledge the other measures intended to address the five ‘As’ and widen participation. These include scholarships, regional study hubs and the Higher Education Participation and Partnerships Program which funds strategies to improve equity students’ access to and retention in undergraduate study (ACIL Allen Consulting, Citation2017). Initiatives within secondary schools include facilitating talks from university/VET providers, engaging students in career discussions to encourage low-SES and regional/remote students to enter higher education (Tomaszewski et al., Citation2017), and community outreach programs, such as targeting non-English speakers and low-SES prospective students in remote communities (Scull & Cuthill, Citation2010).
Pathways into higher education
Entry via secondary education
The secondary education system in Australia, known as ATAR, enables universities to differentiate among highly academically able secondary school leavers wishing to enter higher education (O’Connell et al., Citation2019). Minimum ATAR requirements vary across universities and courses (Palmer et al., Citation2011), a lower-threshold often 70 and rising to high 90s for courses with limited places and strong demand (e.g., Medicine). Government data show that in 2018, 26% of undergraduate offers were for students with an ATAR above 70 (Australian Government, Citation2021), a rank deemed to measure success at university (Knipe, Citation2013; see Pilcher & Torii, Citation2018). In 2017, the ATAR pathway accounted for 46% of domestic undergraduate admissions into higher education and, although falling from earlier years, was the most common entry pathway (TEQSA, Citation2019).
The ATAR system has attracted significant criticism in recent years, reducing students’ capabilities and achievements into a single score (Pitman et al., Citation2015), creating stress among students, and discouraging skill development beyond the curriculum (Shergold et al., Citation2020). Some have questioned its predictive capability for gauging students’ potential success at university, particularly for students in middle bands (for example, Palmer et al., Citation2011) and have suggested it may not prepare young people for work, focusing on assessment tasks rather than developing required, future-oriented capabilities such as resilience, flexibility and creativity (Lucas & Hanson, Citation2016; Torii & O’Connell, Citation2017). Further, the system’s complex university application processes and its disadvantages of those experiencing hardship at school do not support equity groups and can perpetuate existing social inequalities in education (Cardak & Ryan, Citation2009; Cardak et al., Citation2015). Some, however, highlight the value of ATAR for accurately predicting future academic performance (e.g., Knipe, Citation2013; Willis & Joschko, Citation2012) with students achieving lower ATAR scores more likely to fail in their first year of study (Anderton et al., Citation2016; Baik et al., Citation2019) and more likely to drop out of university (Norton & Cherastidtham, Citation2018).
Notably, some universities operate ‘access schemes’ whereby students from certain equity groups or schools may receive additional points to their ATAR, or the ATAR requirement is lowered (Pilcher & Torii, Citation2018). Further, ‘early offer’ programs enable secondary schools to select equity students for unconditional entry to a particular university or are available to wider cohorts who apply directly to universities earlier than state-wide admission systems. While such interventions can enhance diversity, selection processes are not always transparent and can cause confusion given widely promoted minimum ATAR cut-offs (Blyth, Citation2014).
Alternative entry pathways
Encouragement of alternative entry resulted in significant growth of diverse admission pathways (TEQSA, Citation2019) and direct applications to universities – largely not from secondary school leavers – doubled from 2009 to 2017, compared with 17% growth for those entering via tertiary admission centres (Productivity Commission, Citation2019). Indeed, around 62% of all undergraduates in 2021 entered university through alternative pathways (Australian Government, Citation2021). Australian data have also indicated that of the additional seven per cent of students aged under 22 years that entered university between 2010 and 2016, a greater proportion than the existing student body did not receive an ATAR (or it was below 70) (Productivity Commission, Citation2019). Diamond and O’Brien-Malone (Citation2018) observed that support for, and experimentation with, alternative entry is also evident in other developed regions, including Europe, New Zealand and the UK.
Alternative entry pathways in Australia can be classified into nine types, summarised in . First, students may enter a university by transferring from one university course to another. Higher education students are moving between institutions more than previously (Pilcher & Torii, Citation2018) and Watson et al. (Citation2013) found almost one-quarter of undergraduates entered based on another higher education qualification. This may reflect students completing their first year of study in a course with a lower ATAR requirement than transferring to their more desired program based on their first-year grades (Joseph, Citation2023).
Table 1. Alternative admission pathways into university.
Although approximately 10% of students enter higher education through a VET qualification (Watson et al., Citation2013), the transition can be complicated, despite formal processes for credit transfer and recognition of prior learning (see Griffin, Citation2014). VET entrants are heterogeneous, some recent school leavers and others completing their VET qualification several years earlier (Chesters & Watson, Citation2016), resulting in cohorts with wide age ranges (Lovat & Darmawan, Citation2019). VET is considered particularly successful in enabling low-SES and regional/remote students to access higher education (Catterall et al., Citation2014).
Pathways targeting mature-age entry span mature-age special entry, professional qualification and portfolio entry. Watson et al’.s, (Citation2013) study of commencing undergraduates found that 21% of students entered higher education via portfolio entry which, for private universities, may include community and church involvement (Productivity Commission, Citation2019). These pathways can effectively identify students with the potential to succeed at university and encourage participation among equity groups (Palmer et al., Citation2011) yet there are concerns for the transparency of their selection processes (Harvey et al., Citation2016).
Enabling programs were designed to support disadvantaged students into higher education, targeting those who were not previously eligible to enter or who were not prepared to do so (McKay et al., Citation2018). Enabling programs intend to build confidence, resilience, and a greater sense of purpose among students who have typically achieved lower ATARs (Chesters & Watson, Citation2016; Coombes et al., Citation2013; Johns et al., Citation2016). They are favoured by mature students (Whannell, Citation2013) and transition proportionately more equity students to higher education than other alternative pathways, attributed to the absence of fees common to other routes (Pitman et al., Citation2016). In Australia, around one-half of participants successfully complete enabling programs (Chesters & Watson, Citation2016).
Some institutions guarantee entry into their courses based on completion (Productivity Commission, Citation2019), while others require a certain standard of performance for undergraduate course enrolment at that, or a different university. Programs vary in length, delivery mode and content, and greater consistency among offerings could improve transferability and participation across the sector (Pitman et al., Citation2016). Pitman and colleagues also advocate for greater alignment with the undergraduate courses they articulate into, and some believe the programs can create unwarranted expectations of undergraduate success (e.g., Cocks & Stokes, Citation2012).
A popular educational model in Australia is the partnering of a private pathway provider with a public university (Velliaris, Citation2019). As with other alternative pathways, non-university higher education providers provide a ‘second chance’ for those who did not achieve the academic requirements for direct entry (Wheelahan, Citation2009) and focus on developing academic skills in preparation for university. Importantly, while alternative pathways may provide a viable means of entry, there are concerns that students may not be prepared for university study, resulting in poor academic performance and low retention rates (Diamond & O’Brien-Malone, Citation2018).
There are known variations in admission pathways by discipline. This may be explained by nuances in funding with relatively low allocation of enabling places in Education, Nursing, Medicine, Veterinary Science compared with other disciplines, such as Sciences, Arts and Humanities and Commerce (Australian Government, Citation2019a). Variations may also be explained by disciplines’ different ATAR entry standards. Courses in high demand (e.g., Medicine and Dentistry) are likely to have higher minimum ATAR scores and be less likely to accept students entering via alternative pathways compared to courses with lower ATAR scores (Southgate et al., Citation2015).
Success in widening participation
The Bradley Review of Australian higher education (Bradley et al., Citation2008) specified targets of 40% of those aged 25–34 years to attain a Bachelor-level qualification by 2025 (compared with 30% in 2008) and 20% of domestic undergraduate enrolments to come from low-SES backgrounds (compared with 15%). National data indicate that the proportion of people attending university by age 22 increased from 53% in 2010 to 60% in 2016 (Productivity Commission, Citation2019). Of those additional students, a greater proportion than the existing student body were first-in-family to university and/or of low-SES background. There was not, however, increased participation among regional/remote or Indigenous students, and the 20% target for low-SES students was not achieved (Koshy, Citation2019).
Data from Universities Australia (Citation2022) showed that enrolments of students with disability increased by 3.7% between 2008 (4.3%) and 2020 (eight per cent). While a growth of two per cent was reported for low SES students over the same period (16.1% to 18.1%), Indigenous student enrolments were relatively static with only a 0.8% growth since 2008 (from 1.3%) and enrolments for regional/remote students declined from 19.6% to 19.2%. As the Australia Productivity Commission (Citation2019) asserted, greater representation of certain groups is positive, yet equity groups overall remain underrepresented.
Gauging the success of alternative pathways for increasing equity student participation in higher education has been constrained by data access limitations (Diamond & O’Brien-Malone, Citation2018) and there appears to be greater evaluation of students’ experiences once at university than proportions entering via different routes. Evidence does suggest a proportionately greater pathway use among Indigenous, regional/remote, low SES and NESB students (Andrewartha & Harvey, Citation2014; Lomax-Smith et al., Citation2011). However, Diamond and O’Brien-Malone highlighted how policy changes and a greater appetite for higher education among traditionally excluded groups have not always translated to increased higher education enrolments due to a lag in universities adjusting their admission processes. There is some evidence that alternative pathways have widened participation and increased diversity in other countries (for example, Turner et al., Citation2012).
Methodology
Data sources and participants
This study is based on two secondary data sources. First, aggregated enrolment data from the Australian Government’s Higher Education Statistics Collection, obtained as custom tables summarising 1,932,424 commencing domestic, Bachelor students at Australia’s 43 public and private universities between 2011 and 2019. These data were stratified by university, admission pathway, course details, enrolment history and equity group membership and data enabled examination of patterns and trends in admission pathway usage over time.
Second, enrolment data for 81,874 domestic Bachelor students commencing in 2015 from 16 volunteer higher education institutions (39 Australian public and private universities were invited to participate). Data included degree details, demographics, enrolment status and admission pathways and were tracked over five years. The participating institutions were geographically dispersed across Australia, including regional areas and four of the Group-of-Eight (Go8, research intensive) universities were represented. Eight of the 16 universities provided the broad admission pathway classifications specified by the Australian Government for 33,513 Bachelor students. The remaining eight supplied detailed admission pathway classifications used by their institutions for 48,361 Bachelor students, allowing for a more detailed examination of alternative entry. Data are aggregated yet we recognise institutional differences in pathway use may exist due to government funding allocation or university policy to not offer or prioritise such arrangements during the given timeframe. Notably, the 16 institutions were distributed across the ranked order of Australian universities by their share of school leavers entering via non-secondary school pathways (Joseph, Citation2023). Bachelor student characteristics for the 2015 government and institutional-level samples are summarised in , each including those who completed traditional Bachelor courses and those with an honours (research thesis) component.
Table 2. Bachelor student sample characteristics, commencing in 2015.
Measures
This study considers seven equity student groups: Indigenous; with disability (disability/impairment/long-term medical condition that may affect studies); low SES and regional/remote (both determined by postcode of permanent home residence); NESB (language other than English at permanent home residence); women in STEM fields of study (Natural/Physical Sciences, Information Technology, Engineering, Architecture/Building, Agriculture/Environmental, or Health); and those of mature-age (aged 25 or above at commencement of study). While NESB students may no longer be underrepresented at university (e.g., Norton, Citation2014), they often experience weaker outcomes relative to other groups (Li & Carroll, Citation2020; Li et al., Citation2017) and have therefore been included in the study.
We recognise the challenges with investigating differences across different equity groups, given their diverse needs and backgrounds and often heterogeneous and overlapping nature (Harpur et al., Citation2023). summarises the proportion of equity students belonging in different groups to help understand intersectionality in the sample. Groups with particularly high proportions (more than 25%) of identifying with other equity groups were as follows: Indigenous students and regional/remote, Indigenous and mature-age, low SES and regional/remote, low SES and NESB, regional/remote and Women in STEM and NESB and Women in STEM. Student age was included as a continuous variable, determined in years at the end of the previous calendar year.
Table 3. Intersectionality among equity student groups (%).
Australian higher education institutions are required to report students’ admission pathway to the government annually, categorised as follows: secondary education (Australian [ATAR] or overseas); higher education course (Australian/overseas); VET course (Australian/overseas); mature-age entry provision; professional qualification and ‘other basis’. In addition to these admission categories, some institutions maintain a more detailed internal classification of students’ admission pathways, subsequently mapped to government classifications for reporting purposes. We obtained detailed admission pathway information from eight of the 16 participating institutions, the remaining eight reporting government admission codes. Additional ‘other’ sub-categories comprised ‘other-access’ (equity schemes not based on ATAR), ‘other-portfolio’, ‘other-pathway’ and ‘other-enabling’.
Analysis
Data were analysed in STATA 16.0 using primarily descriptive techniques (mean/standard deviations/frequency/percentages/ratios). Multinomial logistic regression was used to explore the association between equity group membership and entry pathway usage. It is an extension of binary logistic regression, allowing for unordered categorical dependent variables with more than two levels. Given small sample group sizes, ‘other-Portfolio’ was combined into the government’s ‘other basis’ grouping and ‘other-access’, ‘other-pathway’ and ‘other-enabling’ were combined into one group (‘other-access/enabling’). Multinomial logistic regression was considered as an appropriate estimation methodology because our outcome variable – entry pathway – comprised seven unordered categories (secondary education/higher education course/VET course/mature-age entry provision/professional qualification/other basis/other – access/enabling). Further, it permits control of potential confounding variables (e.g., course attendance type, broad field of education studied, type of university attended) in the association between equity group membership and entry pathway. Separate models were estimated for the eight institutions that provided detailed admission pathway information and all 16 participating institutions, accounting for differences in the coding of ‘other’ admission pathways. For the full sample models, the institutional pathway categories are mapped to the standard government categories.
Results
Entry pathways for all and equity groups
presents the number and proportion of Bachelor students commencing in 2015 for each entry pathway, drawing on both government and institutional data. Approximately one-half of students entered via secondary education, by far the most popular pathway, and relatively more common in institutions that provided detailed pathway information. Around one-fifth entered via higher education course transfer, a smaller proportion from VET study or professional qualification, and very few through mature-age entry provisions. For institutions providing detailed pathway breakdowns, 5.5% were admitted through Enabling/Portfolio/Access programs. By contrast, mature-age entry provision was relatively common for those supplying only government-coded pathways.
Table 4. Admission pathways – commencing domestic Bachelor students in 2015.
presents the proportions of Bachelor student groups entering via different pathways over time, based on government enrolment data. Data for all students are presented at the top, with equity student group breakdowns underneath. When considering the use of different admission pathways by equity student group, we note for context that government data indicated an upward trend in the proportion of equity student groups entering undergraduate study between 2011 and 2019. The exceptions were regional/remote students, who fell marginally over the ten-year period, and NESB students who remained the same.
Table 5. Admission pathway proportions (%) for commencing domestic Bachelor degree students, 2011–2019.
indicates that Indigenous students greatly favour the use of alternative pathways with three-quarters of the 2019 cohort using these routes, although this declined slightly over the 10-year period. Higher education course, VET and ‘other basis’ were the most popular routes with VET demonstrating strong growth and ‘other basis’ less use over time. Almost two-thirds of students with disability and low SES students used alternative pathways in 2019 with steady growth over the 10-year period. Similar to Indigenous students, their favoured pathways were higher education course, VET and ‘other basis’ with very limited growth in VET entry over time.
Slightly greater proportions of regional/remote and NESB students entered directly from secondary education, approximately 40% for each group although this declined over time, particularly for NESB students. Both groups reported increased use of higher education course and ‘other’ basis pathways but there were differences for VET with regional/remote students making greater use and NESB less use over time. Trends for Women in STEM were not dissimilar with more than one-half using alternative pathways and reported growth in VET entry and ‘other basis’. As expected, the vast majority of mature-age students entered via alternative pathways with marked growth in VET entry and, to a lesser extent, ‘other basis’.
reveal notable findings for the relative use of specific alternative entry pathways by equity student groups. For secondary education, shows that although the overall proportion of students declined, it remained the most common admission pathway. Another striking finding was Indigenous students’ limited use of this pathway relative to others, although it was the only group that reported growth over the 10-year period.
Figure 1. Proportion of equity students entering via secondary education, 2011–2019.
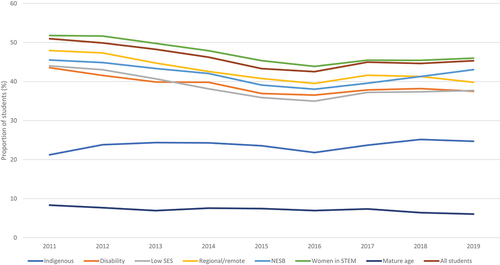
Figure 2. Proportion of equity students entering via higher education course, 2011–2019.
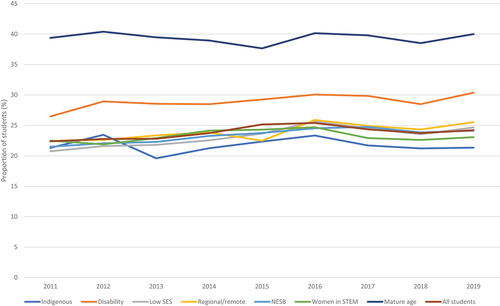
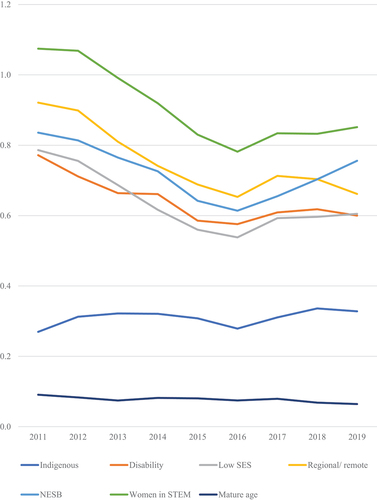
Figure 3. Proportion of equity students entering via vocational education, 2011–2019.
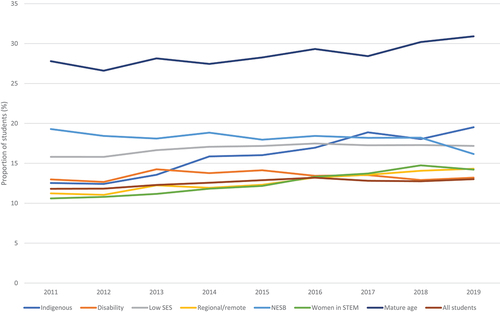
Figure 4. Proportion of equity students entering via mature-age entry provisions, 2011–2019.
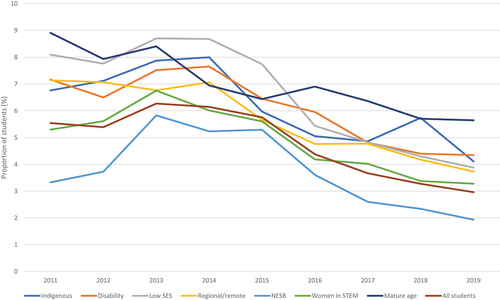
Figure 5. Proportion of equity students entering via professional qualification, 2011–2019.
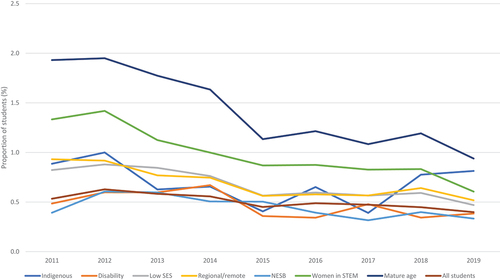
Figure 6. Proportion of equity students entering via ‘other basis’, 2011–2019.
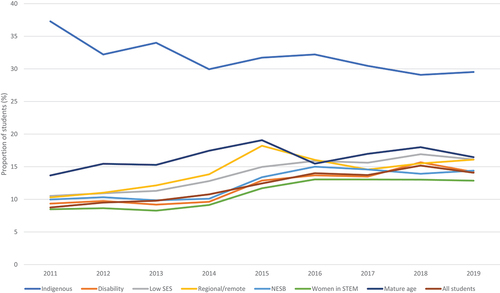
In contrast, differences for higher education course () were less prominent with all groups, other than mature-age, hovering around the one-quarter mark with some growth over time. Again, the stand-out difference for VET entry () was the high proportion of mature-age students with all other groups ranging between 13.2 and 19.5% in 2019. There were, however, differences in usage over time with the highest growth reported among Indigenous students and Women in STEM.
Mature-age entry provisions () and Professional Qualification () experienced considerably less take-up than other pathways across all equity groups, even for mature-YETage students, and contracted over time. Finally, the proportionate growth in ‘Other basis’ () was relatively uniform for all equity groups other than for Indigenous students whose usage dropped over time, although they remained by far the biggest user.
graphs the ratios of secondary education to alternative pathways using government data for each equity group, over time. A ratio value of one indicates secondary pathway usage equalling alternative entry pathways, exceeding one shows greater use of the secondary education pathway, while below one specifies greater utilisation of alternative education pathways. Mature-age and Indigenous students observed very low ratios, around 0.1 and 0.3, respectively, indicating most students enter via alternative pathways. The mature-age ratio declined even further over time, albeit modestly, while Indigenous students’ ratio increased, indicating a shift towards secondary education entry, although the 2019 ratio remains far below parity. Other groups commenced with higher ratios, ranging between 0.75 and 1.1, and declined strongly between 2011 and 2016, indicating increased use of alternative pathways. Since 2016 ratios plateaued or rose slightly but, overall, a downtrend in secondary education entry was observed across the five groups.
Figure 7. Ratio of secondary-to-alternative pathway by equity group, 2011–2019.
Expanding on this, presents multinomial logistic regression estimates of the association between equity group membership and detailed entry pathway (relative to ‘secondary education’), controlling for demographic and course characteristics. Given that our equity group (explanatory) variables of interest are dummy (0,1) coded, a positive (negative) coefficient for an equity group/entry pathway cell indicates that membership in that equity group is associated with increased (decreased) relatively log odds (likelihood) of university entry through that pathway relative to secondary education. Statistically significant estimates are highlighted by asterisks at the indicated levels.
Table 6. Multinomial logistic regression estimates of entry pathway choice relative to ‘secondary education’ (relative log odds).
highlights the diversity of alternative pathways used by different equity groups. For example, there is a strong association between being Indigenous and admission via ‘other’ pathways. Where this can be broken down further, being Indigenous is associated with a substantially greater likelihood of entering through access/enabling programs versus secondary education. Students with disability were associated with higher odds of admission through mature-age entry, and lower odds of all other pathways relative to secondary education. Low SES students had lower odds of entry through access/enabling pathways, but higher odds of other alternative entry routes, relative to secondary education.
Also observed were regional/remote students having higher odds of entering through completing VET study or the ‘other’ pathway (excluding access/enabling programs). NESB students were associated with a lower likelihood of admission through a higher education course, mature-age entry, and ‘other’ pathway, but higher odds via VET and access/enabling programs. Women in STEM had lower odds for admission through mature-age entry, ‘other’ pathways, or the access/enabling program pathway. Finally, mature-age students had lower odds of entry through a higher education course, the ‘other’ pathway, or the access/enabling program pathway, but higher likelihood of admission through VET courses or mature-age entry provisions.
Equity students, pathway and discipline
Ratios for secondary-over-alternative entry proportions over time using government data captured broad trends by discipline (see ). observes most disciplines clustering around the parity ratio of one in 2011 and a downward trend over the ten-year period, indicating growth in alternative entry pathways. There was particularly strong growth in Engineering with a commencing ratio above 1.8, indicating overwhelming entry via secondary education, to 1.1 in 2019, although an upward trend was reported since 2015. A downtrend in ratio for Architecture/Building was initially observed, then strong growth in secondary education entry since 2016, resulting in the only recorded larger ratio in 2019 than in 2011. Finally, Natural/Physical Sciences commenced with strong secondary education entry which sharply declined but then increased after 2016.
Figure 8. Ratio of secondary-to-alternative pathway by discipline, 2011–2019.
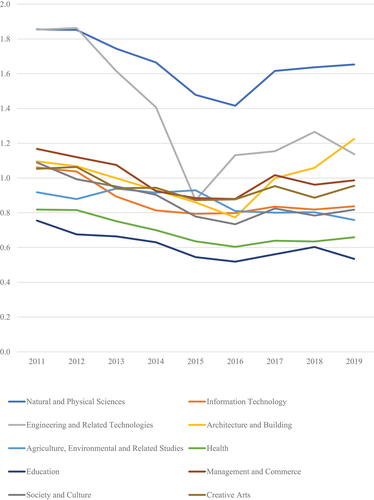
Additional analysis, detailed as an Appendix for brevity, identified some notable findings in specific alternative entry pathways. First, the VET pathway appeared particularly underused in Natural/Physical Sciences and Engineering, with only 4.5% and 7%, respectively, of students using this pathway over time, compared to around 10% to 18% in other disciplines. Second, the mature-age pathway seemed to decline across all disciplines although particularly stark for education, where the share of students fell from 8% in 2011, to 3.6% in 2019. Third, course transfer was particularly prevalent in Society/Culture, Agriculture/Environmental and Architecture/Building, although declining over time in the latter discipline. Finally, the ‘other’ pathway was particularly important for Creative Arts, stable at 14 to 15% over time, compared to around 6% in other disciplines.
presents the ratios for secondary-to-alternative pathway by equity group and discipline for 2019. Broadly, there was greater use among equity student groups of alternative pathways in Health, Education and – to a lesser extent – Society/Culture and least use in Natural/Physical Sciences and Architecture/Building. The remaining disciplines are largely clustered around the parity ratio of one, with some exceptions outlined below. Additional analysis showed ratios were largely stable between 2011 and 2019, exceptions are again observed below.
Figure 9. Ratio of secondary-to-alternative pathway by equity group and discipline in 2019.
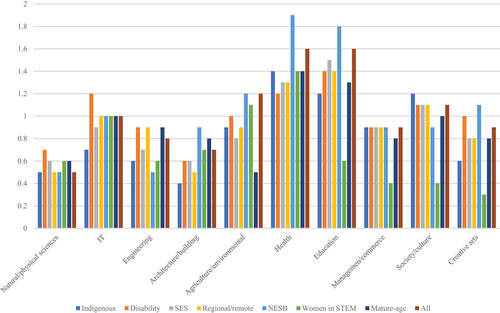
Women in STEM’s use of alternative pathways were particularly low across the disciplines, other than IT, Agriculture/Environment, and Health. Mixed results were reported for Engineering with relatively low ratios evidenced for Indigenous, low SES, NESB, and women in STEM students. The use of alternative pathways among regional/remote students and students with disability notably rose by 0.5 and 0.4 over the ten-year period, respectively. Along with women in STEM, relatively less Indigenous students used alternative pathways to enter Creative Arts courses and this declined over time (0.9 in 2011 to 0.6 in 2019).
Overall, equity groups in Agriculture/Environmental – compared with the wider cohort of students, were making relatively less use of alternative pathways. In particular, the discipline attracted proportionately few mature-age students by alternative pathways, declining over time. The discipline also saw a shift in Indigenous students accessing courses via alternative pathways (1.4 in 2011 to 0.9 in 2019), while NESB students made greater use of alternative entry, 0.4 to 1.2 over the ten-year period. There was a notable decline in the use of alternative entry across equity groups in Architecture/Building, particularly among Indigenous students (1.4 in 2011 to 0.4 in 2019).
Discussion and implications
Our study reinforces earlier literature that secondary education entry to university is declining over time yet is still the most common pathway (e.g., TEQSA, Citation2019). Further, it supports earlier evidence of the growth in student use of alternative entry pathways in Australia over time (Productivity Commission, Citation2019), in line with funding and policy changes intended to augment this growth. In accordance with earlier studies (e.g., Norton, Citation2016), one can see the growth in alternative pathways during the period of demand-driven funding and subsequent deceleration as enrolment caps were re-introduced in 2018, aligned with earlier studies.
Growth in access by higher education course transfer (domestic or overseas) and VET study was particularly strong, as was ‘other basis’. The rise in private colleges/pathway providers between 2012 and 2015 may have contributed to the relatively sharp increase during that period in the ‘other basis’ grouping (Cardak et al., Citation2022). While the use of mature-age entry provisions saw a slight decline over the ten years, this was not due to corresponding falls in the proportion of mature-age student cohorts. Rather, mature-aged students – particularly in Education – are accessing higher education in other ways. Their relatively high use of the VET pathway affirms Chesters and Watson’s (Citation2016) assertion that VET entrants often complete their qualification many years before commencing university. They made comparatively less use; however, of access/enabling programs compared to their younger counterparts which refutes earlier evidence of their engagement with enabling programs (Andrewartha & Harvey, Citation2014). The findings do raise the question of why mature-aged students are steering away from mature-age provision pathways, and their limited use perhaps suggests this pathway could be amalgamated with others, where appropriate. Furthermore, it is noteworthy that our results indicate that mature-aged students were highly represented among Indigenous and/or regional/remote student groups.
Apart from Indigenous students, the increasing use of alternative pathways by all equity groups, particularly those with disability, of low-SES background, and women in STEM, is positive. It broadly affirms that alternative pathways are fit-for-purpose for widening participation in higher education and addresses this ongoing priority of the Australian government (Australian Government, Citation2023; Diamond & O’Brien-Malone, Citation2018). Nuances in pathway use among equity groups, however, highlight opportunities for improvement through targeted policy and practice. For example, students with disability entering via VET have remained static over time, and their use of the ‘other basis’ pathway is relatively low, although growing over time. Given widely held concerns for their lack of participation in higher education, a review of how accessible and inclusive these routes are, as well as interventions to raise students’ awareness and encourage use of such opportunities, appears critical.
A somewhat unexpected finding was low SES student’ relatively limited use of access/enabling pathways, along with regional/remote students who favour VET for entering higher education. Enabling programs were introduced primarily to prepare students of low SES or educational disadvantage into higher education through the development of skills and knowledge (Australian Government, Citation2019a) and by building social and cultural capital resources to support participation in higher education (James & Walters, Citation2020). It therefore appears critical to review their availability and design, and how they are being promoted to these equity groups. Relatedly, it is important to note that institutional use of enabling programs is likely to be driven by government allocation of places and associated funding, known to vary across the sector (Australian Government, Citation2019a). Consequently, some universities may set up larger enabling programs compared to those with more restricted funding, potentially explaining nuances in institutional reporting on this pathway.
The declining use of alternative pathways by Indigenous students, albeit slightly, warrants further investigation given their chronic underrepresentation in higher education. It also highlights the need for further efforts to boost their access to and participation in these pathways, with implications for stakeholders. The reported positive relationship between access/enabling pathways and Indigenous students’ participation aligns with the growth in engagement in enabling programs of 7.6% between 2008 and 2020 (Universities Australia, Citation2022) and echoes earlier studies (e.g., Hodges et al., Citation2013). This illuminates the value of enabling programs for encouraging these students into higher education, creating a sense of community and belonging among participating students and better connecting them to higher education culture (see Willans, Citation2019).
Growth in the proportion of Indigenous students entering via secondary school is positive and perhaps suggests improvement in school completion (Australian Government, Citation2020a). Compared to other groups, however, the proportion remains low and findings signal the potential benefit of expanded engagement with Indigenous students through targeted interventions at the high school stage, including the use of bonus ATAR scores and early, unconditional offers (Pilcher & Torii, Citation2018).
The relatively low proportion of Women in STEM entering via VET and ‘other basis’, although both rising over time, indicate potential ways to increase female participation to address ongoing concerns with talent shortages in these areas. Further, although Women in STEM were the greatest users of mature-age entry provisions, their use of this pathway has fallen over time and warrants further investigation of how this pathway could become more attractive and accessible to more females.
Findings also indicated that trends in university entry differed by discipline. Students from all disciplines are leveraging alternative pathways into university, but growth was particularly pronounced in health. Given the emergence of national priorities, such as the development of a suitably skilled workforce to adequately meet the demands for aged care (Tower et al., Citation2015), and global health crises such as the COVID-19 pandemic, continued use of alternative admission will play an important role in health workforce planning and development.
In contrast, students in Natural/Physical Sciences and Engineering disciplines were less engaged with alternative pathways, particularly VET. This is concerning given workforce shortages in these fields (for example, Engineers Australia, Citation2022) and highlights the need to review articulation processes when entering other than from secondary education. Entry into these areas may become more attractive given the Job-Ready Graduates program which reduced fees for studying STEM subjects (Australian Government, Citation2020b) although early evidence suggests the financial incentive is not affecting enrolment numbers (Yong, Citation2022). Rather, targeted interventions for improving access into Natural/Physical Sciences, Engineering and Architecture/Building – through school-based or alternative pathways – may help reach equity group participation targets. The interplay between alternative pathways and disciplines could also be reflective of relative concentrations of equity groups in certain disciplines, such as Health and Education, as has been found by Carroll and Li (Citation2022). Policies to increase representation of equity groups in disciplines such as Natural/Physical Sciences and Engineering will therefore need to address equity group-specific considerations, in addition to targeting access through alternative pathways.
Another important finding was that the study revealed substantial differences in the way that institutions collect university entry pathway information, some gathering detailed data, and others collecting data only for the broad government classifications. Given the growing importance of alternative entry pathway and the rise in its use, a consistent sector-wide approach to data gathering would be beneficial.
Conclusion
Increasing the participation of under-represented groups in higher education is a priority internationally, including in Australia. Recent policy reforms in Australia have driven cyclical effects in the sector, such as the introduction of the demand driven system in 2012 which saw a sharp rise in student enrolments, followed by contractionary policies in 2017 and subsequent changes to funding by disciplines in the more recent Job-Ready Graduates policy. There has, however, been a steady focus on improving access and increasing representation for individuals from equity groups against this backdrop of wider policy reforms in the sector. Australian policy reforms to widen participation have included the introduction of alternative entry pathways into higher education, yet little is known about trends in these admission pathways and their utilisation by student equity groups. This study examined trends in pathway use among equity groups and by discipline to evaluate efforts to widen participation through alternative entry.
Findings revealed growth in alternative pathway entry to university over time, while the transition from secondary education, through ATAR, has consistently declined, although it remains the most common single pathway. While entry via the completion of a higher education or VET course increased over the ten-year period, the strongest growth was observed for students entering through ‘other’ pathways – particularly access and enabling programs – which were introduced for under-represented students. The proportion of equity group students accessing university through alternative entry has increased over time, except for Indigenous students. Collectively, these findings indicate that alternative pathways to university have supported widening participation in higher education and future efforts to expand participation should leverage the utility of these pathways, particularly for underrepresented individuals.
The study serves to inform government and the higher education sector’s understanding of the relative success of alternative entry pathways in boosting higher education participation among equity groups, indicating where gaps might lie and informing strategies for improvement and future policy. A further contribution is the creation and documentation of an innovative approach to using existing data to examine participation in Australian universities by entry pathway, equity groups and disciplines. Data were drawn directly from existing collections from federal governmental sources, available within individual institutions, and our approach can be readily adopted by policy makers in government and the higher education sector to benchmark performance and standards.
The study, like others, has limitations. Its quantitative focus does not allow for examination of why student groups favour certain pathways and choose not to participate in others. Deeper exploration through qualitative inquiry could inform changes to policy and pathway design to better cater to diverse student needs. Furthermore, the use of only permanent home residence to determine low SES and regional/remote status may be considered a limitation with Cardak et al. (Citation2017) outlining how combining this with current address during study can provide more accurate indicators. Also, the study may reflect nuances in the participating institutions’ admission policies and funding allocations and arrangements for certain pathways. The study does, however, provide a strong foundation for future research. This could explore specific reasons for the associations between equity group membership and the use of certain alternative pathways. Extending this to examine differences by field of study could help to identify opportunities for policy and practice to support increased diversity in higher education.
Disclosure statement
No potential conflict of interest was reported by the authors.
Additional information
Funding
References
- ACIL Allen Consulting. (2017) . Evaluation of the higher education participation and partnerships program. ACIL Allen.
- Anderton, R., Chivers, P., & Chivers, P. T. (2016). Predicting academic success of health science students for first year anatomy and physiology. International Journal of Higher Education, 5(1), 250–260. https://doi.org/10.5430/ijhe.v5n1p250
- Andrewartha, L., & Harvey, A. (2014). Willing and enabled: The academic outcomes of a tertiary enabling program in regional Australia. Australian Journal of Adult Learning, 54(1), 50–68.
- Australian Government. (1990) . A fair chance for all: Higher Education that’s within everyone’s reach.
- Australian Government. (2019). Final report for performance-based funding for the Commonwealth Grant Scheme. Australian Government.
- Australian Government. (2019a). Consultation paper on the reallocation of Commonwealth supported places for enabling, sub-bachelor and postgraduate courses.
- Australian Government. (2019b). Final report for performance-based funding for the Commonwealth Grant Scheme.
- Australian Government. (2020a). Closing the gap report 2020.
- Australian Government. (2020b) . Submission from department of education, skills and employment to the senate standing committee on education and employment.
- Australian Government. (2021) . Undergraduate applications, offers and acceptances.
- Australian Government. (2023). Australian Universities Accord – Discussion Paper.
- Baik, C., Naylor, R., Arkoudis, S., & Dabrowski, A. (2019). Examining the experiences of first-year students with low tertiary admission scores in Australian universities. Studies in Higher Education, 44(3), 526–538. https://doi.org/10.1080/03075079.2017.1383376
- Blackburn, H. (2017). The status of women in STEM in higher education: A review of the literature 2007–2017. Science & Technology Libraries, 36(3), 235–273. https://doi.org/10.1080/0194262X.2017.1371658
- Blyth, K. (2014). Selection methods for undergraduate admissions in Australia. Does the Australian predominate entry scheme the ATAR have a future? Journal of Higher Education Policy & Management, 36(3), 268–278. https://doi.org/10.1080/01587919.2014.899049
- Bradley, D., Noonan, P., Nugent, H., & Scales, B. (2008). Review of Australian Higher Education. Australian Government.
- Cardak, B., Bowden, M., & Bahtsevanoglou, J. (2015). Are low SES students disadvantaged in the university application process?. National Centre for Student Equity in Higher Education (NCSEHE).
- Cardak, B., Brett, M., Barry, P., McAllister, R., Bowden, M., Bahtsevanoglou, J., & Vecci, J. (2017). Regional student participation and migration: Analysis of factors influencing regional student participation and internal migration in Australian higher education. NCSEHE.
- Cardak, B., Brett, M., & Burt, S. (2022). Explaining domestic studentenrolment growth in Australian private universities and colleges. Research in Post-Compulsory Education, 27(1), 1–23. https://doi.org/10.1080/13596748.2021.2011503
- Cardak, B., & Ryan, C. (2009). Participation in higher education in Australia: Equity and Access. The Economic Record, 85(271), 433–448. https://doi.org/10.1111/j.1475-4932.2009.00570.x
- Carroll, D.R., & Li, I. W. (2022). Work and further study after university degree completion for equity groups. Journal of Higher Education Policy & Management, 44(1), 21–38. https://doi.org/10.1080/1360080X.2021.1988841
- Catterall, J., Davis, J., & Yang, D. (2014). Facilitating the learning journey from vocational education and training to higher education. Higher Education Research & Development, 33(2), 242–255. https://doi.org/10.1080/07294360.2013.832156
- Chesters, J., & Watson, L. (2016). Staying power: The effect of pathway into university on student achievement and attrition. Australian Journal of Adult Learning, 56(2), 225–249.
- Cocks, T., & Stokes, J. (2012). A strong foundation: Inclusive education at an Australian university college. International Journal for Cross-Disciplinary Subjects in Education, 3(4), 844–851. https://doi.org/10.20533/ijcdse.2042.6364.2012.0120
- Coombes, P., Danaher, P., & Danaher, G. (2013). Transforming learning through capacity-building: Maximising life and learning support to mobilise diversities in an Australian pre-undergraduate preparatory program. The International Journal of the First Year in Higher Education, 4(2), 27–37. https://doi.org/10.5204/intjfyhe.v4i2.169
- Cunninghame, I., Costello, D., & Trinidad, S. (2016). Issues and trends for low socioeconomic status background and first-in-family students. In S. Trinidad & J. Phillimore (Eds.), Facilitating student equity in Australian higher education (pp. 4–13). NCSEHE.
- Dawkins, J. (1990). Higher education: The challenge ahead. Australian Government.
- Diamond, M., & O’Brien-Malone, A. (2018). Pathways to performance: An examination of entry pathway and first-year university results. Asia Pacific Journal of Education, 38(1), 110–128. https://doi.org/10.1080/02188791.2018.1423953
- Edwards, D., Buckley, S., Chiavaroli, N., Rothman, S., & McMillan, J. (2023). The STEM pipeline: Pathways and influences on participation and achievement of equity groups. Journal of Higher Education Policy & Management, 45(2), 1–17. https://doi.org/10.1080/1360080X.2023.2180169
- Engineers Australia. (2022) . Strengthening the engineering workforce in Australia.
- Gale, T., Parker, S., Rodd, P., Stratton, G., & Sealey, T. (2013). Student aspirations for higher education in Central Queensland. Centre for Research in Education Futures and Innovation.
- Good Education Group. (2020) . The good universities guide 2020. Good Education Media.
- Griffin, T. (2014). Disadvantaged learners and VET to higher education transitions. National Centre for Vocational Education Research.
- Harpur, P., Szucs, B., & Willox, D. (2023). Strategic and policy responses to intersectionality in higher education. Journal of Higher Education Policy & Management, 45(1), 19–35. https://doi.org/10.1080/1360080X.2022.2144790
- Harvey, A., Brett, M., Cardak, B., Sheridan, A., Stratford, J., Tootell, N., McAllister, R., & Spicer, R. (2016). The adaptation of tertiary admissions practices to growth and diversity. La Trobe University.
- Harvey, A., Mallman, M., Szalkowicz, G., & Moran, A. (2018). Raising university participation of new migrants in regional communities. NCSEHE.
- Heagney, M., & Benson, R. (2017). How mature-age students succeed in higher education. Journal of Higher Education Policy & Management, 39(3), 216–234. https://doi.org/10.1080/1360080x.2017.1300986
- Higher Education Standards Panel. (2016) . Improving the transparency of higher education admissions. Australian Government.
- Hodges, B., Bedford, T., Hartley, J., Klinger, C., Murray, N., O’Rourke, J., & Schofield, N. (2013). Enabling retention: Processes and strategies for improving student retention in university-based enabling programs. Australian Government.
- James, T., & Walters, V. (2020). How positive is positive psychology in an enabling program?: Investigating the transformative power of positive psychology for enabling students. Australian Journal of Adult Learning, 60(2), 170–189.
- Johns, S., Crawford, N., Hawkins, C., Jarvis, L., Harris, M., & McCormack, D. (2016). Unlocking the potential within: A preliminary study of individual and community outcomes from a university enabling program in rural Australia. Australian Journal of Adult Learning, 56(1), 69–88.
- Joseph, R. (2023). Atar’s rising relevance: Admission standards and completion rates. Centre for Independent Studies.
- Knipe, S. (2013). University course completion and ATAR scores. The Journal of Educational Enquiry, 12(1), 25–39.
- Koshy, P. (2019). Equity student participation in Australian higher education: 2013–2018. NCSEHE.
- Krause, K., Vick, M., Boon, H., Bland, D., & Clark, J. (2009). A fair go beyond the school gate? Systemic factors affecting participation and attainment in tertiary education by Queensland students from LSES backgrounds. Queensland Government / Eidos Institute.
- Lamb, S., & Huo, S. (2017). Counting the costs of lost opportunity in Australian education. Mitchell Institute.
- Li, I.W., & Carroll, D. (2020). Factors influencing dropout and academic performance: An Australian higher education equity perspective. Journal of Higher Education Policy & Management, 42(1), 14–30. https://doi.org/10.1080/1360080X.2019.1649993
- Li, I.W., Mahuteau, S., Dockery, A., & Junankar, P. (2017). Equity in higher education and graduate labour market outcomes in Australia. Journal of Higher Education Policy & Management, 39(6), 625–641. https://doi.org/10.1080/1360080X.2017.1377966
- Lomax-Smith, J., Watson, L., & Webster, B. (2011). Higher education base funding review: Final report. Department of Education, Employment and Workplace Relations.
- Lovat, A., & Darmawan, G. (2019). The academic performance of VET pathway university students and the effects of gender and age. Australian Journal of Education, 63(3), 307–321. https://doi.org/10.1177/0004944119881546
- Lucas, B., & Hanson, J. (2016). Learning to be employable: Practical lessons from research into developing character. City and Guilds.
- Martin, G. (2015). Tightly wound rubber bands: Exploring the college experiences of low-income, first-generation White students. Journal of Student Affairs Research and Practice, 52(3), 275–286. https://doi.org/10.1080/19496591.2015.1035384
- Martin, L. (2016). Framing the framework: The origin of a fair chance for all. In A. Harvey, C. Burnheim, & M. Brett (Eds.), Student equity in Australian Higher Education: Twenty-five years of a fair chance for all (pp. 21–38). Springer.
- McKay, J., Pitman, T., Devlin, M., Trinidad, S., Harvey, A., & Brett, M. (2018). The use of enabling programs as a pathway to higher education by disadvantaged students in Australia. In C. Agosti & E. Bernat (Eds.), University pathway programs: Local responses within a growing global trend (pp. 45–66). Springer.
- Norton, A. (2014). Language background should be dropped as a higher ed equity category. http://andrewnorton.net.au/2014/07/28/language-background-should-be-dropped-as-a-higher-ed-equity-group/
- Norton, A. (2016). Equity and markets. In A. Harvey, C. Burnheim, & M. Brett (Eds.), Student equity in Australian higher education: Twenty-five years of a Fair Chance for All (pp. 183–206). Springer.
- Norton, A., & Cherastidtham, I. (2018). Dropping out: The benefits and costs of trying university. Grattan Institute.
- O’Connell, M., Milligan, S., & Bentley, T. (2019). Beyond ATAR: A proposal for change. Koshland Innovation Fund.
- Organisation for Economic Co-operation and Development. (2016) . Enhancing employability. OECD.
- Organisation for Economic Co-operation and Development. (2019) . Education at a glance. OECD.
- O’Shea, S. (2019). Mind the Gap! Exploring the post-graduation outcomes and employment mobility of individuals who are first-in-family to complete a university degree. NCSEHE.
- Palmer, N., Bexley, E., & James, R. (2011). Selection and participation in higher education: University selection in support of student success and diversity of participation. Centre for the Study of Higher Education.
- Pilcher, S., & Torii, K. (2018). Crunching the number: Exploring the use and usefulness of ATAR. Mitchell Institute.
- Pitman, T., Koshy, P., & Phillimore, J. (2015). Does accelerating access to higher education lower its quality? Higher Education Research & Development, 34(3), 609–623. https://doi.org/10.1080/07294360.2014.973385
- Pitman, T., Trinidad, S., Devlin, M., Harvey, A., Brett, M., & McKay, J. (2016). Pathways to higher education: The efficacy of enabling and sub-bachelor pathways for disadvantaged students. NCSEHE.
- Productivity Commission. (2019). The demand driven university system: A mixed report card.
- Salmi, J., & D’Addio, A. (2021). Policies for achieving inclusion in higher education. Policy Reviews in Higher Education, 5(1), 47–72. https://doi.org/10.1080/23322969.2020.1835529
- Sattler, L. (2021). Report into parental engagement in career education. Study Work Grow.
- Scull, S., & Cuthill, M. (2010). Engaged outreach: Using community engagement to facilitate access to higher education for people from low socio-economic backgrounds. Higher Education Research & Development, 29(1), 59–74. https://doi.org/10.1080/07294360903421368
- Shergold, P., Calma, T., Russo, S., Walton, P., Westacott, J., Zoellner, D., & O’Reilly, P. (2020). Looking to the future. Report of the review of senior secondary pathways into work, further education and training. Australian Government.
- Southgate, E., Kelly, B. J., & Symonds, I. M. (2015). Disadvantage and the ‘capacity to aspire’to medical school. Medical Education, 49(1), 73–83. https://doi.org/10.1111/medu.12540
- Tertiary Education Quality and Standards Agency. (2019). Statistics report on TEQSA registered higher education providers. Australian Government.
- Tomaszewski, W., Perales, F., & Xiang, N. (2017). School experiences, career guidance, and the university participation of young people from three equity groups in Australia. NCSEHE.
- Torii, K., & O’Connell, M. (2017). Preparing young people for the future of work: Policy roundtable report. Mitchell Institute.
- Tower, M., Cooke, M., Watson, B., Buys, N., & Wilson, K. (2015). Exploring the transition experiences of students entering preregistration nursing degree programs with previous professional nursing qualifications. Journal of Clinical Nursing, 24(9–10), 1174–1188. https://doi.org/10.1111/jocn.12756
- Tsoi, I. (2015). Post-secondary educational pathways of young people in Hong Kong: The influence of cultural capital. International Journal of Continuing Education and Lifelong Learning, 7(2), 121–147.
- Turner, R., Shulruf, B., Li, M., & Yuan, J. (2012). University admission models that address quality and equity. Asia Pacific Journal of Education, 32(2), 225–239. https://doi.org/10.1080/02188791.2012.684955
- Universities Australia. (2022) . 2022 Higher education facts and figures.
- Vaccaro, A., Daly-Cano, M., & Newman, B. (2015). A sense of belonging among college students with disabilities: An emergent theoretical model. Journal of College Student Development, 56(7), 670–686. https://doi.org/10.1353/csd.2015.0072
- Velliaris, D. (2019). Diploma pathway programs: The offerings of an Australian pre-university institute. IGI Global.
- Watson, L., Hagel, P., & Chesters, J. (2013). The half-open door pathways for VET award-holders into Australian universities. NCVER.
- Whannell, R. (2013). Predictors of attrition and achievement in a tertiary bridging program. Australian Journal of Adult Learning, 53(2), 281–300.
- Wheelahan, L. (2009). Do educational pathways contribute to equity in tertiary education in Australia? Critical Studies in Education, 50(3), 261–275. https://doi.org/10.1080/17508480903156854
- Willans, J. (2019). Tales from the borderland: Enabling students’ experiences of preparation for higher education. International Studies in Widening Participation, 6(1), 48–64.
- Willis, S., & Joschko, L. (2012). A ‘high quality, high access’ university that aims to marry excellence and equity. Widening Participation and Lifelong Learning, 14(1), 8–26. https://doi.org/10.5456/wpll.14.1.8
- Yong, M. (2022, October). Job ready graduates does not work, at any price. Campus Morning Mail, https://campusmorningmail.com.au/news/job-ready-graduates-does-not-work-at-any-price/