
Abstract
We study how ethnic fragmentation in Indian districts influences the distribution of consumption, both overall and between social groups. In the absence of systematic evidence on inequality between social groups (horizontal inequality) during the sample period, we construct estimates of horizontal and overall inequality, and find that horizontal inequality is a small proportion of overall inequality, as well as that both overall and horizontal inequality have increased over time. Our empirical results indicate that more fragmented districts have higher inequality, but the relationship between fragmentation and horizontal inequality is weak. Additionally, we show that fragmentation increases inequality by lowering public good provision.
1. Introduction
In this paper, we look at a remarkable feature of Indian society – its very high levels of ethnic fragmentation – and study its impact on inequality in consumption expenditure, both overall and across social groups. Our interest in the impact of ethnic fragmentation on economic inequality arises from the fact that there is now a vast literature relating inequality to political, social and economic outcomes. High levels of inequality may lead to conflict and crime (Murshed & Gates, Citation2005), as well as inefficient redistribution and high taxation rates in democracies, and lower growth rates in general (Persson & Tabellini, Citation1992). High levels of inequality may not be politically acceptable in some societies, leading to increased animosity between groups. So, along with other economic and political consequences that the extensive literature has shown ethnic fragmentation to have (Alesina, Baqir, & Easterly, Citation1999; Banerjee & Somanathan, Citation2007; Easterly & Levine, Citation1997; Elbadawi & Sambanis, Citation2002; Miguel & Gugerty, Citation2005), we question whether fragmentation also has an impact on the distribution of consumption, which possibly also has independent adverse consequences. This research question seems particularly pertinent given that recent world events have refocused attention on levels of economic inequality in societies, its many consequences, and society’s ability to tackle these issues.
In the light of this, it is important to know the evolution of both overall and horizontal inequality in India. Given the absence of systematic evidence on horizontal inequality, especially at the district level we first present the national, state and district level trends in inequality for the years 1988–2012. We document two facts: first, horizontal inequality explains a small proportion of total inequality (about 4–5%), and second, that during this period, there has been an increase in both overall and horizontal inequality, especially after the 1990s. After reporting the estimates for overall and horizontal inequality, we report the district level regression results and find that between 1988 and 2012 overall inequality has increased more in districts that are more ethnically fragmented. However, the relationship between ethnic fragmentation and horizontal inequality either does not exist or, at best, is weak. Our empirical work, in line with much of the earlier literature, treats ethnic fragmentation as effectively fixed over the short to medium run.
Since there exists evidence that heterogeneity negatively affects public good provision (Banerjee & Somanathan, Citation2007) and given the redistributive nature of public goods, we expect low public goods provision to drive the impact of ethnic fragmentation on inequality. To test this, we add schools and health centres in our regressionFootnote1 and find that the impact of ethnic fragmentation falls considerably once we control for schools and health centres, indicating that low public goods provision is the channel through which ethnic fragmentation increases inequality. This finding, along with the recent revisionist literature, which claims that not all types of public goods are affected by ethnic fragmentation (Chadha & Nandwani, Citation2017; Gisselquist, Leiderer, & Ni˜no-Zaraz′ua, Citation2016; Singh, Citation2011; Singh & vom Hau, Citation2016), suggests that public goods can be an instrument for mitigating some of the adverse impacts of ethnic fragmentation.
In other words, while we acknowledge that public good provision is endogenous to fragmentation levels, it is not an endowment. Furthermore, the extent to which public good provision is impacted by fragmentation depends on how, and by what technology (privately, local or higher levels of government etc.), these public goods are provided (Chadha & Nandwani, Citation2017; Gisselquist et al., Citation2016). Thus, appropriately implemented, public good provision can be used as a policy instrument to mitigate the adverse impacts of fragmentation. Our analysis also indicates that the mitigating effect of public goods is driven primarily by reducing the within-group inequality component rather than the horizontal component. This result suggests that the poor in all groups benefit from the provision of education and health facilities.
This paper makes two important contributions to the existing literature. First, it shows that ethnic fragmentation is systematically related to inequitable economic outcomes. While there is now a large body of evidence, from various contexts, that suggests that ethnic fragmentation is related to poorer provision of public goods and other economic outcomes (Alesina et al., Citation1999; Banerjee & Somanathan, Citation2007; Easterly & Levine, Citation1997; Miguel & Gugerty, Citation2005), our understanding of how ethnic fragmentation affects the evolution of the distribution of economic outcomes is limited. Alesina, Michalopoulos, and Papaioannou (Citation2016a) show that the interactive effects of ethnic diversity and economic inequality matter for economic development rather than ethnic fragmentation, per se. However, they do not discuss if ethnic fragmentation could itself be responsible for inequality across ethnic lines. Fum and Hodler (Citation2010) show that in resource-rich societies, in which there is a possibility of seeking rent from natural resources, ethnic polarisation leads to high economic inequality. However, our analysis of ethnic fragmentation and inequality is not dependent on proceeds from natural resources.
Secondly, this paper provides evidence that public good provision leads to outcomes that are more equitable, and can hence mitigate the impact of fragmentation. The income equalisation aspect of public goods has previously been discussed (Seery, Citation2014) and empirically established both in OECD countries (Verbist et al., Citation2012) and developing countries (Lustig, Citation2012). Public services, like schools and hospitals provide ‘virtual income’ to the poor, who would have to pay for these services in the absence of public provision. We develop this idea in the context of an ethnically fragmented society that is not well studied in the literature.Footnote2 The results of our paper show public goods can act as a mitigating factor, and are much in the same spirit as an earlier paper in the institutional economics literature (Easterly, Citation2001). Easterly’s paper showed that good institutions can mitigate the adverse impacts of ethnic diversity. However, institutions are much more difficult to change as compared to providing public goods.
The rest of the paper is organized as follows: Section 2 discusses the data sources and the construction of inequality measures, while in Section 3 we discuss the conceptual background for the relationship between fragmentation, public good provision and inequality, and present our empirical methodology. We present the results in Section 4, and various robustness checks in Section 5. Section 6 concludes.
2. Data and construction of inequality measures
We construct estimates of vertical and horizontal inequality at the district, state and national level from 1988 to 2012 by exploiting household level information on consumption expenditure reported in various rounds of the National Sample Survey (NSS) data. NSS is a nationally representative household survey conducted in India, typically with a ‘thick’ round every five years.Footnote3 We use four thick rounds of NSS: the 43rd (conducted in 1987–1988), the 61st (conducted in 2004–2005), the 66th (conducted in 2009–2010), and the 68th (conducted in 2011–2012).Footnote4 We also use data from a thin 51st round conducted in 1994–1995.Footnote5 The expenditure data, reported at the current prices in the NSS rounds, is adjusted for the differential price changes in rural and urban areas using Consumer Price Index (CPI) data from the Reserve Bank of India database. We also adjust the consumption expenditure for the household size to arrive at the per capita measure.
Two measures of consumption inequality are constructed: the Gini coefficient and the Theil index.Footnote6 These measures capture aspects of overall inequality that do not take into account the individual’s or household’s identity or group affiliation. However, given recent literature which suggests that rather than overall inequality, between-group tensions are much better explained by measures of horizontal inequality (Alesina, Michalopoulos, & Papaioannou, Citation2016b; Baldwin & Huber, Citation2010), we also look at inequality in consumption expenditure between caste groups. The reason for choosing caste as the ethnic marker is the vast literature on the long shadow that caste identity still casts on the social, economic, and political life in India. Exploiting information on the broad caste group of the household provided in the NSS data (whether the household is Scheduled Caste (SC), Scheduled Tribe (ST), or Others),Footnote7 we construct two measures of horizontal inequality: the group Gini (GGini) and the group Theil.
The evolution of vertical and horizontal inequality at the national, state and district level is presented in Figures and respectively. The district and the state trends in both figures have been obtained by regressing the district and state Gini/group Gini, respectively, on survey round dummies, and then plotting the point estimates against years.Footnote8 indicates that the inequality trends at the three levels follow a similar evolution over the years, with an initial fall in the year 1994, followed by a steady rise until 2009–2010, after which there is clear decrease in inequality. Note that the inequality in the year 2010 is strikingly higher than the inequality trend; a possible explanation for this is that the 2009–2010 round of the NSS was conducted after two successive drought years, which probably impacted consumption expenditure of poorer households more severely than the richer households. Given the vast literature on the inability of the poor to smooth consumption in a developing country setting, this explanation seems plausible.
Figure 1. Evolution of overall inequality, 1988–2012.
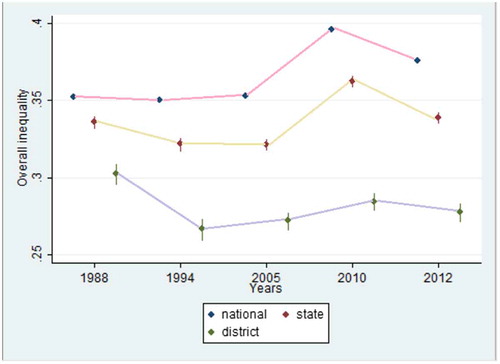
Figure 2. Evolution of horizontal inequality, 1988–2012.
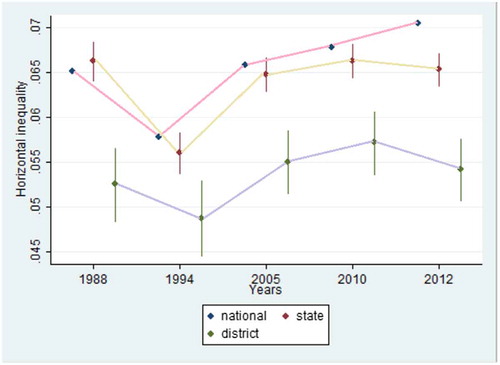
The evolution of horizontal inequality follows the same trend as that of the overall inequality measures. There is a narrowing of inter-group disparities in the initial sample period around 1994, followed by a steady and stark increase until 2010, after which the trends diverge as district and state level horizontal inequality decreased, whereas national horizontal inequality increased. Note that the increase in horizontal inequality is much sharper than that of overall inequality in the 2000s, which is why the increase in horizontal inequality is higher than the increase in overall inequality over the sample period. Nevertheless, our result of a very small magnitude of horizontal inequalityFootnote9 with an increasing trend is consistent with the literature (Deshpande & Ramachandran, Citation2016; Zacharias & Vakulabharanam, Citation2011).
The main variable of interest is ethnic fragmentation. In this paper, we consider different castes as ethnic groups. In India, the Hindu population (the major religious group) is divided into castes with deep social cleavages that govern social and economic interaction. Caste follows Kanchan Chandra’s definition of ethnicity, which is simply nominal membership to an ascriptive category in which membership is inherited (Chandra, Citation2007). Besides caste fragmentation, one could argue for religious fragmentation, since religion also follows the definition we use to classify a group as ethnic. However, according to the 2011 census, religious groups other than the majority Hindu religion, make up only 20% of the population. Out of this 20%, the majority (14%) is made up of Muslims, implying that we would essentially be looking at the impact of relative shares of Hindu-Muslim population if we based our fragmentation on religion. While this is an important issue, in this exercise we are interested in heterogeneity rather than identity. We also do not consider heterogeneity based on language as there is no clear evidence of impact of mother tongue on attainment of economic outcomes. Also, states in India are linguistically formed, therefore leaving little variation in the language spoken within a state.
To measure fragmentation we need a variable that captures the underlying caste diversity in Indian districts. Unfortunately, caste-level population data is not made available by any census conducted after independence (in 1947). The data from the latest census divides the population into three broad social groups: Scheduled Castes (SC), Scheduled Tribes (ST), and the rest of the population. Broadly, all the disadvantaged castes are clubbed together in the census into a constitutional category (SC); the middle and upper castes are clubbed into a category named ‘others’; and the disadvantaged tribes (who are placed outside the Hindu caste system) are put into the ST category. These social categories are very broad, with many layers of hierarchy within them and therefore it is not appropriate to use them to capture caste heterogeneity as it operates at the ground level. Additionally, there would be endogeneity concerns with using current caste proportions. Both the mobility of caste groups and provision of public goods could be driven by unobservable variables such as state institutions or policies. It is also possible that the availability of schools and other public goods themselves could result in a particular distribution of caste groups. Therefore, we look for a proxy that captures the caste diversity at the district level, and that is devoid of endogeneity concerns.
We make use of the 1931 census to construct a proxy for current fragmentation.Footnote10 The 1931 census was the last census to record detailed district-level information on population shares of different castes.Footnote11 The construction of fragmentation using historical data has been done previously (see Anderson, Citation2011; Banerjee, Iyer, & Somanathan, Citation2005; Banerjee & Somanathan, Citation2007; Suryanarayan, Citation2017) as it has its own advantage: it reduces the endogeneity concern, as it is unlikely that the caste composition of districts in 1931 would be affected by factors influencing the provision of schools provided much later in time. However, an important assumption we make when working with the 1931 census is that caste proportions in 1931 have not changed much over time and are a good proxy for present day caste diversity. To justify this assumption, we rely on the existing evidence and claim that fragmentation based on 1931 proportions is a good proxy.
Caste specific migration would be a threat to identification. However, there is evidence that caste migration in India is quite low (Munshi & Rosenzweig, Citation2016) due to reliance on sub-caste networks of mutual insurance, which rarely transgress village boundaries (Anderson, Citation2011). Though women marry out of their village, marriage almost always occurs within the same caste. In general, migration in India is low and, of the migration which does happen, about 62% of it is intra-district, while 24% is inter-district, and 13% is inter-state. A very high proportion of intra-district migration would mean that migration should not substantially affect caste proportion within districts over time. In order to show that caste proportions have not substantially changed over time, Anderson (Citation2011) matched the caste proportion obtained from the census of 1921 data with the caste proportion obtained from a recent data-set collected in 1997–1998 by the World Bank.Footnote12 The district caste proportions using the two data sets were very similar, providing confidence about the use of the 1931 proportions. We also checked the correlation between the fragmentation measure based on present day proportions of social groups and the measure based on the 1931 proportions. We found a positive and highly significant correlation between them, further providing evidence that 1931 proportions are a good proxy for present day caste diversity.
Following the literature, we measure diversity using the Ethnolinguistic Fractionalisation Index (EFI), given by where β
i
is the population share of the ith ethnic group. Since 1931, new districts have been created, so for the districts formed after independence, we weight the caste figures from the original district according to the area of the new district that was taken from them, following Banerjee and Somanathan (Citation2007). Average and median value of EFI is close to 0.93 indicating that Indian districts are highly fragmented along caste lines.
Data on public goods provision is obtained from the 1991, 2001 and 2011 census village directories. The census directories have information on the availability and the total numbers of a particular public good in a given village. We aggregate this information up to the district level. Note that we have five NSS years in our sample, so for the NSS years that were conducted in between the census years, we use the same public goods data as that of previous census year. The public goods that we focus on are primary schools and health centres (primary health centres and maternity home centres) in a district. There are two reasons for focusing on education and health facilities. First, human capital investments can be made by the state as well as the individual households, and therefore it is possible for households to spend on these goods themselves (unlike say roads). This allows for a richer relationship between schools (and health facilities) and inequality. Second is the availability of comparable public goods data across the census rounds.
3. Concepts and methodology
The objective of this section is to provide a conceptual background to the relationship between fragmentation and economic inequality. As has already been established in the literature, fragmentation can lead, broadly, to a number of adverse outcomes: low public goods provision, low collective action, and poor quality institutions. Furthermore, significant trading opportunities can be lost due to social or cultural distance. It is thus quite plausible that fragmentation, through the above variables, influences the distribution of economic outcomes. In particular, low provision of public goods may affect the poor more than the rich and thus skew the distribution of consumption in fragmented districts. In line with the existing work, we argue that public provision of services provides ‘virtual income’ to the poor by reducing their spending on privately provided services. Better public goods, along with providing virtual (current) income, aid in human capital formation which can lead to better future outcomes.Footnote13
In this paper, we establish the impact of fragmentation on inequality through the public goods channel. The reason for focusing on public goods is twofold. First, as discussed above they have an equitable impact and are thus also a commonly used policy instrument for redistribution in India. Secondly, the emergence of a revisionist body of work in the fragmentation-public goods literature has shown that only when some very specific factors interact with fragmentation, do we observe a negative impact on the provision of public goods. This means that it is possible that public goods may be provided exogenously to fragmentation.
We also decompose the impact on inequality into the within- and between-caste group components. If caste entirely identified economic outcomes, and individual characteristics did not matter, then the impact would be entirely due to horizontal inequality. However, if the rich in each social group have better access to economic opportunities, whereas the poor (irrespective of the group identity) suffer in fragmented places, it would imply high within-group inequality and no or little impact on horizontal inequality. It is, therefore, a matter of empirical investigation whether the increase in inequality is driven by that between or within groups.
We empirically estimate the impact of fragmentation on inequality using the following equation:
where d indexes districts, s indexes states, and t indexes NSSO round (i.e. year of data collection). I dst are inequality measures (such as Gini, Theil, GGini etc.), EFIdst is the widely used Ethnic Fractionalisation Index (EFI), which captures the probability that two randomly picked households belong to different castes. We expect the coefficient of interest, γ 1, to be positive. The specification includes state and round fixed effects. By including state fixed effects, we minimise concerns that statewide differences in institutions or policies would confound our results.Footnote14 Round fixed effects control for survey-round specific macroeconomic shocks that affect all the districts. X’ dst includes log of average consumption, literacy rate and urbanisation rate in the district. These variables capture the time varying economic activity in the district. Hence, γ 1 measures the impact of fragmentation on inequality after controlling for its effect on economic activity. We also include state-level time trends to account for any state-level unobservable that also changes over time.
The equation with schools and health centersis estimated as followsFootnote15 :
where PGdst is the number of schools and health centers per 1000 population in a district. As before, state and round fixed effects and state level time trends are included. We expect ethnic fragmentation to impact public goods negatively, given ample evidence in the literature. We also expect lowered public good provision to increase inequality. Therefore, we should see a fall in the coefficient of ethnic fragmentation in Equation (2) as compared to Equation (1).
4. Results
Results from estimating Equations (1) and (2) are reported in . Column 1 (and correspondingly column 7 for Theil) indicates that more fragmented districts have higher overall inequality. The magnitude of the coefficient suggests that, as compared to a completely homogeneous district, a perfectly fragmented district would have about 0.10 higher Gini coefficient/Theil index. Given that the average district has a Theil coefficient of 0.158 in the sample, the observed effect suggests that a perfectly fragmented district would have about 69% higher inequality than a homogeneous district. In this specification, and all others in the paper, we have included state and round fixed effects.
Table 1. Impact of ethnic fragmentation on overall inequality.
The regressions also include district level time varying controls: literacy rate, urbanisation rate (proportion of population that lives in urban areas)Footnote16 and log of average consumption expenditure. The control variables capture the level and nature of economic activity in the district and ensure our results are not confounded because of the impact of fragmentation on inequality through economic activity. Additionally, the urbanisation rate controls for the fact that consumption distribution could evolve differently in urban as opposed to rural areas, which may also be systematically different in terms of fragmentation. Results reported in column 2 (column 8 for Theil), however, confirm that the impact of fragmentation on inequality is robust to the addition of all controls and state-specific time trends.
To test whether the impact of fragmentation on inequality is, in part, driven by public good provision we estimate Equation (2) with the inclusion of primary schoolsFootnote17 and primary and maternal health centres and find evidence in favour of our hypothesis. The addition of schools and health centres in columns 3 and 4 (and correspondingly columns 9 and 10 for the Theil measure), leads to a fall in the coefficient of ethnic fragmentation indicating that a part of the negative effect of ethnic fragmentation is driven by low public goods provision. The magnitude of the fall indicates that the lack of schools and health centres is responsible for an approximately 30% increase in inequality in fragmented districts. Note that public goods do not drive the entire increase in inequality in fragmented places and, as discussed above, there can be other channels responsible as well.
Apart from linearly adding schools and health centres, we interact them with fragmentation to elucidate the idea that the negative impact of fragmentation is lower if public goods are provided. This specification is very much in line with Easterly (Citation2001) who, by interacting institutions with ethnic fragmentation, showed that good institutions can mitigate the adverse impact of ethnic fragmentation. In the same spirit, our results, reported in columns 5 and 6 (11 and 12 for Theil), indicate that even though on average fragmentation increases inequality, this increase is lower in districts with a higher provision of schools and health centres, as indicated from the negative and significant coefficients of the interaction terms. This result suggests that if it was possible to provide public goods efficiently independent of the level fragmentation, then the negative impact of ethnic diversity could be mitigated. Given recent literature has shown that provision of public goods is not always negatively impacted by fragmentation (Chadha & Nandwani, Citation2017; Gisselquist et al., Citation2016; Singh, Citation2011; Singh & vom Hau, Citation2016), it seems possible to provide public goods exogenously to fragmentation, which can then act as a mitigating instrument in fragmented districts.
We have conceptualised public goods as one channel through which fragmentation manifests its effect on inequality. To substantiate this argument, we directly show the impact of public good provision on inequality. The results, reported in , indicate that presence of schools and health centres has an equitable impact on the distribution of consumption. Like previous estimations, this specification also includes state and round fixed effects, state-level time trends and additional time varying district level controls. Given the data, this is a fairly demanding estimation. While we cannot completely rule out the possibility of omitted variables, controlling for average per capita consumption expenditure, urbanisation and literacy rates should minimise this concern. As we show in Section 5, we also ran robustness checks to account for any reverse causation.
Table 2. Impact of public goods provision on overall inequality.
We next study if higher inequality in fragmented districts is because of inequality between or within groups. Results are reported in . Columns (1)–(4) repeat the results on overall inequality from . Columns (5)–(8) present the results on within-group inequality while columns (9)–(12) present the results on horizontal inequality. As is evident, fragmented districts do not have higher horizontal inequality, and indeed all the increase in inequality in fragmented places is driven by the within-group inequality component. Additionally, in line with the evidence that public goods act as the channel, the results of columns (7) and (8) indicate that the entire increase in within group inequality in fragmented places is driven by low provision of public goods. The results of this table suggest that, irrespective of the group identity, the poor suffer more because of fragmentation. This could also indicate that richer sections of even the disadvantaged groups have been able to overcome the disadvantage of their identity, even if only partially, leading to high within group inequality. The result of within group disparities in fragmented districts is quite interesting as it throws light on a hitherto ignored aspect of caste dynamics in Indian society.
Table 3. Impact of ethnic fragmentation on within and horizontal inequality.
There is a caveat here. The above finding could partially be a result of the way we measure horizontal inequality. The ethnic groups that we use to construct the fragmentation measure are disaggregated and are derived from the jati. However, horizontal inequality is constructed using the NSS data, which does not include information on jati, but rather the broad caste group affiliation, the varna. There are thousands of jati’s in India while only four varna’s which can be understood as an aggregation of jati’s into broad social categories. The level at which fractionalisation operates on ground in India is at the jati level, however, the data only captures information on broad group affiliation. Given this, the horizontal inequality as estimated in this paper may be an underestimate of the ‘true’ horizontal inequality in India, which can be one of the reasons why we do not see any impact of fragmentation on horizontal inequality.
5. Robustness checks
Results presented in the previous section show that public goods drive the increase in inequality in fragmented places. However, there could be concerns that schools and health centres are picking the effect of variables affecting both the distribution of public goods and inequality. Therefore, in this section, we address some concerns regarding the impact of public goods provision on inequality. The main concern is that of reverse causation. It is possible that high inequality affects the provision of public goods, rather than public goods affecting the level of inequality. This concern is well founded given that Baldwin and Huber (Citation2010) show that high levels of between-group inequality negatively affects the provision of public goods and Banerjee and Somanathan (Citation2007) show – in the Indian context – that inequality in land holdings has a positive impact on the provision of public goods.
To ensure our results are not confounded by reverse causation, we exploit the timings of the population census, which we use to construct public goods provision in a district and of the NSS, which we used to construct our measures of inequality. In our main analysis, the timing of NSS and census data is as follows: for the inequality estimates obtained from the 43rd NSS round (conducted in 1988), we use data on schools and health centres from the 1991 census data. For inequality estimated for the 51st round (1995), we again make use of the 1991 census. Inequality estimates obtained from the 61st (2005) and 66th (2010) rounds are compared with public goods data from the 2001 census, and for inequality estimates from the 68th round (2012) we use the 2011 census public goods information.
This implies that, except for the year 1988, for all other years our analysis studies the effect of public goods provided prior to our measure of the distribution of income. This arrangement allows us to address the reverse causation issue. We do so by removing the year 1988 from our main regression and then study the impact of lagged public goods provision on inequality. Since it is highly unlikely for future levels of inequality to have an impact on the current provision of public goods, we expect the use of lagged public goods information will address our concerns. Results, presented in , show that even after excluding the year 1988, the qualitative result still of still holds. Public goods continue to act as channels as indicated by the fall in the coefficient of ethnic fragmentation in specifications 2 and 3, which have schools and health centres, as compared to specification 1. However, the fall in the coefficient of ethnic fragmentation is by a smaller magnitude as compared to .
Table 4. Impact of ethnic fragmentation on overall inequality (without 1988).
Even after using sufficiently lagged public goods data, one could argue that evolution of inequality is sticky and therefore the concern of inequality in determining public goods would remain. However, if that was the case, we would have observed a positive correlation between inequality and public goods provision, in line with the evidence of a positive impact of inequality on provision of public goods in India provided by Banerjee and Somanathan (Citation2007). The explanation provided by their paper for the observed positive correlation is that the provision of public goods happened rapidly in places that were poor and unequal. Therefore, considering this existing evidence for India, it seems unlikely that our result of a negative correlation between public goods and inequality could have been driven by the influence of inequality on public goods.
Finally, there are concerns regarding the representativeness of NSS data before 2004 at the district level. Even though NSS rounds before the 61st round have been used for district level analysis in earlier work (Topalova, Citation2010), we want to ensure that the earlier rounds do not drive our results. We therefore drop the 43rd and 51st rounds from our main specification (results not reported) and find that the coefficient of ethnic fragmentation continues to remain positive (magnitude 0.14) and significant. However, when we add schools and health centres, the drop in the magnitude of the coefficient is much smaller than what was observed in the previous tables (coefficient drops to 0.13), presumably because the variation in public goods reduces considerably by dropping two NSS rounds. In any case, the qualitative results of hold even without 43rd and 51st rounds.
While the use of an instrumental variable maybe the ideal solution, in the absence of a credible IV in this context, we believe that the addition of district level time varying controls, plus lagging the data, sufficiently addresses endogeneity concerns.
6. Conclusion
The objective of this paper was to investigate the relationship between ethnic fragmentation, public good provision, and inequality. We find that overall inequality is higher in more fragmented districts. However, there is no robust relationship between horizontal inequality and fragmentation. Lowered provision of public goods is the channel through which fragmentation manifests its impact, but again this is only true for overall inequality and not horizontal inequality. These results, along with a recent revisionist literature, suggest that public goods, provided in specific ways that are not as impacted by fragmentation, can be used to mitigate some adverse impacts of ethnic diversity.
These results are in contrast to Baldwin and Huber (Citation2010) who, at a cross-country level, find a strong relationship between group inequality (BGI) and public good provision. There are significant differences between the earlier paper and the present one. First, this paper only uses data from India while theirs was a cross-country study. While this has the advantage that the results are not confounded by broad unobservable differences across countries, it of course reduces the richness by looking only at one country. Secondly, as we argued above, given the broad enumeration of caste groups in Indian data, measured horizontal inequality is low, and a very small component of overall inequality. This could be the reason that we find weak or no correlation between fragmentation or public good provision and horizontal inequality. It could also suggest that the rich are able to benefit from economic opportunities regardless of social identity, and hence it is within-group inequality that increases in fragmented districts.
Addition research is still needed to understand which measure of horizontal inequality needs to be calculated, given a particular variable of interest, and which groups then need to be enumerated. As has been shown in the literature, horizontal inequality mechanically increases as the number of groups being enumerated increases (Shorrocks & Wan, Citation2005). The question, then, is how disaggregated should enumeration be?
Funding
This work was supported by UNU-WIDER.
Disclosure statement
No potential conflict of interest was reported by the authors.
Notes on contributors
Nishant Chadha is a research fellow at the India Development Foundation.
Bharti Nandwani is a PhD scholar in the Department of Economics, Shiv Nadar University.
Acknowledgements
This work is supported by UNU-WIDER under the project on ‘The politics of group-based inequalities–measurement, implications, and possibilities for change’. We would like to thank Ashwini Deshpande, Shubhashis Gangopadhyay, the seminar participants at the UNU-WIDER workshop on between group inequalities and the Duke SNU conference for helpful comments. The usual disclaimers apply.
Notes
1. We only use information on schools and health facilities as these are the only public goods that were consistently reported across the three census rounds. More details are presented in a later section.
2. See Banerjee, Iyer, and Somanathan (Citation2007) for a voluntary contribution game with private provision of the public good. Incorporating private provision in the discussion is important because in India there is a high amount of private provision of both schools and health facilities.
3. Thick rounds are typically conducted every five years and have large sample size with the data being representative at the NSS district level. Thin rounds on the other hand have smaller sample size, with the data being representative only at the state level and are conducted in the years between two successive thick rounds.
4. The 66th round was conducted after two successive drought years and because of this was followed by another thick round in 2011–2012.
5. The 51st round is used primarily because the ‘thick’ 50th round does not include district level identifiers. Therefore, in its place, we make use of the 51st round.
6. In India (as in other developing countries) measuring consumption inequality makes more sense than income inequality. People are paid in kind for many of the services they provide, and receive transfers from friends and governments, and therefore income is hard to measure for a large part of the population. Also, In fact, economic theory suggests that consumption inequality is a better measure of welfare inequality than income inequality (see Attanasio & Pistaferri, Citation2016).
7. Later rounds of NSS also enumerate another group the other backward classes (OBC).
8. We also obtained the inequality trends using the Theil measure. Results, not reported here, indicate the same trend as with Gini.
9. The NSS collects information on broad caste group affiliation (scheduled castes, scheduled tribes, other backward classes and others) and not on what is referred to by many scholars as the operative unit of caste on ground, the jati. Unfortunately, given the data we can only construct inequality estimates between these caste groups. This can be one of the reasons why we observe a very small magnitude of horizontal inequality. A move from using broad caste groups to jati level aggregation may increase the estimated horizontal inequality for two reasons – first, because it allows for the true disparities to emerge and second, the horizontal inequality estimates may increase as a result of the number of groups increasing.
10. To get caste level data, some studies have used the Survey of Living Conditions data conducted by the World Bank for two Indian states for 1997 and 1998 (Lee, Citation2017). However, since this paper studies all major Indian states over a much longer period, we make use of Census of 1931.
11. We include a caste in the sample, if it constituted more than 1% of the state population in 1931. This leaves us with about 185 caste groups.
12. Note that this exercise was done for two states, Bihar and Uttar Pradesh and the caste data for the year 1997–1998 was collected for the seven castes. So essentially, caste proportions were matched for seven castes in two states over the two data sets.
13. This impact of education (and most likely health services) is expected to be realised well ahead in future, however, the time lags used in the paper may not capture that well.
14. Because our independent variable, Ethnicfrag does not vary significantly over time, we cannot include district fixed effects in our regression equations.
15. Our public goods data does not allow us to distinguish between public or private provision nor does it give us out of pocket expenditure on education or health. It is simply a count of the number of public goods provided and is obtained from the census.
16. The data for literacy rate and urbanisation rate have been obtained from 1991, 2001 and 2011 population censuses.
17. We focus on primary schools because in the specification with all types of schools, only primary schools turn to be significant. Also, on average, primary schools make up about 70% of the total schools in a district and hence looking at just primary schools seems reasonable. We also ran regressions with the total number of schools and our results remain the same.
References
- Alesina, A., Baqir, R., & Easterly, W. (1999). Public goods and ethnic divisions. The Quarterly Journal of Economics, 1243–1284.10.1162/003355399556269
- Alesina, A., Michalopoulos, S., & Papaioannou, E. (2016a). Ethnic inequality. Journal of Political Economy, 124(2), 428–488.10.1086/685300
- Alesina, A., Michalopoulos, S., & Papaioannou, E. (2016b). Ethnic inequality. Journal of Political Economy, 124(2), 428–488.10.1086/685300
- Anderson, S. (2011). Caste as an impediment to trade. American Economic Journal: Applied Economics, 3(1), 239–263.
- Attanasio, O. P., & Pistaferri, L. (2016). Consumption inequality. Journal of Economic Perspectives, 30(2), 3–28.10.1257/jep.30.2.3
- Baldwin, K., & Huber, J. D. (2010). Economic versus cultural differences: Forms of ethnic diversity and public goods provision. American Political Science Review, 104(04), 644–662.10.1017/S0003055410000419
- Banerjee, A., Iyer, L., & Somanathan, R. (2005). History, Social divisions, and public goods in rural India. Journal of the European Economic Association, 3(2–3), 639–647.10.1162/jeea.2005.3.2-3.639
- Banerjee, A., Iyer, L., & Somanathan, R. (2007). Public action for public goods. Handbook of Development Economics, 4, 3117–3154.10.1016/S1573-4471(07)04049-1
- Banerjee, A., & Somanathan, R. (2007). The political economy of public goods: Some evidence from India. Journal of Development Economics, 82(2), 287–314.10.1016/j.jdeveco.2006.04.005
- Chadha, N., & Nandwani, B. (2017). Ethnic fragmentation and school provision in India (No. 176). Helsinki: World Institute for Development Economic Research (UNU-WIDER).
- Chandra, K. (2007). Why ethnic parties succeed: Patronage and ethnic head counts in India. Cambridge: Cambridge University Press.
- Deshpande, A., & Ramachandran, R. (2016). The changing contours of intergroup disparities and the role of preferential policies in a globalizing world: Evidence from India. CDE WP. (267).
- Easterly, W. (2001). Can institutions resolve ethnic conflict? Economic Development and Cultural Change, 49(4), 687–706.10.1086/452521
- Easterly, W., & Levine, R. (1997). Africa’s growth tragedy: Policies and ethnic divisions. The Quarterly Journal of Economics, 112(4), 1203–1250.10.1162/003355300555466
- Elbadawi, I., & Sambanis, N. (2002). How much war will we see? Explaining the prevalence of civil war. Journal of Conflict Resolution, 46(3), 307–334.10.1177/0022002702046003001
- Fum, R. M., & Hodler, R. (2010). Natural resources and income inequality: The role of ethnic divisions. Economics Letters, 107(3), 360–363.10.1016/j.econlet.2010.03.008
- Gisselquist, R. M., Leiderer, S., & Ni˜no-Zaraz′ua, M. (2016). Ethnic heterogeneity and public goods provision in Zambia: Evidence of a subnational ‘diversity dividend’. World Development, 78, 308–323.10.1016/j.worlddev.2015.10.018
- Lee, A. (2017). Ethnic diversity and ethnic discrimination: Explaining local public goods provision. Comparative Political Studies, p. 001041401774060.10.1177/0010414017740604
- Lustig, N. (2012). Taxes, transfers, and income redistribution in Latin America. World Bank-Inequality in Focus, 1(2), 1–5.
- Miguel, E., & Gugerty, M. K. (2005). Ethnic diversity, social sanctions, and public goods in Kenya. Journal of Public Economics, 89(11–12), 2325–2368.10.1016/j.jpubeco.2004.09.004
- Munshi, K., & Rosenzweig, M. (2016). Networks and misallocation: Insurance, migration, and the rural-urban wage gap. American Economic Review, 106, 46–98
- Murshed, S. M., & Gates, S. (2005). Spatial-horizontal inequality and the maoist insurgency in Nepal. Review of Development Economics, 9(1), 121–134.10.1111/j.1467-9361.2005.00267.x
- Persson, T., & Tabellini, G. (1992). Growth, distribution and politics. European Economic Review, 36(2–3), 593–602.10.1016/0014-2921(92)90117-F
- Seery, E. (2014). Working for the many: Public services fight inequality. Oxford: Oxfam International.
- Shorrocks, A., & Wan, G. (2005). Spatial decomposition of inequality. Journal of Economic Geography, 5(1), 59–81.
- Singh, P. (2011). We-ness and welfare: A longitudinal analysis of social development in Kerala, India. World Development, 39(2), 282–293.10.1016/j.worlddev.2009.11.025
- Singh, P., & vom Hau, M. (2016). Ethnicity in time: Politics, history, and the relationship between ethnic diversity and public goods provision. Comparative Political Studies, 49(10), 1303–1340.10.1177/0010414016633231
- Suryanarayan, P. (2017). When do the poor vote for the right-wing and why: Status inequality and vote choice in the Indian states (No. 2017/20). WIDER Working Paper.
- Topalova, P. (2010). Factor immobility and regional impacts of trade liberalization: Evidence on poverty from India. American Economic Journal: Applied Economics, 2(4), 1–41.
- Verbist, G., Förster, M., & Vaalavuo, M. (2012). The impact of publicly provided services on the distribution of resources: Review of new results and methods. OECD Social, Employment and Migration Working Papers, No. 130. Paris: OECD Publishing.10.1787/1815199X
- Zacharias, A., & Vakulabharanam, V. (2011). Caste stratification and wealth inequality in India. World Development, 39(10), 1820–1833.10.1016/j.worlddev.2011.04.026