
ABSTRACT
Knowledge is scarce on parental satisfaction with the inclusion of children with disabilities in physical education (PE). This study explored how parents’ satisfaction with inclusion in PE was associated with parental and child interpersonal and intrapersonal characteristics. Seventy-two parents of children with disabilities participated in the survey-based study. The results of the ordinary least square regression (OLS) and quantile regression (QR) indicated that the parents’ satisfaction with social inclusion in PE was associated with their attitudes towards inclusion in PE, perceived PE-related information sharing, and the type of disability and degree of physical inclusion. Parents’ satisfaction with pedagogical inclusion of children in PE was associated with their attitudes towards inclusion in PE, PE-related information sharing, and the children’s degrees of disability and physical inclusion. Furthermore, the QR estimates indicated that the explanatory strength of parental attitudes towards inclusion in PE varied with the degree of parental satisfaction with social and pedagogical inclusion of their children in PE. Practical and methodological implications of the findings are discussed.
Introduction
In this study, we explored parents’ satisfaction with inclusion in physical education (PE). Parental involvement in education bridges two important developmental arenas for children, namely, home and school. Research has consistently shown that parents’ involvement in school and their attitudes towards education are essential to children’s participation and learning in school (Hattie Citation2009; Fan and Chen Citation2001). The home-school interaction may thus influence the child’s motivation for schoolwork, learning, social skills, and school attainment (Nokali, Bachman, and Votrauba-Drzal Citation2010). Parents also seem to play a vital role as advocates for the participatory rights of children with disabilities in physical activity in school and beyond (An and Goodwin Citation2007; Svendby Citation2017; Wilhelmsen and Sørensen Citation2018). Yet, the parental perspective on inclusion of children with disabilities in PE has received scarce attention in previous research (Wilhelmsen and Sørensen Citation2017, Citation2018).
By building on an ecological perspective often used in physical activity research (Sallis, Bauman, and Pratt Citation1998) we combined intrapersonal (parental gender, education and attitudes, and children’s type and degree of disability), interpersonal (perceived home-school collaboration), and organisational (the child’s school grade and degree of physical inclusion) factors to better understand parents’ satisfaction with social and pedagogical inclusion in PE. In line with an ecological perspective and an interactional approach to disability, disability in this study is understood as ‘the outcome of the interaction between individual and contextual factors’ (Shakespeare Citation2006, 58).
Inspired by Goodwin, Watkinson, and Fitzpatrick (Citation2003), we defined inclusion in PE as giving all the children the opportunity to participate in general PE with their peers, with the aid and support service needed to take full advantage of the curriculum and the social, physical, and academic benefits it aims to provide. We distinguished between three distinct but interrelated dimensions of inclusion, namely physical, social, and pedagogical inclusion (Dalen Citation1994). In this study, we explored how physical inclusion, i.e. the degree to which children with disabilities are physically present in a general PE setting as opposed to receiving their PE away from the general setting, related to parental satisfaction with social and pedagogical inclusion. Physical inclusion is often emphasised as the lowest level of inclusion but is nevertheless an important first step (Pijl Citation2007).
Social inclusion refers to the interaction between children and their peers, between children and their PE teachers, as well as the children’s experiences of acceptance and belonging to the group. The social dimension is a key issue in inclusive education (Wendelborg and Tøssebro Citation2011) and is often emphasised among parents as an important criterion of educational quality (An and Goodwin Citation2007; Pijl Citation2007). In a study by An and Goodwin (Citation2007) mothers of children with Spina Bifida highly valued the social benefit of PE, although their child were not actively involved in all the activities. The importance of having friends, feeling supported, and being a legitimate participant in activities has also been stressed by children themselves (Seymour, Reid, and Bloom Citation2009; Spencer-Cavaliere and Watkinson Citation2010; Klavina and Block Citation2008). Unfortunately, children with disabilities are still at a larger risk of being socially excluded than their peers (Pijl Citation2007; Wendelborg and Tøssebro Citation2011).
The pedagogical dimension of inclusion reflects whether the organisation of PE appreciates the diversity of abilities and promotes children’s learning potential and engagement in activities. The Norwegian regulations regarding PE teacher education programmes do not outline requirements in terms of structure, content, or credits devoted to adapted PE (Lovdata Citation2013). In other words, the structure, content of, and emphasis on inclusive and/or adapted PE might vary considerably between educational institutions. Although inclusion has been a guiding principle in Norwegian education for several decades, research indicates that children with disabilities are less active in both structured and unstructured social and academic activities in the classroom and PE compared to their peers (Eriksson, Welander, and Granlund Citation2007; Svendby and Dowling Citation2013). Furthermore, the PE-specific competency among teachers who teach PE in Norwegian general schools is often low. A report from Statistics Norway (Lagerstrøm, Moafi, and Revold Citation2014) specified that less than 30% of teachers teaching PE in grades 1–7 had PE specialisation of 60 credits or more as a part of their educational background, while this percentage was 44% among teachers in grades 8–10.
Research from general education indicates that parents generally have positive attitudes towards inclusion (De Boer, Pijl, and Minnaert Citation2010). However, several parents of children with disabilities raised concerns about their child’s emotional development in general education and adequacy of resources, and expressed an overall concern that the child’s need would not be met (Elkins, van Kraayenoord, and Jobling Citation2003; Leyser and Kirk Citation2011). Few studies have explored attitudes towards inclusion in PE among parents of children with disabilities. We postulated that parental attitudes towards inclusion would be positively associated with parents’ satisfaction with inclusion in PE.
An interpersonal factor previously associated with parental perception of inclusion in PE is the communication with PE teachers, the amount of PE-related information and co-determination within the home-school collaboration (An and Hodge Citation2013; Chaapel et al. Citation2013; Columna et al. Citation2008; Perkins et al. Citation2013; Svendby Citation2017; Wilhelmsen and Sørensen Citation2018). Together, these studies indicate that the PE-related home-school collaboration is underdeveloped compared to other school subjects and with few opportunities for parents to communicate with the PE teacher. Parents have reported less satisfaction with the teachers’ communication, qualifications, and support when their child was fully physically included in PE compared to when their child was not fully included (Lee, Haegele, and Chang Citation2018). Although Lee, Haegele, and Chang (Citation2018) explored parents’ satisfaction with the PE and APE teachers, no study has systematically investigated the association between parents’ satisfaction with social and pedagogical dimensions of inclusion in PE. A better understanding of parents’ satisfaction with social and pedagogical inclusion in PE may assist the implementation, quality, and sustainability of inclusion in PE.
Purpose
To address the knowledge gaps outlined above, this study aimed to explore the relations between parental satisfaction with social and pedagogical inclusion in PE and intrapersonal characteristics of the child (e.g. type and degree of disability, gender, or school grade), parental intrapersonal characteristics (e.g. education, gender, and attitudes towards inclusion in PE), and parent’s perceptions of PE-related home-school collaboration.
Three research questions have guided the present study. First, are there differences in parental satisfaction with social and pedagogical inclusion in terms of parental and child intrapersonal characteristics? Second, how is parents’ satisfaction with social and pedagogical inclusion in PE associated with their attitudes towards inclusion in PE, perceived PE-related home-school collaboration, and their children’s degree of physical inclusion? Third, does the explanatory strength of the factors described above vary with the parents’ degree of satisfaction with inclusion? Information on how the different factors are associated with different parent subgroups depending on their level of satisfaction with inclusion in PE might help teachers to tailor their collaboration efforts accordingly.
Method
Participants
The participants included 72 parents of children with disabilities who attended general PE in Norwegian public schools. There were 51 women (71%) and 21 men (29%), whose ages ranged from 33–56 (mean = 45.22, standard deviation [SD] = 5.73). The percentage of parents with higher education (71% with one or more years of university/university college education) was higher than that reported in a recent national representative sample (Statistics Norway Citation2017). The children were in the school grades two to ten, of which 40% of the children were enrolled in primary school while 60% were enrolled in secondary school. Based on self-reports from parents, 67% of the children had a physical disability, 14% had a developmental disability, and 19% had other disabilities (including visual disability, learning disability, autism spectrum disorder [ASD], and attention deficit hyperactivity disorder [ADHD]). The parents characterised the degree of the child’s disability as follows: 7% reported a severe degree of disability; 39% reported moderate disability; 46%, a low degree of disability; and 7%, no disability. Two parents did not specify their child’s degree of disability.
Outcome variables
Satisfaction with social inclusion
To measure satisfaction with social inclusion, we designed a 10-item survey using a five-point Likert-Scale inspired by the Norwegian version of the Booth index of inclusion (Booth and Ainscow Citation2002). We explored the relations between items using the Pearson correlation. First, items with a correlation coefficient r of 0.30 or less on the marker item (i.e. ‘In PE, my child feels like part of the class’) were excluded from the analysis (three items excluded). Descriptive statistics of the items included in the scales are available upon request. A confirmatory factor analysis (CFA) of the remaining items supported the construct validity of the scale (). The eight items were averaged to construct one scale to measure satisfaction with social inclusion with sufficient reliability (α = 0.84).
Table 1. Fit indices of the confirmatory factor analyses.
Satisfaction with pedagogical inclusion
A similar process was followed for the pedagogical inclusion scale. One out of nine items was deleted as it had a low correlation with the marker item (i.e. ‘In PE, my child gets to use her abilities’). To test the factorial validity of the construct, we used CFA and post-hoc analyses to refit the construct. After deleting one item due to cross-loading above 10.00, a CFA of the remaining items supported the construct validity of the scale (). The seven items were averaged to create one scale with sufficient reliability (Cronbach’s α = 0.81).
Independent variables
Demographic scale
Participants completed a demographic scale indicating age, sex, education and birthplace (Nation). Education was measured as follows: primary school (1), high school – skilled labour (2), high school – university preparation (3), 1–3 years of higher education at university/university college (4), more than three years of higher education (5).
Type and degree of disability of the child
Two measures were used for the type and degree of disability among children. First, parents were asked to indicate their child’s degree of disability by answering the question: ‘Would you describe your child’s disability as mild (1), moderate (2), severe (3), or does the child have no disability (0)’. Due to low response in the lowest categories we dummy coded the two scales (low [none/mild] degree, 0:1; high [moderate/severe] degree, 2:3). Second, to identify the disability type, parents were asked to describe the child’s disability. The authors categorised disabilities into three categories (i.e. physical, developmental, and other) based on the descriptions.
Physical inclusion
Physical inclusion was measured using two questions: ‘How much time does your child spend in PE together with his or her peers without a disability?’ and ‘How much time does your child spend in special PE groups?’ (the second item was reversed). The parent answered on a five-point Likert-type scale (5 = always, 1 = never. Missing = unknown). The average item score was used as a measure of physical inclusion (Spearman’s Rho = 0.64).
Attitudes towards inclusion in PE
We used six items to measure parents’ attitudes towards inclusion in PE. The items were preceded by the stem ‘inclusion of children with disabilities in PE would … (i.e. “ … help children without disabilities to interact with children with disabilities”)’. The parent answered on a five-point Likert-type scale (5 = completely agree, 1 = completely disagree). The six items were averaged to create one scale with sufficient internal consistency (Cronbach’s α = 0.89) and fit ().
PE-related home-school collaboration
To measure the PE-related home-school collaboration, we developed two scales based on previous studies in Norwegian elementary schools (Nordahl Citation2000). The parents answered on a five-point Likert-type scale (5 = completely agree, 1 = completely disagree). The first scale measured PE-related information from school (i.e. ‘I am very pleased with the amount of information about my child’s development in PE shared by the school’). One item was deleted due to cross-loading (mi = 16.26). The four-item scale showed sufficient internal consistency (Cronbach’s α = 0.74) and fit. The second scale measured PE-related co-determination with four items (i.e. ‘I/we are rarely included in the discussions about my child social development’). The four-item scale showed sufficient internal consistency (Cronbach’s α = 0.71) and fit. displays the fit indices of the CFAs.
Procedures
A cross-sectional design was used in this study. Initially, we attempted to contact families with children with disabilities through a school-based nationally representative sample. However, the response rate and the diversity of disabilities among the children were low (9% response rate and a majority of the children were diagnosed with asthma). Thus, in our second attempt we used a convenience sample approach. Parents were informed about the project through a letter sent by post in collaboration with regional rehabilitation centres or verbally in parental meetings at one rehabilitation centre that specialised in adapted physical activity. Parents were given the option of responding to an online or a hard-copy version of the survey. For the online version, we used SurveyXact in which the university had a data handling agreement. The Norwegian Centre for Research Data approved the study and parents signed an informed consent form.
Data analyses
IBM SPSS statistics version 24 and R version 3.4.1 were used as platforms for the analyses. Data were investigated using descriptive statistics. Little’s (Citation1988) MCAR test indicated that the data were missing completely at random (chi-square = 2260.432, DF = 3016, Sig = 1.000). To handle the missing values in data we used the R package ‘MICE: multivariate imputation by chained equations’ (Van Buuren and Groothuis-Oudshoorn Citation2011).
For satisfaction with the social inclusion variable (skewness = −1.29, kurtosis = 1.79), the qqplot, Kolmogorov–Smirnov, and Shapiro–Wilk tests indicated that the distribution deviated from a comparable normal distribution (Field Citation2009). For satisfaction with pedagogical inclusion (skewness = –0.38, kurtosis = −0.41), only the Shapiro–Wilk test was significant. Based on Durban–Watson tests (M1 = 1.934, M2 = 1.961), covariance matrix, VIF, and tolerance statistics, and in extreme cases histogram, normal pp plots and plots of standardised residuals and predicated values indicated that both models met the assumptions of OLS. However, due to the skewed outcome variable and medium-sized sample, the results were based on bootstrapped estimates (Field Citation2009).
Using the Lavaan R package (Rosseel Citation2012), we performed CFAs to verify the factor structure of the continuous measures. The model chi-square coupled with the alternative fit indices the comparative fit index (CFI), the standardised root mean square residuals (SRMR), and the root mean square error of approximation (RMSEA) were used to evaluate the fit of scales (Byrne Citation2012). However, RMSEA measures should be interpreted with caution due to the sample size and low degree of freedom in some of the CFAs (Kenny, Kaniskan, and McCoach Citation2015).
To investigate the first and second research questions, we employed independent t tests and one-way analysis of variance (ANOVA with Bonferroni corrections for post-hoc analyses), Pearson correlation and ordinary least square regression (OLS). Lastly, to explore the third research question, we used quantile regression (QR). To perform the QR analyses, we used the quantreg R package (Koenker Citation2018).
As many readers may be unfamiliar with QR, we briefly describe the modelling approach (see Koenker and Bassett (Citation1978) for a more technical discussion). QR was developed as an extension of the linear model to estimate rates of change in different parts of the distribution of an outcome variable (Koenker and Basset Citation1978). QR was initially introduced as a more robust regression analysis with less strict assumptions. However, previous research often used the method mainly because it enables the identification of information about distribution points of the outcome variable other than the conditional mean (Seippel Citation2015). We used QR to examine whether the explanatory strength of the independent variables varied according to the degree of satisfaction with inclusion in PE on five selected quantiles of distribution, namely, the 0.10, 0.25, 0.50 (median), 0.75, and 0.90 quantiles. QR allowed us to analyse different points in the conditional distribution of satisfaction with inclusion, and thus go beyond analysing only the averaged trends in data as provided in the OLS modelling. The interpretation of the parameter estimates is the same in QR and OLS. They indicate rate of change adjusting for the effects of the other variables in the model, but in the QR models, they are defined for the specific quantiles.
Results
On average, the parents reported very positive attitudes towards inclusion in PE (mean = 4.77, SD = 0.48). In contrast, values of parental satisfaction with PE-related information (mean = 2.85, SD = 1.00) and PE-related co-determination (mean = 2.56, SD = 0.78) were quite low. indicates the range, mean, and SD of the independent variables.
Table 2. Range, mean and SD of parent and child characteristics.
Looking at the outcome variables in , parental satisfaction with social inclusion (mean = 4.00, SD = 0.84) and pedagogical inclusion (mean = 3.80, SD = 0.83) was relatively high, yet slightly lower than the 0.50 quantile for both outcomes. For social inclusion, the 0.10 quantile represents low satisfaction, the 0.25 quantile represents neutral satisfaction, and the 0.50–0.90 quantiles represent high satisfaction. For pedagogical inclusion, the 0.10 quantile represents low satisfaction, the 0.25–0.50 quantiles represent neutral satisfaction, and the 0.75–0.90 quantiles represent high satisfaction.
Table 3. Quantiles, range, and means and standard deviation of outcome variables, n = 72.
Differences in intrapersonal characteristics and satisfaction with inclusion in PE
Independent t tests yielded no group differences between mothers and fathers, parents with higher or lower educational level, having a son or daughter, or having children in primary or secondary schools.
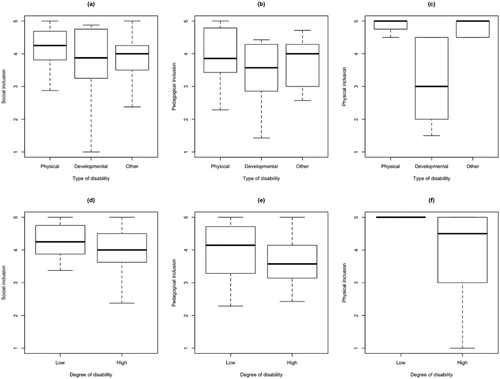
displays boxplots of the differences in parental satisfaction with social and pedagogical inclusion and the children’s degree of physical inclusion based on the children’s type and degree of disability. Boxplots (a), (b), and (c) indicate the relationships between the disability type and the dimensions of inclusion. One-way ANOVA and post-hoc analyses indicated that the only significant (p < 0.05) differences were between the child’s type of disability and degree of physical inclusion in PE. As indicated by boxplot (c), children with developmental disabilities were less physically included in PE than children with other types of disabilities. Furthermore, as indicated in boxplots (d) and (e), no significant group differences were found in terms of the degree of disability and parental satisfaction with social or pedagogical inclusion. However, as displayed in boxplot (f), independent t tests indicated that children with a low degree of disability were more physically included in PE (mean = 4.75, SD = 0.62) than children with a high degree of disability (mean = 4.01, SD = 1.32). There appeared to be group differences in terms of the children’s type and degree of disability on levels of physical inclusion but not on parental satisfaction with social and pedagogical inclusion.
Figure 1. (a–c) Boxplots of median and standard deviations of type of disability on the inclusion outcomes. (d–f) Boxplots of median and standard deviations of degree of disability on the inclusion outcomes.
displays the correlations between the continuous variables. All variables were significantly and positively associated with social and pedagogical inclusion. We also observed a strong association between parental satisfaction with social and pedagogical inclusion, and moderate associations between physical and social inclusion and physical and pedagogical inclusion (Cohen Citation1992). These results supported our assumption that the dimensions of inclusion in PE are interrelated. All independent variables showed moderate or strong correlations with the outcome variables, and the majority of the correlations between the independent variables were low, except the moderate strength association between the two home-school collaboration variables (Cohen Citation1992).
Table 4. Pearson correlation between the continuous variables.
Satisfaction with social inclusion
In this section, we present the OLS model results and QR estimates of the relations between parental satisfaction with social inclusion and their attitudes towards inclusion in PE, PE-related information, and children’s type of disability and physical inclusion. Children’s degree of disability and PE-related co-determination did not contribute to the model. The variables were removed for reasons of parsimony . The OLS model of parental satisfaction with social inclusion indicated positive associations with their attitudes towards inclusion, perceived PE-related information sharing, and the child’s degree of physical inclusion. The association with children’s type of disability indicated that parents of children with other types of disabilities were less satisfied with social inclusion in PE than parents of children with physical disabilities. Combined, the variables explained 55% of the variance in parental satisfaction with social inclusion. (a) shows the QR estimates for attitudes towards inclusion, (b) shows the QR estimates for PE-related information sharing, and (c) shows the QR estimates for the type of disability (others) on parental perception of social inclusion, when controlled for other variables. The points represent the 0.10, 0.25, 0.50, 0.75, and 0.90 QR estimates – filled when significant at p < 0.05 and open when insignificant. The horizontal line represents the OLS estimate––black when significant at p < 0.05 and grey when insignificant.
Figure 2. (a-c) Effects of (a) attitudes towards inclusion, (b) PE-related information, and (c) type of disability (Others) on social inclusion. Quantile and OLS regression coefficients. QR: Points and whole line: filled points = significant effects, open points = not significant. OLS: whole line: black when significant, otherwise grey.
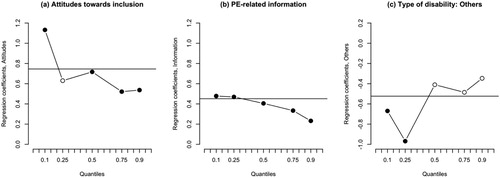
Table 5. Final model of social inclusion. OLS and QR.
(a) indicated that both the strength and significance of the associations between parent’s attitudes and satisfaction with social inclusion varied according to the degree of satisfaction among the parents. The QR estimates indicated that the positive effect of parents’ attitudes towards inclusion decreased with increased satisfaction. However, the association was insignificant at 0.25 quantile. Similarly, (b) indicated that the importance of PE-related information decreased with increased parental satisfaction with social inclusion.
Figure c suggested noteworthy differences across different points on the condition distribution of parent satisfaction with social inclusion. The QR estimates of type of disability indicated that the difference in satisfaction with social inclusion among parents of children categorised as having other types of disabilities and parents of children with physical disability was only significant at the lower level of the distribution. This information is lost in the OLS model. Thus, comparing the results from the OLS model and the QR estimates in Figure c revealed that the OLS model overestimated the influence of the type of disability among the parents that were satisfied with social inclusion in PE.
Pedagogical inclusion
The final OLS model explained the 58% variance of parental satisfaction with pedagogical inclusion. The OLS analysis indicated positive associations between parental satisfaction with pedagogical inclusion and their attitudes towards inclusion, and perceived PE-related information sharing with the school. We also saw a significant negative interaction between physical inclusion and degree of disability on parental satisfaction with pedagogical inclusion. Parents’ experiences of PE-related co-determination and children’s type of disability were not significantly associated with parent satisfaction with pedagogical inclusion when the other variables were controlled for, and therefore were left out of the model .
Table 6. Final model of pedagogical inclusion. OLS and QR.
(a) illustrates the interaction effect. For parents of children with a low degree of disability, the dotted line indicated a positive linear relationship between physical inclusion and parental satisfaction with pedagogical inclusion. Yet, for parents of children with a high degree of disability (whole line), the relationships indicated a distinct depression in satisfaction with pedagogical inclusion when the child was physically included to some degree, and a similar decline in satisfaction for children who had part or full physical inclusion included in PE. Considering the effect of attitudes towards inclusion across quantiles in (b), we saw that the only significant association between attitudes and satisfaction with pedagogical inclusion was at the lower bounds of the distribution (0.10–0.50 quantiles). Although insignificant, the estimates of the higher quantiles in the distribution suggested that the effect of attitudes towards inclusion decreased with increased parental satisfaction with pedagogically inclusion.
Figure 3 (a). Effect of the interaction between physical inclusion and degree of disability in the OLS model. Dotted line = low degree of disability, whole line = high degree of disability. (b-c) Effects of (b) attitudes towards inclusion, and (c) PE-related information on pedagogical inclusion. Quantile and OLS regression coefficients. QR: Points and whole line: filled points = significant effects, open points = not significant. OLS: whole line: black when significant, otherwise grey.
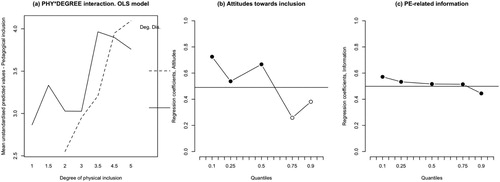
The PE-related information-sharing variable displayed in (c) indicated that the results from the QR parallel the relations indicated by the OLS model. In other words, the strength and significance of the associations between PE-related information and satisfaction with pedagogical inclusion were similar across the quantiles measured.
Summary of main results
The results indicated differences in the children’s type and degree of disability and the level of physical inclusion in PE as reported by the parents. Children with developmental disabilities were less physically included in PE than children with other types of disabilities, and children with a low degree of disability were more physically included in PE than children with a high degree of disability. Parental satisfaction with social inclusion in PE was associated with parental attitudes towards inclusion in PE, perceived PE-related information sharing, and children’s type of disability and degree of physical inclusion. The QR estimates indicated that the importance of PE-related information decreased with increased parental satisfaction with social inclusion and that the difference in satisfaction with social inclusion among parents of children categorised as having other types of disabilities and parents of children with a physical disability was only significant at the lower level of the distribution. Parents’ satisfaction with pedagogical inclusion in PE was associated with parents’ attitudes towards inclusion in PE, PE-related information sharing, and children’s degree of disability and physical inclusion. Finally, the QR estimates indicated that the effect of attitudes towards inclusion decreased with increased parental satisfaction with pedagogically inclusion.
Discussion
The aim of this study was to identify the associations between parental satisfaction with social and pedagogical inclusion in PE and parental characteristics (e.g. education, gender, and attitudes towards inclusion in PE), child characteristics (e.g. type and degree of disability, gender, and school grade), and parents’ perceptions on PE-related home-school collaboration. To answer the research question, we applied OLS and QR analyses. In accordance with socio-ecological perspectives, multiple levels of factors influenced parental satisfaction with inclusion in PE. Furthermore, the relevance of the different factors depended upon the degree of satisfaction among the parents. In the following, the associations between parental satisfaction with social and pedagogical inclusion in PE and interpersonal, intrapersonal, and contextual factors are discussed in greater detail.
Interaction between child intrapersonal characteristics and physical inclusion
In terms of degree of physical inclusion, we found that children with a high degree of disability were less physically included than children with less degree of disability, and children with developmental disabilities were less included than children with physical or other types of disabilities. These results are line with research findings from general education showing that children with intellectual and multiple disabilities and children with severe disabilities are more often taken out of the general classroom (Wendelborg and Tøssebro Citation2008, Citation2011). The degree to which children were physically included was also significantly associated with parents’ perception of pedagogical inclusion in PE. Thus, partly or fully segregated PE programmes might hinder children in gaining access to the same physical and academic benefits as their peers. Partly segregated PE may also decrease the amount of effort PE teachers invest in inclusive PE programmes and subsequently in the child’s learning in PE. Similarly, the positive association between parental satisfaction with social inclusion and the children’s degree of physical inclusion indicated that the degree of participation in PE may influence children’s opportunities to develop positive relations with peers and teachers. This is in line with findings from general educational settings (Wendelborg and Tøssebro Citation2011), which found that type and degree of disability reduced a child’s social participation with peers indirectly through degree of classroom participation and educational support.
Furthermore, the OLS results indicated that the type and degree of disability were associated differently with parental satisfaction with social and pedagogical inclusion in PE. We found no significant association between the child’s degree of disability and parental satisfaction with social inclusion. However, the final regression models indicated that there were differences in terms of the children’s type of disability among the parents who were least satisfied with social inclusion in PE. Specifically, parents of children with other types of disabilities (i.e. visual disability, learning disability and ASD, and ADHD) were less satisfied than parents of children with physical disabilities, with the social inclusion in PE. However, this association was not significant among the parents who were moderately or highly satisfied. These findings are slightly different from previous research, which found that parental reports of children’s social participation with peers were not directly influenced by the type or degree of disability but indirectly via physical inclusion and educational support (Wendelborg and Tøssebro Citation2011).
The interaction between children’s degree of disability and physical inclusion and its association with parental satisfaction with social inclusion indicated a linear relationship between physical inclusion and parental satisfaction among parents of children with a low degree of disability. However, for parents of children with a high degree of disability, the relationship indicated a more complex picture in which the parents of children who were completely segregated or had some degree of physical inclusion are the least satisfied. One interpretation is that children with a high degree of disability who were physically included only to some degree represent a group of children that fall in between – these children do not receive a well-developed segregated adapted PE programme nor do they receive adequate accommodation in the general PE lessons. This in-between educational arrangement might increase the dependency on well-developed strategies for communication and planning among the teacher in charge of adapted and general PE. Based on previous research, we see that these educational transitions are often perceived as particularly challenging in terms of communication, planning, and support (Tso and Strnadová Citation2017; Wilhelmsen and Sørensen Citation2018).
The practical implications of the findings warrant further reflections. First, PE teachers need to appreciate that children with different types of disabilities have different needs in terms of social competence, friendship, and interpersonal relations. Frequent social interaction does not necessarily lead to positive peer interaction teachers or peers (Place and Hodge Citation2001; Wendelborg and Tøssebro Citation2011). Second, partly segregated PE programmes, often in the form of physiotherapy or rehabilitation training, may create an in-between situation that negatively influences the coherence and progress in the child’s learning. However, more research is needed to better understand how moving in between the segregated and general PE settings may influence children’s participation and learning in PE.
Parents’ intrapersonal characteristics
In line with previous research in general education, parents reported very positive attitudes towards inclusion in PE (De Boer, Pijl, and Minnaert Citation2010). Parents’ attitudes were the only parental intrapersonal characteristic significantly associated with parental satisfaction with social and pedagogical inclusion in PE. Given that parents play a large role in deciding the educational placement of their child, positive attitudes towards inclusion are an important factor for realising inclusion in PE. Differences in the association between attitudes and satisfaction with pedagogical inclusion indicated that parental attitudes might be of more concern among the parents with low and neutral satisfaction with pedagogical inclusion, than among parents with high satisfaction.
Interpersonal characteristics: PE-related information and co-determination
Parents’ satisfaction with social and pedagogical inclusion in PE was consistently associated with parents’ perceptions of the PE-related information sharing. These findings emphasise the importance of PE-related information sharing between home and school (Perkins et al. Citation2013; Svendby Citation2017; Wilhelmsen and Sørensen Citation2018). Based on the percentages of parents wanting more opportunities to talk to the PE teacher, it is reasonable to assume that strengthened PE-related information sharing could enhance parental engagement in and their satisfaction with inclusion in PE.
In terms of practical implications, parents, with their expert knowledge on their children’s skills and abilities in different physical activity settings, represent an important resource for PE teachers. Parents are dependent upon the school to receive information about their child’s enjoyment and development in PE in order to make informed decisions on behalf of their child. The insignificant relations between perceived PE-related co-determination and parents’ satisfaction with inclusion in PE may indicate that parents have limited opportunities to get involved in their child’s education in PE. These findings resonate well with previous research (Perkins et al. Citation2013; Svendby Citation2017; Wilhelmsen and Sørensen Citation2018), which has shown a lack of communication between parents and PE teachers. Alternative explanations may be that parents do not expect to be consulted in PE-related matters. More attention to PE-related communication can enhance PE teachers’ insight into the children’s need and make them more prepared to support the development of children with different abilities within the larger group of children.
Strengths and limitations of the study and suggestions for further research
This study illuminated relations about which we have scarce knowledge. The QR allowed us to explore the strength of the associations between antecedents of parents’ satisfaction with inclusion in PE at different points of the conditional distribution. This is important considering that increased understanding of how intrapersonal, interpersonal, and contextual factors influence parental satisfaction with inclusion in PE depending on their initial degree of satisfaction might facilitate tailored educational interventions.
The results from this study should be interpreted with caution. First, the use of a convenience sample of parents and the cross-sectional nature of the data restricts our ability to make causal inferences. Second, we could not test the combined structural validity of the dimensions of inclusion in PE due to the limitation in sample size. Thus, further research is needed to test the relationship between the dimensions of inclusion in PE.
Second, although parents of children of disabilities are likely to know more about their child’s everyday life in school compared to other parents (Ytterhus, Wendelborg, and Lundeby Citation2008), this might not be the case in the PE setting. Based on the parents’ reports on the amount of PE-related information they receive from school, it is reasonable to question parents’ awareness of what goes on in PE, and subsequently how meaningful the distinction between social and pedagogical inclusion is for the parents. Thus, while parental satisfaction with inclusion in PE likely relates to children’s experience of inclusion, it is not necessarily in agreement with the child’s own satisfaction with inclusion. Parental satisfaction with inclusion in PE is a desirable aim, but it should not be mistaken for being a measure of successful inclusion in PE. For example, sociometric studies have been shown to present a more sombre picture of friendship in class compared to the perspectives of teacher and parents (Pijl Citation2007). Furthermore, we need more qualitative interview studies with parents and PE teachers that explores parental satisfaction with inclusion in PE and PE teachers’ satisfaction with facilitating an inclusive PE environment.
Finally, the categorisation of disability is problematic. Previous research clearly indicates that the way we measure disability influences our results (Molden and Tøssebro Citation2012). The diversity among parents in terms of children’s type and degree of disability is a strength of the study. Yet, it is important to note that disability groups are gross categorisations of the children’s main disability, and may not reflect the variation between and within groups as well as more specific categorisations would. As an example, while cerebral palsy (CP) is categorised as a physical disability, several children with CP might also have cognitive difficulties. We need more research exploring the complex interrelations between intrapersonal, interpersonal, and contextual factors to secure optimal social and academic development in inclusive PE settings for all children.
Conclusion
This study explored the associations between parental satisfaction with inclusion in PE and intrapersonal, interpersonal, and organisational factors. Parental satisfaction with social inclusion in PE was associated with parental attitudes towards inclusion in PE, perceived PE-related information sharing, and children’s type of disability and degree of physical inclusion, while parental satisfaction with pedagogical inclusion in PE was associated with parents’ attitudes towards inclusion in PE, PE-related information sharing, and children’s degree of disability and physical inclusion. Finally, changes in explanatory strength of the individual variables depending on parents’ satisfaction with inclusion indicated that increased focus on PE-related information sharing between home and school would be an important first step to improve parents’ satisfaction with inclusion in PE. A better understanding of these relations might contribute to enhancing the quality of instruction and inclusion of children with disabilities in PE.
Supplemental_file_REVISED.docx
Download MS Word (71.2 KB)Disclosure statement
No potential conflict of interest was reported by the authors.
Additional information
Notes on contributors
Terese Wilhelmsen
Terese Wilhelmsen is a Ph.D. student in the Department of Coaching and Psychology at The Norwegian School of Sport Sciences, Oslo, Norway. Terese's primary area of research has been studying the philosophy of inclusive education and inclusion of individuals with disability in physical education.
M. S. Sørensen
M. S. Sørensen is a professor in the Department of Coaching and Psychology at The Norwegian School of Sport Sciences, Oslo, Norway. Marit's areas of expertise are inclusion of individuals with disability in sport and physical education, motivation for sport and exercise, and physical activity and mental health. She has extensive experience from International collaboration, publishing and also organisational work with the aim to promote a physically active lifestyle in health and educational contexts.
Ø. Seippel
Ø. Seippel is a professor in the Department of Cultural and Social Studies at The Norwegian School of Sport Sciences, Oslo, Norway. His areas of expertise are sociology of sport, sport politics, volunteerism and professionalization, social capital, physical activity and social inequality.
M. E. Block
M. E. Block is a professor in the Department of Kinesiology at the University of Virginia. He has extensive experience in teaching in the areas of Kinesiology for Individuals with Disabilities (adapted physical education) and motor development and consulting work with Special Olympics, Inc. His primary area of research has been on studying the philosophy of including students with disabilities in general physical education as well as the practical aspects of helping general physical educators include students with disabilities in general physical education.
References
- An, J., and D. L. Goodwin. 2007. “Physical Education for Students with Spina Bifida: Mothers’ Perspectives.” Adapted Physical Activity Quarterly 24 (1): 38–58. doi: 10.1123/apaq.24.1.38
- An, J., and S. R. Hodge. 2013. “Exploring the Meaning of Parental Involvement in Physical Education for Students with Developmental Disabilities.” Adapted Physical Activity Quarterly 30 (2): 147–163. doi: 10.1123/apaq.30.2.147
- Booth, T., and M. Ainscow. 2002. Index for Inclusion: Developing Learning and Participation in Schools. Bristol: Centre for Studies on Inclusion Education.
- Byrne, B. M. 2012. Structural Equation Modeling with Mplus. New York: Routledge.
- Chaapel, H., L. Columna, R. Lytle, and J. Bailey. 2013. “Parental Expectations About Adapted Physical Education Services.” The Journal of Special Education 47 (3): 186–196. doi: 10.1177/0022466912447661
- Cohen, J. 1992. “A Power Primer.” Quantitative Methods in Psychology 112 (1): 155–159.
- Columna, L., J. Pyfer, T. Senne, L. Velez, N. Bridenthrall, and M. Y. Canabal. 2008. “Parental Expectations of Adapted Physical Educators: a Hispanic Perspective.” Adapted Physical Activity Quarterly 25 (3): 228–246. doi: 10.1123/apaq.25.3.228
- Dalen, M. 1994. Så Langt det er Mulig og Forsvarlig: Integrering av Funksjonshemmede i Grunnskolen. [ As far as it is possible and professional advisable: Integration of individuals with disabilities in school]. Oslo: Universitetsforlaget.
- De Boer, A., S. J. Pijl, and A. Minnaert. 2010. “Attitudes of Parents Towards Inclusive Education: a Review of the Literature.” European Journal of Special Needs Education 25 (2): 165–181. doi:10.1080/08856251003658694.
- Elkins, J., C. E. van Kraayenoord, and A. Jobling. 2003. “Parents’ Attitudes to Inclusion of Their Children with Special Needs.” Journal of Research in Special Educational Needs 3: 122–129. doi:10.1111/1471-3802.00005.
- Eriksson, L., J. Welander, and M. Granlund. 2007. “Participation in Everyday School Activities for Children with and Without Disabilities.” Journal of Developmental and Physical Disabilities 19 (5): 485–502. doi: 10.1007/s10882-007-9065-5
- Fan, X., and M. Chen. 2001. “Parental Involvement and Students’ Academic Achievement: A Meta-Analysis.” Educational Psychology Review 13 (1): 1–22. doi: 10.1023/A:1009048817385
- Field, A. 2009. Discovering Statistics Using SPSS. 3rd ed. London: Sage Publications.
- Goodwin, D. L., J. E. Watkinson, and D. A. Fitzpatrick. 2003. “Inclusive Physical Education.” In Adapted Physical Activity, edited by R. D. Steadward, G. D. Wheeler, and J. E. Watkinson, 189–209. Alberta: The University of Alberta Press.
- Hattie, J. 2009. Visible Learning: A Synthesis of Over 800 Meta-Analyses Relating to Achievement. Abingdon: Routledge.
- Kenny, A. D., B. Kaniskan, and B. McCoach. 2015. “The Performance of RMSEA in Models with Small Degrees of Freedom.” Sociological Methods & Research 44 (3): 486–507. doi:10.1177/0049124114543236.
- Klavina, A., and M. E. Block. 2008. “The Effect of Peer Tutoring on Interaction Behaviors in Inclusive Physical Education.” Adapted Physical Activity Quarterly 25: 132–158. doi:10.1123/apaq.25.2.132.
- Koenker, R. 2018. Package ‘Quantreg’: Quantile Regression, R package version 5.35, URL: https://cran.r-project.org/web/packages/quantreg/quantreg.pdf.
- Koenker, R., and G. Basset Jr. 1978. Regression Quantiles. Econometrica 46(1): 33–50. doi: 10.2307/1913643
- Lagerstrøm, B.O., H. Moafi, and M. K. Revold. 2014. Kompetanseprofil i Grunnskolen [ Competency profiles in elementary schools]. Oslo: Statistics Norway.
- Lee, J., J. A. Haegele, and S. H. Chang. 2018. “Satisfaction of Parents of Children with Autism Spectrum Disorder Towards Physical Education Teachers.” The Physical Educator 74 (4): 715–729. doi:10.18666/TPE-2017-V74-I4-7245.
- Leyser, Y., and R. Kirk. 2011. “Parents’ Perspectives on Inclusion and Schooling of Students with Angelman Syndrome: Suggestion for Educators.” International Journal of Special Education 26 (2): 79–91.
- Little, R. J. A. 1988. “A Test of Missing Completely at Random for Multivariate Data with Missing Values.” Journal of the American Statistical Association 83 (404): 1198–1202. doi: 10.1080/01621459.1988.10478722
- Lovdata. 2013. The Norwegian Regulations Related to the Framework Plan for the Three Years Teacher Education Program in Practical and Aesthetic Subjects. Lovdata. Accessed January 25, 2019. https://lovdata.no/dokument/SF/forskrift/2013-03-18-290.
- Molden, T. H., and J. Tøssebro. 2012. “Disability Measurements: Impact on Research Results.” Scandinavian Journal of Disability Research 14 (4): 340–357. doi:10.1080/15017419.2011.621654.
- Nokali, N. E. E., H. J. Bachman, and E. Votrauba-Drzal. 2010. “Parent Involvement and Children’s Academic and Social Development in Elementary School.” Child Development 81 (3): 988–1005. doi:10.1111/j.1467-8624.2010.01447.x.
- Nordahl, T. 2000. Samarbeid mellom hjem og skole – en kartleggingsundersøkelse [Collaboration between home and school - a mapping study]. Oslo: NOVA
- Perkins, K., L. Columna, L. Lieberman, and J. Bailey. 2013. “Parents’ Perceptions of Physical Activity for Their Children with Visual Impairments.” Journal of Visual Impairments and Blindness 107 (2): 131–142. doi: 10.1177/0145482X1310700206
- Pijl, S. J. 2007. “Introduction: the Social Position of Pupils with Special Needs in Regular Education.” European Journal of Special Needs Education 22 (1): 1–5. doi:10.1080/08856250601082133.
- Place, K., and S. R. Hodge. 2001. “Social Inclusion of Students with Physical Disabilities in General Physical Education: a Behavioral Analysis.” Adapted Physical Activity Quarterly 18: 389–404. doi:10.1123/apaq.18.4.389.
- Rosseel, Y. 2012. “lavaan: An R Package for Structural Equation Modeling.” Journal of Statistical Software 48 (2): 1–36. URL http://www.jstatsoft.org/v48/i02/. doi: 10.18637/jss.v048.i02
- Sallis, J. F., A. Bauman, and M. Pratt. 1998. “Environmental and Policy Intervention to Promote Physical Activity.” American Journal of Preventive Medicine 15 (4): 379–397. doi: 10.1016/S0749-3797(98)00076-2
- Seippel, Ø. 2015. “Physical Exercise and Social Inequality in Norway – A Comparison of OLS and Quantile Regression Analysis.” European Journal for Sport and Society 12 (4): 355–376. doi:10.1080/16138171.2015.11730363.
- Seymour, H., G. Reid, and G. A. Bloom. 2009. “Friendship in Inclusive Physical Education.” Adapted Physical Activity Quarterly 26: 201–219. doi:10.1123/apaq.26.3.201.
- Shakespeare, T. 2006. Disability Rights and Wrongs. Abingdon: Routledge.
- Spencer-Cavaliere, N., and E. J. Watkinson. 2010. “Inclusion Understood From the Perspectives of Children with Disability.” Adapted Physical Activity Quarterly 27: 275–293. doi: 10.1123/apaq.27.4.275
- Statistics Norway. 2017. Befolkningens Utdanningsnivå [ Educational level in the population]. Oslo: Statistics Norway. Accessed February 02, 2017. URL: https://www.ssb.no/utdanning/statistikker/utniv/aar
- Svendby, E. B. 2017. “Fra åpen dør til å Stange Hodet i Veggen [From Open Door to Banging the Head Against the Wall].” Spesialpedagogikk 3: 39–52.
- Svendby, E. B., and F. Dowling. 2013. “Negotiating the Discursive Spaces of Inclusive Education: Narratives of Experience From Contemporary Physical Education.” Scandinavian Journal of Disability Research 15 (4): 361–378. doi: 10.1080/15017419.2012.735200
- Tso, M., and I. Strnadová. 2017. “Students with Autism Transitioning From Primary to Secondary Schools: Parents’ Perspectives and Experiences.” International Journal of Inclusive Education 21 (4): 389–403. doi:10.1080/13603116.2016.1197324.
- Van Buuren, S., and K. Groothuis-Oudshoorn. 2011. “Mice: Multivariate Imputation by Chained Equations in R.” Journal of Statistical Software 45 (3): 1–67. http://www.jstatsoft.org/v45/i03/.
- Wendelborg, C., and J. Tøssebro. 2008. “School Placement and Classroom Participation among Children with Disabilities in Primary School in Norway: a Longitudinal Study.” European Journal of Special Needs Education 23 (4): 305–319. doi:10.1080/08856250802387257.
- Wendelborg, C., and J. Tøssebro. 2011. “Educational Arrangements and Social Participation with Peers Amongst Children with Disabilities in Regular Schools.” International Journal of Inclusive Education 15 (5): 497–512. doi:10.1080/13603110903131739.
- Wilhelmsen, T., and M. Sørensen. 2017. “Inclusion of Children With Disabilities in Physical Education: A Systematic Review of Literature From 2009 to 2015.” Adapted Physical Activity Quarterly 34: 311–337. doi: 10.1123/apaq.2016-0017
- Wilhelmsen, T., and M. Sørensen. 2018. “Physical Education-Related Home–School Collaboration: The Experiences of Parents of Children with Disabilities.” European Physical Education Review. doi: 1356336X18777263
- Ytterhus, B., C. Wendelborg, and H. Lundeby. 2008. “Managing Turning Points and Transition in Childhood and Parenthood–Insights From Families with Disabled Children in Norway.” Disability & Society 23 (6): 625–636. doi: 10.1080/09687590802328535