
 ?Mathematical formulae have been encoded as MathML and are displayed in this HTML version using MathJax in order to improve their display. Uncheck the box to turn MathJax off. This feature requires Javascript. Click on a formula to zoom.
ABSTRACT
Within educational and social discourses, the term ‘inclusion’ has various meanings. In both research and practice, there is no official definition of inclusion. Nevertheless, subjective definitions affect pedagogical acts. We developed the Definitions of Inclusion Questionnaire [Fragebogen zur Erfassung subjektiver Definitionen von Inklusion] (FEDI) as an economic instrument that takes subjective definitions of inclusion into account. This paper describes the construction and first psychometric evaluation of the questionnaire instrument that 513 participants with various professional backgrounds completed. We used exploratory and confirmatory factor analyses of two different subsamples to identify the measuring model. We found a three-factor structure with acceptable-to-good fit measures and an acceptable reliability (CR from .81 to .87). Small to medium correlations of the FEDI scales with attitudes towards inclusion and teachers’ sense of efficacy suggest that discriminant validity is given. Perspectives for further research and implications for practice are discussed.
Introduction
As Grosche (Citation2015) and Piezunka, Schaffus, and Grosche (Citation2017) argue, no distinct, accurate, and overall valid definition of inclusion (or inclusive education) exists, especially in the German context, which leads to problems for practitioners and researchers when planning, coordinating, and discussing inclusion-oriented processes (see also Werning Citation2010). Furthermore, discussing inclusion from different perspectives of understanding without acknowledging the differences may lead to the depreciation of others’ views (Grosche Citation2017a, Citation2017b). Although numerous papers have tried to define inclusion systematically (Ainscow, Booth, and Dyson Citation2006; Farrell et al. Citation2007; Fuchs and Fuchs Citation1998; Göransson and Nilholm Citation2014; Kavale and Forness Citation2000; Loreman Citation2014), definitions remain diverse.
Data from inclusion research containing descriptions of, attitudes towards, or beliefs about inclusion may be influenced by implicit or subjective definitions. Lüke and Grosche (Citation2018c) showed that participants’ attitudes towards inclusion are highly influenced by the perceived attitudes of the surveying organisation. Although this relates to social desirability, it indicates that anticipated, but not explicitly given, definitions of inclusion may bias findings.
‘Subjective’ definitions refer to subjective theories that Mandl and Huber (Citation1983, 98) define as a ‘system of cognitions that in its structure is seen as comparable to a scientific theory’ on a specific topic. Until now, the subjective definitions of inclusion have not been considered sufficiently in research (Przibilla, Linderkamp, and Krämer Citation2018).
Several studies have used qualitative approaches to gather data about subjective inclusion definitions. Makoelle (Citation2014) identified three ways to define inclusion, and Przibilla, Linderkamp, and Krämer (Citation2018) identified 27 categories for teachers’ subjective definitions of inclusion and arranged them into nine dimensions.
Another qualitative study by Piezunka, Schaffus, and Grosche (Citation2017) focussed on definitions from expert interviews with researchers in the field of inclusion. The interviews first asked, ‘What does inclusion mean to you?’ This was followed by questions covering goals of inclusion, forms of legitimation of inclusion, distinction from integration, inclusion target group(s), inclusion feasibility, inclusion practice, and a one-sentence summary of inclusion.
These dimensions served as categories for qualitative content analysis, from which Piezunka, Schaffus, and Grosche (Citation2017) identified four distinct definitions: (1) ‘inclusion as implementing the UN-CRPD’, (2) ‘pragmatic definition with a focus on supporting students’ individual academic progress’, (3) ‘participation/acknowledgement/well-being’, and (4) ‘inclusion as a utopia’. While these four definitions are distinct from each other, they share a consensual core (inclusion as overcoming discrimination), ‘which makes a hierarchical development within single definitions’ (Piezunka, Schaffus, and Grosche Citation2017, 216; authors’ translation). Definition (1) is the least complex, mostly referring to the placement of people with disabilities, and definition (4) is the most complex, describing people as individuals who cannot be divided into separate groups. These findings resemble the four definitions that Göransson and Nilholm (Citation2014) found in their review of international literature (see ), which they later replicated (2017). However, detailed examination finds differences between Piezunka, Schaffus, and Grosche (Citation2017) and Göransson and Nilholm (Citation2014). While both studies identify placement as the least complex and least comprehensive definition, the pragmatic definition of the former includes the meaning of both the specified and general individualised definitions of Göransson and Nilholm (Citation2014). In contrast, the community definition of Göransson and Nilholm (Citation2014) includes both the ‘participation/acknowledgement/well-being’ and ‘inclusion as a utopia’ definitions from Piezunka, Schaffus, and Grosche (Citation2017).
Table 1. Comparison of the empirical findings from Piezunka, Schaffus, and Grosche (Citation2017) and the theoretical review from Göransson and Nilholm (Citation2014).
There is additional research from Krischler, Powell, and Pit-Ten Cate (Citation2019) that references the framework from Göransson and Nilholm: They found that participants’ definitions corresponded with their attitudes towards inclusion. An open question asked participants to define inclusion and the answers were categorised by using the first three definitions of Göransson and Nilholm. Furthermore, participants filled out a quantitative measurement questionnaire concerning attitudes towards inclusion. Differences in attitudes across the three groups (placement definition, specified individualised definition, and general individualised definition) were analysed using ANOVA that ‘indicated differences in attitudes for people providing different definitions of inclusion’ (Krischler, Powell, and Pit-Ten Cate Citation2019, 639):
More specifically, people defining inclusion according to the ‘General individualised’ definition held significantly more positive attitudes than the people defining inclusion
according to the ‘Specified individualised’ definition […] and to the ‘Placement’ definition, […]. Additionally, people defining inclusion according to the ‘Specified individualised’ definition held significantly more positive attitudes than the people according to the ‘Placement’ definition […]. (Krischler, Powell, and Pit-Ten Cate Citation2019, 639)
Scheer (Citation2020) conducted qualitative interviews with school principals about their leadership roles for inclusive education. The results from qualitative content analysis indicated that principals who provided different definitions of inclusion also provided different reasoning for their measures to foster inclusive school development. Although the framework from Piezunka, Schaffus, and Grosche (Citation2017) was used in this study, the ‘pragmatic definition’ had to be split into two categories (‘focused on various lines of difference’ vs. ‘focused on special educational needs’). This reflects the ‘general individualised’ vs. ‘specified individualised’ definitions from Göransson and Nilholm (Citation2014). Beside the finding that, for actual practice, subjective definitions of inclusion seem to be powerful, this also indicates that the distinction between a ‘wide’ understanding of inclusion (‘focused on various lines of difference’ or ‘general individualised’) and a ‘narrow’ understanding of inclusion (‘focused on special educational needs’ or ‘specified individualised’) must be considered as a category of its own when developing a questionnaire to measure subjective definitions of inclusion.
In qualitative interviews with school principals, Graham and Spandagou (Citation2011) asked the participants about their approaches to inclusive education. From their analysis, Graham and Spandagou elaborate that ‘the more culturally diverse the school, the more expansive the view of inclusive education’ (Graham and Spandagou Citation2011, 227). One of the main findings was that the participants’ conceptualisation of inclusion found its expression in the distinction between ‘including them’ and ‘being inclusive’. Overall, the authors conclude that ‘school principals’ attitudes towards inclusive education and their success in engineering inclusive practices within their school are significantly affected by their own conception of what “inclusion” and “being inclusive” mean’ (Graham and Spandagou Citation2011, 233). In another study, Salisbury (Citation2006) combined measures of schools’ inclusiveness (for example, percentage of students educated outside the general education classroom) with qualitative interviews conducted with the schools’ principals:
In our sample, the views and commitment to inclusive education appeared to affect the decisions rendered by principals as they guided the development of their school’s service de-livery model. Several principals in our sample chose to view inclusive education as an agenda for reform, whereas others saw it as an exercise in compliance with LRE [least restrictive environment] provisions. (Salisbury Citation2006, 79–80)
Starczewska, Hodkinson, and Adams (Citation2012) concluded from interviews with teachers about their conceptualisation of inclusion and integration that inclusion seems to be ‘employed at the level of policy rhetoric […] [and] one of those educational buzzwords that […] says everything but says nothing’ (Starczewska, Hodkinson, and Adams Citation2012, 168). They found that teachers, when asked about inclusion, experienced a terminological ambiguity and struggled to provide a substantive definition. However, when asked about integration, the participants’ answers included more concrete measures. Thus, we can conclude that teachers should be provided with example statements so that they can evaluate how these statements reflect their understanding of inclusion. For research on inclusive education, this justifies the use of a rating scale questionnaire like the instrument described in our paper.
While the studies described in this section provide in-depth insights into subjective inclusion definitions and their importance, there is a need for an economic quantitative instrument that can capture differences in subjective definitions. This paper introduces the first version of the Definitions of Inclusion Questionnaire [Fragebogen zur Erfassung subjektiver Definitionen von Inklusion] FEDI (Egener et al. Citation2019; Scheer et al. Citation2020) and its psychometric properties. Initially, this questionnaire was developed to be independent of the personal and professional backgrounds of the respondents and to be used in a large variety of contexts (not only education). However, we see FEDI as an important tool within the context of inclusive school development research and in research on teacher education for inclusion. In these two contexts, the questionnaire can help evaluate if and how subjective understandings of inclusion affect teachers’, student teachers’, and principals’ attitudes and self-efficacy with respect to inclusive education, and provide actual measures for developing inclusive schools, which can be assumed according to the findings of Graham and Spandagou (Citation2011), Krischler, Powell, and Pit-Ten Cate (Citation2019), Salisbury (Citation2006), Scheer (Citation2020), and Starczewska, Hodkinson, and Adams (Citation2012).
Research questions
This study provides the first psychometric evaluation of the FEDI, which aims to fill the persistent gap in research regarding subjective definitions of inclusion.
Since subjective definitions of inclusion should comprise several dimensions, we assume that a valid measuring instrument should have a multifactorial structure. Thus, our first question considers:
Q1: Does a multifactorial model of subjective definitions of inclusion show a better fit than a unifactorial model?
Although Varimax-rotation forces the factors themselves to be uncorrelated, one might expect small correlations (r < .2) between the final FEDI-subscales. Inclusion, especially inclusive education, is regulated via legislation, and legislation often pertains to human rights and ethical reasoning, which leads to interactions between different aspects of subjective definitions. However, since the factorial structure is evaluated during data analysis, we cannot predict the amount of intercorrelations. Therefore, we ask:
Q2: How much do the FEDI-subscales intercorrelate?
Furthermore, a valid measurement of subjective definitions of inclusion should capture descriptive cognitions rather than evaluative beliefs and attitudes. However, some interference may occur. For instance, a prior study from Krischler, Powell, and Pit-Ten Cate (Citation2019) showed a medium main effect of participants’ definitions of inclusion on their attitudes. Furthermore, attitudes towards inclusion are associated with self-efficacy (Scheer et al. Citation2015; Urton, Wilbert, and Hennemann Citation2014; Savolainen, Malinen, and Schwab Citation2020). Thus, for evaluating discriminant validity, we suggest that there are small to medium correlations between FEDI scores and attitudes towards inclusion and teachers’ self-efficacy. Therefore, our third and fourth research questions are:
Q3: How do the FEDI-subscales correlate with attitudes towards inclusion?
Q4: How do the FEDI-subscales correlate with teachers’ self-efficacy?
Materials and methods
Sample and procedures
Using internal mailing lists from several German universities, we emailed an invitation to researchers, lecturers, and students from all faculties with a hyperlink to our questionnaire on LimeSurvey. Additionally, practitioners in the field of inclusive and special education recruited participants with a school-related perspective (QR code on handouts and posters). A total of 513 persons (417 female, 93 male, 3 diverse) participated. Many were university students (n = 426), of whom most were pursuing a teaching degree (n = 399). From those, the majority were studying special education (n = 179). See and for further details.
Table 2. Participants by professional background.
Table 3. Students from teaching degree programs by type of teaching degree.
Measures
Subjective definitions of inclusion questionnaire (FEDI)
Item pool
To construct our instrument, we used the three most general and descriptive dimensions of inclusion that Piezunka, Schaffus, and Grosche (Citation2017) used for their interview guidelines and formulated possible manifestations for each. These guidelines also reflect international research (Krischler, Powell, and Pit-Ten Cate Citation2019; Nilholm and Göransson Citation2017; Waitoller and Artiles Citation2013). We formulated the following dimensions:
Goals and aims. These are the goals and aims that a person correlates with the term inclusion, such as ‘anti-discrimination’ (prefix for items: ZA for ‘Ziele: Antidiskriminierung’), ‘effective (educational) support’ (prefix: ZF for ‘Ziele: Förderung’), ‘access to regular schools’ (prefix: ZR for ‘Ziele: Regelschule’), and ‘social and political participation’ (prefix: ZT for ‘Ziele: Teilhabe’).
Legitimation of inclusion. What a person believes provides legitimacy to inclusion, including ‘ethics’ (prefix: LE for ‘Legitimation: Ethisch’), ‘outcomes/students’ achievements’ (prefix: LO for ‘Legitimation: Outcomes’) and ‘legal’ (prefix: LR for ‘Legitimation: Rechtlich’).
Lines of difference. These are the lines of difference addressed by the term inclusion. For example, a person may feel that the term inclusion addresses ‘disability’ (prefix: DLB for ‘Differenzlinie: Behinderung’), ‘several lines of difference and/or intersectionality’ (prefix: DLU for ‘Differenzlinie: Unterschiedliche’), or ‘overcoming social construction of categories’ (prefix: DLD for ‘Differenzlinie: Dekategorisierung’).
Using the resulting ten theoretical aspects, we formulated 35 descriptive, objective statements. These statements comprise the pool of Likert-like rating items for the questionnaire. We applied a five-point rating scale with full verbalisation to the items (0 = not true, 1 = somewhat not true, 2 = partially true, 3 = rather true, 4 = true).
Pilot version
We administered the first draft to 10 university students and 20 field experts. They were asked to answer the questionnaire and give written feedback on all and/or on single items.
First revision
We revised the questionnaire based on the pilot feedback and response patterns. This version contained 39 items (see ; the German items and English translation are presented in the electronic supplementary material, ESM-1.docx).
Table 4. The complete set of items generated for the FEDI linked to their underlying dimensions.
Final version
During analysis, the questionnaire was reduced to the final 15-item version (see subsection ‘Data analysis’ for details). For this, we first eliminated all items with a relative information content H < .75. Then after a first run of factor analysis, we incorporated the five items per factor with the highest loadings into the final questionnaire (items listed in ). This version is licensed under CC-BY 4.0 (Egener et al. Citation2019; for an English version, see Scheer et al. Citation2020).
Table 5. Properties of the FEDI items linked to their FEDI scales.
Attitudes towards inclusive education
Attitudes towards inclusive education were measured using the ‘Professionsunabhängige Einstellungsskala zum inklusiven Schulsystem’ questionnaire (PREIS; ‘profession-independent attitudes towards inclusive education scale’) (Lüke and Grosche Citation2016, Citation2018b; Schulze et al. Citation2019), which was developed to measure attitudes independently from the participants’ professional backgrounds and is based on the model introduced by Eagly and Chaiken (Citation1993). Retest reliability, rtt = .96, (Lüke and Grosche Citation2018b) and internal consistency, = .93, were both high (Lüke and Grosche Citation2018b; Schulze et al. Citation2019).
Teachers’ Sense of Efficacy Scale (TSES)
The TSES (Tschannen-Moran and Woolfolk-Hoy Citation2001) was administered to participants who had a school-related professional background (n = 420) using a German translation by Sung and Melzer (Citation2014).
Data analysis
All data analysis occurred in the R language (R Core Team Citation2019) using the RStudio environment (RStudio Citation2019). See ESM-3.docx electronic supplementary material for the full R input. First, we evaluated the descriptive statistics of all FEDI items. Due to the ordinal level of raw data, we used category frequencies (0 = not true, 1 = somewhat not true, 2 = partially true, 3 = rather true, 4 = true), median (Mdn.), and inter-quartile range (IQR) as descriptive measures. Item statistics were computed using the descript function from the ltm-package in R (Rizopoulos Citation2018). Additionally, we analysed the items’ relative information content H using Equationequation 1(1)
(1) as provided by Eid and Schmidt (Citation2014), where
is the relative frequency (probability) of category j from item i, and
is the number of categories of item i. This can be expressed as follows:
(1)
(1) Items with H < .75 were eliminated from the questionnaire before further analysis.
Next, we split the original sample (see ESM-2.csv electronic supplementary material for the full dataset) to minimise any bias due to repeated testing. To generate two randomised but comparable subsamples, we used stratified randomisation.
In the first subsample, we conducted a categorical exploratory factor analysis (CEFA) with Varimax-rotation using the function fa from the psych-package in R (Revelle Citation2019). We checked the Kaiser-Meyer-Olkin and the items’ MSA based on the polychoric correlation matrix using the KMO and polychoric functions from the psych-package. To determine the number of factors to be retained, we considered Cattell’s scree test criterion (Cattell Citation1966), Kaiser’s criterion (Kaiser Citation1960) as subjective visual methods, and Velicer’s minimum average partial (MAP) criterion (Velicer Citation1976) and parallel analysis (Horn Citation1965) as objective statistical methods using the nfactors and fa.parallel functions from the psych-package. Loadings from >.4 were accepted (Field Citation2017). We then chose proper names for the factors according to the items’ content.
The CEFA factor solution was cross validated in subsample II using a categorical confirmatory factor analysis (CCFA) based on the polychoric correlation matrix. The model was specified and tested with the cfa-function from the package lavaan (Rosseel Citation2012, Citation2018) in R; for visualisation, we used the lavaanPlot-package (Lishinski Citation2018). We used DWLS as the estimator with NLMINB as the optimisation method. As fit measures, we evaluated /df-ratio, RMSEA, SRMR, CFI, and TLI with the cut-off-values provided by Moosbrugger and Schermelleh-Engel (Citation2012), Schermelleh-Engel, Moosbrugger, and Müller (Citation2003), Hu and Bentler (Citation1999), and Browne and Cudeck (Citation1992). An LRT test for nested models (Satorra Citation2000) was applied to compare the one-factor and multi-factor models, using the lavTestLRT-function from lavaan.
Measurement invariance (MIV) across university students pursuing different teaching degrees was checked using the measEq.syntax-function from the package semTools (Jorgensen et al. Citation2019), which uses the lavaan functions. According to Svetina, Rutkowski, and Rutkowski (Citation2020), we used theta-parametrisation, and the guidelines suggested by Wu and Estabrook (Citation2016). According to Chen (Citation2007), MIV is given if RMSEA increases less than .015, and CFI simultaneously decreases less than .01. Differential item functioning (DIF) was evaluated by applying a partial credit model (PCM; Masters Citation1982). We used the grm-function from the R-package pairwise to calculate the PCM (Heine Citation2020).
Since Cronbach’s underestimates true reliability if factor loadings are not equal between indicators (Cho Citation2016), we also used composite reliability (Netemeyer, Bearden, and Sharma Citation2003) as shown:
(2)
(2) wherein
is the completely standardised loading for indicator i, V(
) is the variance of the error term for indicator i, and p is the number of indicators.
Results
After a first round of analysis of the descriptive item statistics (see electronic supplement material ESM-4.docx for the descriptive statistics of all original items), items with H < .75 (13 items) were eliminated.
For the following round of analyses, we divided the total sample into two randomised and stratified subsamples as described above (see ).
Categorical exploratory factor analysis (subsample I)
With the remaining 26 items, we ran a CEFA with Varimax-rotation based on the polychoric correlation matrix, using Subsample I (see ). Kaiser-Meyer-Olkin was KMO = .81, with individual items’ MSA ranging from .61 to .89 (Mdn. = .81, IQR = .08). One item had an MSA of <.7, and Bartlett’s test was significant (K2 = 160.22, df = 25, p < .001).
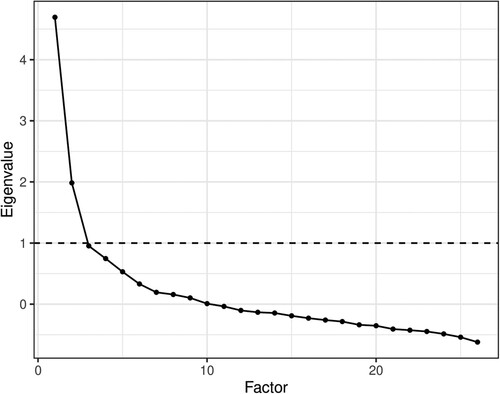
As shows, the point of inflection occurs at the third factor. According to Field (Citation2017), Cattell (Citation1966) argued to retain the factor at the point of inflection while Thurstone argued to consider only factors to the left of the point of inflection. In our data, two or three factors could be extracted. Kaiser’s criterion, however, indicated that two factors were sufficient. Since these criteria are discussed as subjective and unreliable, either parallel analysis or Velicer’s MAP is recommended (Field Citation2017, 790; Bühner Citation2011, 322; Wood, Tataryn, and Gorsuch Citation1996; O’Connor Citation2000; Zwick and Velicer Citation1982, Citation1986). Furthermore, extracting too many factors is preferable to extracting too few (Bühner Citation2011, 328). However, with ordinal data, MAP might underestimate the true number of factors (Garrido, Abad, and Ponsoda Citation2011). In our study, the MAP criterion supported three factors while parallel analysis supported five. Since the solutions with four and five factors (see ESM-3.docx) led to results that could not be interpreted meaningfully, we retained three factors as a compromise between the visual and statistical methods.
Figure 1. Scree plot of observed data.
After running a first round of CEFA (see electronic supplementary material ESM-5.docx for loadings and communalities of all items included), we took the five items per factor showing the highest loadings and re-ran the CEFA with the resulting 15-item set. Factors 1 and 3 had one item with a loading <.5 (see ). The communalities of the items ranged from .274 to .658, with seven items having a communality <.4. Factor 1 (‘school system-based perspective’, SSB) explained 14.32% of the total variance, Factor 2 (‘human-rights/ethics-based perspective’, HEB) 13.89%, and Factor 3 (‘outcomes and achievement-based perspective’, OAB) 15.82%.
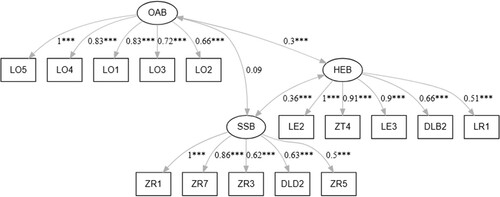
Categorical confirmatory factor analysis (Subsample II)
We used subsample II (see ) to run a CCFA with the model resulting from CEFA (see ). The -Test was significant with
= 202.092, p < .001. However, model fit was from good to acceptable with
/df-ration = 2.323, RMSEA = .072 (90%-CI = [.059, .085]), SRMR = .078, CFI = .966, TLI = .959. The item loadings ranged from .409 to .862 (Mdn. = .713), with two items showing loadings <.5 (see ). According to these findings, the factorial structure from CEFA could be reproduced with an adequate fit.
Figure 2. The model specified for the CCFA with empirical standardised coefficients and covariances.
Due to the theoretical assumption that subjective definitions of inclusion are composed by the emphasis of different possible perspectives, this model should have a better fit than a unidimensional model. The unidimensional model showed a poor fit with /df-ration = 9.499, RMSEA = .183 (90%-CI = [.171, .194]), SRMR = .149, CFI = .776, TLI = .739; our three-dimensional model had a superior fit. An LRT test for nested models (Satorra Citation2000) indicated that this finding was significant with
= 191.55, p < .001.
Measurement invariance (MIV) across groups (explorative)
We used an ad-hoc-sample across different professional backgrounds because the FEDI should measure subjective definitions of inclusion independently from professional background. To ensure this, MIV must be evaluated. Since many professional backgrounds were represented by few participants, we evaluated MIV across university students studying special needs education and those studying general education.
The measurement model for all university students attending a teaching degree programme (n = 329, see ) showed an acceptable fit with /df-ration = 2.832 (
= 246.342), RMSEA = .068 (90%-CI = [.058, .078]), SRMR = .070, CFI = .967, TLI = .960, which is even better than the fit within the total subsample II. According to the cut-off values suggested by Chen (Citation2007), configural, metric, and scalar MIV across groups of students studying special needs education (n = 150) and general education (n = 179) was given (see ). As indicates, two items from the OAB scale (‘Inclusion focuses on the learning development of the students’ [LO2] and ‘Inclusion focuses on the motor development of the students’ [LO4]) show DIF and should therefore be considered for revisions in further studies.
Figure 3. DIF-analysis of the FEDI-items.
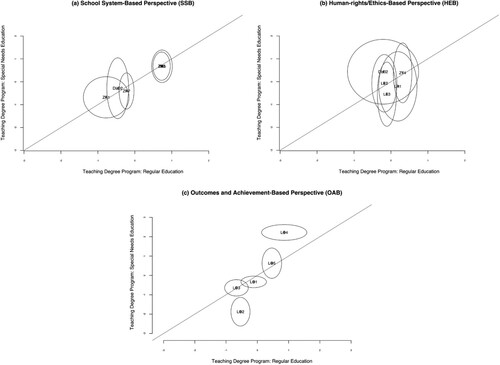
Table 6. MIV across university students attending a teaching degree programme for special needs education and for general education.
Item and scale properties
Overall, the items showed acceptable corrected item-total-correlations (see ). SSB and HEB showed a slightly skewed distribution, and OAB was slightly peaked (), but skewness and kurtosis () were acceptable for all three scales (Hair et al. Citation2017). However, the Shapiro–Wilk test indicated a significant deviation from normal distribution with W = .98, p < .001 for the scale SSB, W = .98, p < .001 for the scale HEB, and W = .98, p < .001 for the scale OAB. Since the test for normality is sensitive to sample size, the tests should not be overinterpreted. Furthermore, we found acceptable results for all scales’ internal consistency, ranging from = .7 to .79 (). Composite reliability calculated from the CCFA-sample was also acceptable according to Netemeyer, Bearden, and Sharma (Citation2003), with values ranging from CR = .81 to CR = .87.
Figure 4. Histograms of relative frequencies of the FEDI scores.
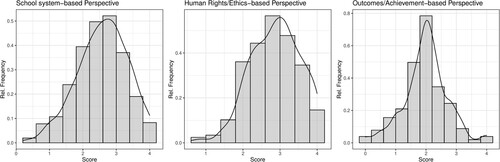
Table 7. Scale properties of the three FEDI scales.
To evaluate convergent and divergent validity, we analysed the intercorrelations of the FEDI scales and their correlations with attitudes towards inclusion (PREIS) and teachers’ sense of efficacy (TSES). In our data, the SSB and OAB did not correlate. The HEB showed small correlation with both other perspectives. Furthermore, the FEDI should measure subjective definitions of inclusion separated from attitudes or other evaluative cognitions. Thus, we assumed small to medium correlations would exist between FEDI scales, attitudes towards inclusions, and teachers’ sense of efficacy, especially for definitions that imply an ethical imperative. Overall, our data had small correlations between scales and medium correlations between attitudes towards inclusion and HEB (see ).
Table 8. Correlations between the FEDI scales, attitudes towards inclusion, and teachers’ sense of efficacy.
Discussion
CEFA and CCFA provide evidence that subjective definitions of inclusion are multi-dimensional constructs (Q1). This confirms our belief that these subjective definitions are influenced by a variety of individual factors and sub-definitions.
Furthermore, we showed MIV across different groups of university students. This is an early indication that the FEDI measures subjective definitions of inclusion independently from professional background. However, this requires further evaluation with structured sampling strategies. An initial DIF-analysis indicated that two items (LO2, LO4) did not measure equivalently between groups. This must be evaluated further with a more sophisticated sampling strategy considering different professional backgrounds.
We found small and medium correlations between the three FEDI scales and small correlations between the FEDI scales and teachers’ sense of efficacy. Attitudes towards inclusion were substantially correlated with only the HEB of the FEDI. This medium correlation can be explained by the normative imperative implied within an ethical or human rights-based perspective, because rejecting the idea of inclusion while defining it via ethical principles would mean to question one’s own ethical integrity.
Although Cronbach’s was not extraordinarily high for any of the FEDI scales, we showed an acceptable amount of internal consistency, especially considering the small number of items used per scale.
Our study suggests that the FEDI is an economic instrument with acceptable reliability that can be used in inclusion research and the field. Using this instrument, practitioners can evaluate the definition of inclusion to which any participant adheres and if the teaching staff of a school share a common vision. Hence, the definitions of inclusion from the questionnaire broaden the empirical indicators for an inclusive school climate.
However, some aspects require further research evaluation. First, internal consistency and composite reliability can be used as measures of reliability but should be complemented by other methods, especially the retest method. Second, as research interest in development processes increases, the FEDI’s sensitivity to change should be evaluated. Although our findings support construct validity and discriminant validity, further efforts should be undertaken to evaluate the instrument’s validity.
Limitations
Some aspects of the study may influence the internal and external validity of our results. First, we disseminated the call for participation primarily via e-mail. Thus, we had an ad-hoc sample instead of a representative sample for a specified population. Although the stratified randomisation to build two separate samples for CEFA and CCFA is a good solution to control against repeated testing, it is still a workaround and reduces the number of participants per analysis. Therefore, replication studies must cross-validate our findings using appropriate sampling procedures.
This issue also affects the interpretation of MIV across different subgroups. We performed an explorative evaluation of MIV across two groups of university students. Since this sample was also included in the first assessment of the factorial structure, the results must be interpreted with caution and further replicated.
Finally, questionnaires on attitudes towards inclusion show a social desirability bias (Lüke and Grosche Citation2018a, Citation2018c). As our questionnaire did not use scales for controlling social desirability, we cannot completely determine if it measures subjective definitions. Thus, we would argue for analysing this possibility in other research projects.
Conclusions
As there is no clear definition of inclusion or inclusive education, researchers cannot know on what subjective constructs their inquiries are based. With the FEDI, we provide an economic quantitative measure that shows good psychometric properties and works well across different groups. We encourage cross-validation of our findings using qualitative approaches. Furthermore, the effect of subjective definitions of inclusion on other aspects, such as attitudes, self-efficacy, and knowledge, should be replicated and further evaluated.
Supplemental Material
Download MS Word (22.7 KB)Supplemental Material
Download MS Word (31 KB)Supplemental Material
Download MS Word (21.6 KB)Supplemental Material
Download Comma-Separated Values File (136.1 KB)Supplemental Material
Download MS Word (25.1 KB)Disclosure statement
No potential conflict of interest was reported by the author(s).
Additional information
Notes on contributors
David Scheer
David Scheer, is a junior professor for inclusive education at the Annelie-Wellensiek Center for Inclusive Education, Heidelberg University of Education.
Lea Egener
Lea Egener, M.Ed., graduated from Paderborn University and is a student teacher at Grundschule Stieghorstschule Bielefeld.
Désirée Laubenstein
Désirée Laubenstein is a professor at the Institute for Educational Science, Paderborn University.
Conny Melzer
Conny Melzer is a professor for special needs education in the Faculty of Human Sciences, University of Cologne.
References
- Ainscow, Mel, Tony Booth, and Alan Dyson. 2006. Improving Schools, Developing Inclusion. New York: Routledge.
- Browne, Michael W., and Robert Cudeck. 1992. “Alternative Ways of Assessing Model Fit.” Sociological Methods and Research 21 (2): 230–258. doi:10.1177/0049124192021002005.
- Bühner, Markus. 2011. Einführung in die Test- und Fragebogenkonstruktion. München: Pearson.
- Cattell, Raymond B. 1966. “The Scree Test for the Number of Factors.” Multivariate Behavioral Research 1 (2): 245–276. doi:10.1207/s15327906mbr0102_10.
- Chen, Fang Fang. 2007. “Sensitivity of Goodness of Fit Indexes to Lack of Measurement Invariance.” Structural Equation Modeling: A Multidisciplinary Journal 14 (3): 464–504. doi:10.1080/10705510701301834.
- Cho, Eunseong. 2016. “Making Reliability Reliable: A Systematic Approach to Reliability Coefficients.” Organizational Research Methods 19 (4): 651–682. doi:10.1177/1094428116656239.
- Eagly, Alice Hendrickson, and Shelly Chaiken. 1993. The Psychology of Attitudes. Fort Worth, TX: Harcourt Brace Jovanovich College Publishers.
- Egener, Lea, David Scheer, Désirée Laubenstein, and Conny Melzer. 2019. “Fragebogen zur Erfassung subjektiver Definitionen von Inklusion (FEDI).” doi:10.13140/RG.2.2.24022.40002.
- Eid, Michael, and Katharina Schmidt. 2014. Testtheorie und Testkonstruktion. Göttingen: Hogrefe.
- Farrell, Peter, Alan Dyson, Filiz Polat, Graeme Hutcheson, and Frances Gallannaugh. 2007. “Inclusion and Achievement in Mainstream Schools.” European Journal of Special Needs Education 22 (2): 131–145. doi:10.1080/08856250701267808.
- Field, Andy. 2017. Discovering Statistics Using IBM SPSS Statistics. 5th ed. Thousand Oaks, CA: SAGE Publications.
- Fuchs, Douglas, and Lynn S. Fuchs. 1998. “Competing Visions for Educating Students with Disabilities Inclusion Versus Full Inclusion.” Childhood Education 74 (5): 309–316. doi:10.1080/00094056.1998.10521956.
- Garrido, Luis E., Francisco J. Abad, and Vicente Ponsoda. 2011. “Performance of Velicer’s Minimum Average Partial Factor Retention Method with Categorical Variables.” Educational and Psychological Measurement 71 (3): 551–570. doi:10.1177/0013164410389489.
- Göransson, Kerstin, and Claes Nilholm. 2014. “Conceptual Diversities and Empirical Shortcomings—A Critical Analysis of Research on Inclusive Education.” European Journal of Special Needs Education 29 (3): 265–280. doi:10.1080/08856257.2014.933545.
- Graham, Linda J, and Ilektra Spandagou. 2011. “From Vision to Reality: Views of Primary School Principals on Inclusive Education in New South Wales, Australia.” Disability and Society 26 (2): 223–237. doi:10.1080/09687599.2011.544062.
- Grosche, Michael. 2015. “Was ist Inklusion? Ein Diskussions- und Positionsartikel zur Definition von Inklusion aus Sicht der empirischen Bildungsforschung.” In Inklusion von Schülerinnen und Schülern mit sonderpädagogischem Förderbedarf in Schulleistungserhebungen, edited by Poldi Kuhl, Petra Stanat, Birgit Lütje-Klose, Cornelia Gresch, Hans Anand Pant, and Manfred Prenzel, 17–39. Wiesbaden: Springer VS. doi:10.1007/978-3-658-06604-8.
- Grosche, Michael. 2017a. “Brücken bauen, statt einreißen! Introspektion der quantitativ-empirischen Sonderpädagogik zur Ermöglichung einer inter- Und transdiskursiven Zusammenarbeit.” In Sonderpädagogik zwischen Wirksamkeitsforschung und Gesellschaftskritik, edited by Désirée Laubenstein, and David Scheer, 41–61. Bad Heilbrunn: Klinkhardt.
- Grosche, Michael. 2017b. “Eine Analyse der Funktion von quantitativen Daten für evidenzbasierte Entscheidungen zur Ermöglichung der Zusammenarbeit von quantitativen und nicht-quantitativen Forschungszugängen.” Sonderpädagogische Förderung heute 62 (4): 360–371.
- Hair, Jr., Joseph F., G. Tomas M. Hult, Christian M. Ringle, and Marko Sarstedt. 2017. A Primer on Partial Least Squares Structural Equation Modeling (PLS-SEM). Los Angeles, CA: Sage.
- Heine, Joerg-Henrik. 2020. “pairwise: Rasch Model Parameters by Pairwise Algorithm” (version 0.4.5-1). https://CRAN.R-project.org/package=pairwise.
- Horn, John L. 1965. “A Rationale and Test for the Number of Factors in Factor Analysis.” Psychometrika 30 (2): 179–185. doi:10.1007/BF02289447.
- Hu, Li-tze, and Peter M. Bentler. 1999. “Cutoff Criteria for Fit Indexes in Covariance Structure Analysis: Conventional Criteria versus New Alternatives.” Structural Equation Modeling: A Multidisciplinary Journal 6 (1): 1–55. doi:10.1080/10705519909540118.
- Jorgensen, Terrence D., Sunthud Pornprasertmanit, Alexander M. Schoemann, Yves Rosseel, Patrick Miller, Corbin Quick, Mauricio Garnier-Villarreal, et al. 2019. “SemTools: Useful Tools for Structural Equation Modeling” (version 0.5-2). https://cran.r-project.org/web/packages/semTools/index.html.
- Kaiser, Henry F. 1960. “The Application of Electronic Computers to Factor Analysis.” Educational and Psychological Measurement 20 (1): 141–151. doi:10.1177/001316446002000116.
- Kavale, Kenneth A., and Steven R. Forness. 2000. “History, Rhetoric, and Reality: Analysis of the Inclusion Debate.” Remedial and Special Education 21 (5): 279–296. doi:10.1177/074193250002100505.
- Krischler, Mireille, Justin J. W. Powell, and Ineke M. Pit-Ten Cate. 2019. “What Is Meant by Inclusion? On the Effects of Different Definitions on Attitudes toward Inclusive Education.” European Journal of Special Needs Education 34 (5): 632–648. doi:10.1080/08856257.2019.1580837.
- Lishinski, Alex. 2018. lavaanPlot: Path Diagrams for Lavaan Models via DiagrammeR. https://CRAN.R-project.org/package=lavaanPlot.
- Loreman, Tim. 2014. “Measuring Inclusive Education Outcomes in Alberta, Canada.” International Journal of Inclusive Education 18 (5): 459–483. doi:10.1080/13603116.2013.788223.
- Lüke, Timo, and Michael Grosche. 2016. Professionsunabhängige Einstellungsskala Zum Inklusiven Schulsystem (PREIS). figshare. doi:10.6084/m9.figshare.2245630.
- Lüke, Timo, and Michael Grosche. 2018a. “Konstruktion und Validierung der Professionsunabhängigen Einstellungsskala zum Inklusiven Schulsystem (PREIS).” Empirische Sonderpädagogik 10 (1): 3–20.
- Lüke, Timo, and Michael Grosche. 2018b. “What Do I Think About Inclusive Education? It Depends on Who Is Asking. Experimental Evidence for a Social Desirability Bias in Attitudes towards Inclusion.” International Journal of Inclusive Education 22 (1): 38–53. doi:10.1080/13603116.2017.1348548.
- Lüke, Timo, and Michael Grosche. 2018c. “Implicitly Measuring Attitudes towards Inclusive Education: A New Attitude Test Based on Single-Target Implicit Associations.” European Journal of Special Needs Education 33 (3): 427–436. doi:10.1080/08856257.2017.1334432.
- Makoelle, T. M. 2014. “Pedagogy of Inclusion: A Quest for Inclusive Teaching and Learning.” Mediterranean Journal of Social Sciences 5 (20): 1259–1267. doi:10.5901/mjss.2014.v5n20p1259.
- Mandl, Heinz, and Günter L. Huber. 1983. “Subjektive Theorien von Lehrern.” Psychologie in Erziehung und Unterricht 30: 98–112.
- Masters, Geoff N. 1982. “A Rasch Model for Partial Credit Scoring.” Psychometrika 47 (2): 149–174. doi:10.1007/BF02296272.
- Moosbrugger, Helfried, and Karin Schermelleh-Engel. 2012. “Exploratorische (EFA) und konfirmatorische Faktorenanalyse (CFA).” In Testtheorie und Fragebogenkonstruktion, edited by Helfried Moosbrugger and Augustin Kelava, 325–343. Berlin: Springer. doi:10.1007/978-3-642-20072-4_13.
- Netemeyer, Richard G., William O. Bearden, and Subhash Sharma. 2003. Scaling Procedures: Issues and Applications. Thousand Oaks, CA: Sage Publications.
- Nilholm, Claes, and Kerstin Göransson. 2017. “What Is Meant by Inclusion? An Analysis of European and North American Journal Articles with High Impact.” European Journal of Special Needs Education 32 (3): 437–451. doi:10.1080/08856257.2017.1295638.
- O’Connor, Brian P. 2000. “SPSS and SAS Programs for Determining the Number of Components Using Parallel Analysis and Velicer’s MAP Test.” Behavior Research Methods, Instruments, and Computers 32: 396–402.
- Piezunka, Anne, Tina Schaffus, and Michael Grosche. 2017. “Vier Definitionen von schulischer Inklusion und ihr konsensueller Kern: Ergebnisse von Experteninterviews mit Inklusionsforschenden.” Unterrichtswissenschaft 45 (4): 207–222. doi:10.3262/UW1704207.
- Przibilla, Bodo, Friedrich Linderkamp, and Philipp Krämer. 2018. “Subjektive Definitionen von Lehrkräften zu Inklusion—Eine explorative Studie.” Empirische Sonderpädagogik 10 (3): 232–247.
- R Core Team. 2019. R: A Language and Environment for Statistical Computing (version 3.6.0). http://www.r-project.org/.
- Revelle, William. 2019. Package ‘Psych’: Procedures for Psychological, Psychometric, and Personality Research (version 1.8.12). https://cran.r-project.org/web/packages/psych/psych.pdf.
- Rizopoulos, Dimitris. 2018. ‘Ltm’: An R Package for Latent Variable Modelling and Item Response Theory Analyses (version 1.1-1). https://cran.r-project.org/web/packages/ltm/ltm.pdf.
- Rosseel, Yves. 2012. “Lavaan: An R Package for Structural Equation Modeling.” Journal of Statistical Software 48: 2. doi:10.18637/jss.v048.i02.
- Rosseel, Yves. 2018. ‘Lavaan’: An R Package for Structural Equation Modeling (version 0.6-3). http://lavaan.org.
- RStudio. 2019. RStudio (version 1.2.1335). https://rstudio.com.
- Salisbury, Christine L. 2006. “Principals’ Perspectives on Inclusive Elementary Schools.” Research and Practice for Persons with Severe Disabilities 31 (1): 70–82.
- Satorra, Albert. 2000. “Scaled and Adjusted Restricted Tests in Multi-Sample Analysis of Moment Structures.” In Innovations in Multivariate Statistical Analysis, edited by R. D. H. Heijmans, D. S. G. Pollock, and A. Satorra, 233–247. Boston, MA: Springer US. doi:10.1007/978-1-4615-4603-0_17.
- Savolainen, Hannu, Olli-Pekka Malinen, and Susanne Schwab. 2020. “Teacher Efficacy Predicts Teachers’ Attitudes Towards Inclusion – A Longitudinal Cross-Lagged Analysis.” International Journal of Inclusive Education, 1–15. doi:10.1080/13603116.2020.1752826.
- Scheer, David. 2020. Schulleitung und Inklusion: Empirische Untersuchung zur Schulleitungsrolle im Kontext schulischer Inklusion. Wiesbaden: Springer Fachmedien Wiesbaden. doi:10.1007/978-3-658-27401-6.
- Scheer, David, Lea Egener, Désirée Laubenstein, and Conny Melzer. 2020. “Definitions of Inclusion Questionnaire (FEDI).” doi:10.13140/RG.2.2.35740.85121/1.
- Scheer, David, Markus Scholz, Astrid Rank, and Christian Donie. 2015. “Inclusive Beliefs and Self-Efficacy Concerning Inclusive Education among German Teacher Trainees and Student Teachers.” Journal of Cognitive Education and Psychology 14 (3): 270–293. doi:10.1891/1945-8959.14.3.270.
- Schermelleh-Engel, Karin, Helfried Moosbrugger, and Hans Müller. 2003. “Evaluating the Fit of Structural Equation Models: Tests of Significance and Descriptive Goodness-of-Fit Measures.” Methods of Psychological Research Online 8 (2): 23–74. https://www.dgps.de/fachgruppen/methoden/mpr-online/issue20/art2/mpr130_13.pdf.
- Schulze, Sarah, Timo Lüke, Anne Schröter, Katharina Krause, and Jan Kuhl. 2019. “Replikationsstudie zur Testgüte der Professionsunabhängigen Einstellungsskala zum Inklusiven Schulsystem – ein Beitrag zur Validierung.” Unterrichtswissenschaft 47 (2): 201–219. doi:10.1007/s42010-018-00034-3.
- Starczewska, Ania, Alan Hodkinson, and Gill Adams. 2012. “Conceptions of Inclusion and Inclusive Education: A Critical Examination of the Perspectives and Practices of Teachers in Poland.” Journal of Research in Special Educational Needs 12 (3): 162–169. doi:10.1111/j.1471-3802.2011.01209.x.
- Sung, Jung Gyung, and Conny Melzer. 2014. “Die Auswirkungen praktischer Erfahrungen auf die Selbstwirksamkeit von Studierenden der Sonderpädagogik in Korea - Implikationen für die Lehrerausbildung im Hinblick auf inklusive Bildungssysteme.” Zeitschrift für Heilpädagogik 65 (8): 280–288.
- Svetina, Dubravka, Leslie Rutkowski, and David Rutkowski. 2020. “Multiple-Group Invariance with Categorical Outcomes Using Updated Guidelines: An Illustration Using Mplus and the lavaan/semTools Packages.” Structural Equation Modeling: A Multidisciplinary Journal 27 (1): 111–130. doi:10.1080/10705511.2019.1602776.
- Tschannen-Moran, Megan, and Anita Woolfolk-Hoy. 2001. “Teacher Efficacy: Capturing an Elusive Construct.” Teaching and Teacher Education 17: 783–805. doi:10.1016/S0742-051X(01)00036-1.
- Urton, Karolina, Jürgen Wilbert, and Thomas Hennemann. 2014. “Attitudes towards Inclusion and Self-Efficacy of Principals and Teachers.” Learning Disabilities: A Contemporary Journal 12 (2): 151–168.
- Velicer, Wayne F. 1976. “Determining the Number of Components from the Matrix of Partial Correlations.” Psychometrika 41 (3): 321–327. doi:10.1007/BF02293557.
- Waitoller, Federico R., and Alfredo J. Artiles. 2013. “A Decade of Professional Development Research for Inclusive Education: A Critical Review and Notes for a Research Program.” Review of Educational Research 83 (3): 319–356. doi:10.3102/0034654313483905.
- Werning, Rolf. 2010. “Inklusion zwischen Innovation und Überforderung.” Zeitschrift für Heilpädagogik 61 (8): 284–291.
- Wood, James M., Douglas J. Tataryn, and Richard L. Gorsuch. 1996. “Effects of under- and Overextraction on Principal Axis Factor Analysis with Varimax Rotation.” Psychological Methods 1 (4): 354–365. doi:10.1037/1082-989X.1.4.354.
- Wu, Hao, and Ryne Estabrook. 2016. “Identification of Confirmatory Factor Analysis Models of Different Levels of Invariance for Ordered Categorical Outcomes.” Psychometrika 81 (4): 1014–1045. doi:10.1007/s11336-016-9506-0.
- Zwick, William R., and Wayne F. Velicer. 1982. “Factors Influencing Four Rules For Determining The Number Of Components To Retain.” Multivariate Behavioral Research 17 (2): 253–269. doi:10.1207/s15327906mbr1702_5.
- Zwick, William R., and Wayne F. Velicer. 1986. “Comparison of Five Rules for Determining the Number of Components to Retain.” Psychological Bulletin 99 (3): 432–442. doi:10.1037/0033-2909.99.3.432.