
ABSTRACT
Objectives: To estimate trajectories of depression around old age retirement in Swedish women and men and examine if socio-economic status predicted the trajectories
Methods: The analytic sample comprised 907 women and 806 men from the Swedish Longitudinal Occupational Survey of Health. B-spline smoothers and group-based trajectory modelling were used to identify groups of individuals with similar trajectories of depressive symptoms around retirement. Multinomial regression analyses were conducted to investigate if socio-economic factors were associated with odds of belonging to trajectory groups with higher depression scores.
Results: Four depressive symptoms trajectories were identified in both genders, all showing similar symptom levels across the retirement transition. Low levels of depressive symptoms were observed in the three largest groups. In the last trajectory group among women (2.5%) depression scores were moderate to severe and among men (3.3%) depression scores were persistent moderate. Higher educational level and lower subjectively rated social status were associated with higher odds of belonging to trajectory groups with higher levels of depressive symptoms in both genders.
Conclusion: Retirement transition was not associated with symptoms of depression. Higher educational level and lower subjective social status may predict higher depressive symptom levels the years around old age retirement.
Introduction
Old age retirement and depression
Old age retirement has in some studies been associated with a decrease in depressive symptoms and antidepressant use (Oksanen et al., Citation2011; van der Heide, van Rijn, Robroek, Burdorf, & Proper, Citation2013; Westerlund et al., Citation2010), whereas no such association has been found in other studies (Laaksonen et al., Citation2012; Leinonen, Lahelma, & Martikainen, Citation2013; Olesen, Rod, Madsen, Bonde, & Rugulies, Citation2015). It has been pointed out that more research is needed illuminating differences between socio-economic groups (van der Heide et al., Citation2013) and that contextual factors associated with retirement are important to take into consideration when seeking to understand mental health effects of retirement. For example, due to differences in work histories, the retirement transition may be experienced differently for men and women (Kim & Moen, Citation2002).
An intersectional perspective on retirement and depression in Sweden
In Sweden, people can choose the start date for their statutory state pension between the ages of 61 and 67 years, with a later start date resulting in a higher monthly pension. Although most people retire around the age of 65, an increasing number work also beyond the age of 67, both as employees and self-employed. Earlier retirement is also possible in some occupations as well as with disability pension. Most individuals who recently retired with old age pension in Sweden were born in the 1940s. Although subsidised childcare was introduced in the 1970s, enabling more women to enter the labour force or increase their engagement in paid work, women participated in professional life on different terms than men. They more often worked part-time and took the main responsibility for children and the household (Statistics Sweden, Citation2014). However, some women made untraditional choices, prioritised their careers and reached higher organisational positions. The term ‘glass ceiling’ was popularised in the 1980s, describing the difficulties women had (and have) in reaching the very top positions of organisations (Hymowitz & Schellhardt, Citation1986). Women who reached higher positions may have been exposed to more stress than other groups, which in turn may affect their health around old age retirement.
Role theory and health effects of retirement
One theory discussed in the literature on how retirement may affect health is that of role theory (Kim & Moen, Citation2002). Individuals retiring from work may suffer from role loss, with an associated increase in risk of e.g. depression, but retirees may also be relieved from role overload, with subsequent reduced risk of depression. Previous research indicates stronger support for the hypothesis of a relief from role overload (Oksanen et al., Citation2011; Reitzes, Mutran, & Fernandez, Citation1996; van der Heide et al., Citation2013; Westerlund et al., Citation2010). For example, one study showed that individuals reporting poor work environment prior to retirement also reported a greater improvement in self-rated general health after retirement, while individuals with optimal working conditions reported no health improvement (Westerlund et al., Citation2009).
A contradictory pattern was reported regarding health related behaviour around retirement in the French GAZEL study. A different development in alcohol consumption was furthermore seen among managerial women than among non-managerial women and all men after retirement. While all groups increased their alcohol consumption after retirement, only managerial women continued drinking heavily after five years (Zins et al., Citation2011). A potential explanation for this is that women who retire after having been successful in professional life, may have had limited possibilities to develop other roles in private life. As a consequence, they may suffer from greater role loss when retiring than men and women who made more traditional choices, explaining their continued heavy drinking.
Aim of the present study
The reviewed literature suggests that an intersectional perspective, including socio-economic status and gender, may be important when investigating mental health around retirement. However, whether any influence of retirement on mental health vary by sex and socio-economic status is not clear (Leinonen et al., Citation2013; Mein, Martikainen, Hemingway, Stansfeld, & Marmot, Citation2003; Vahtera et al., Citation2009). In the present study, using data from five waves of SLOSH (Swedish Longitudinal Occupational Survey of Health, 2008–2016), we estimated trajectories of depression around retirement among Swedish women and men and examined to what extent various measures of socio-economic status, including managerial position, predicted the trajectories.
Materials and methods
Study sample
Data were derived from the Swedish Longitudinal Occupational Survey of Health (SLOSH), a cohort that started in 2006 as a follow-up to the 2003 Swedish Work Environment Surveys (SWES). Data for SWES are collected by Statistics Sweden every second year in repeated cross-sectional random stratified samples of gainfully employed people aged 16–64 in Sweden. Respondents from SWES 2005 were added in the 2008 SLOSH wave, and additional participants from SWES 2007, 2009 and 2011 have been invited in later SLOSH follow-ups. SLOSH data are collected every second year and the participants are followed by means of postal self-completion questionnaires in two versions: one for those currently in paid work at least 30% of full time and one for those working less or not at all. A more detailed description of the study can be found elsewhere (Magnusson Hanson et al., Citationin press; Magnusson Hanson, Theorell, Oxenstierna, Hyde, & Westerlund, Citation2008; Nyberg, Peristera, Westerlund, Johansson, & Magnusson Hansson, Citation2016). The participants received written information about the study and gave informed consent. The Regional Research Ethics Board in Stockholm approved the study. The present study is based on the respondents from SWES 2003 and 2005 and includes five SLOSH waves (2008, 2010, 2012, 2014 and 2016). The response rate in 2008 (following up participants from SWES 2003 and SWES 2005) was 61.1% (n = 11,441). Out of those, 8771 also participated in 2010, 7398 subsequently also in 2012, 6300 in 2014 and 5519 in 2016. For the purpose of the present study we selected individuals who at some point in 2010, 2012, 2014 or 2016 used the questionnaire for those who worked less than 30% or not at all and reported that they had retired with old age pension. Furthermore, we required that they had at least two measurements over the study period, yielding a sample of 2718 individuals. Of these we included only participants who in the wave preceding the retirement, but not in any of the subsequent waves, were in paid work 30% or more. This was to certify that we did not include participant who had gone back to work again. This reduced the study sample to n = 2473. We also excluded individuals who had missing values on the outcome variable or covariates or who had indicated values outside the range of the measurement scales. This resulted in a final study sample of 1813 individuals, 806 men and 907 women.
Study variables
Date of retirement
The date when the participant had retired with old age pension was based on self-reported data and could be indicated for any year from 2009 to 2016. If indicated in a year between SLOSH waves depression scores were treated as missing.
Outcome
Symptoms of depression were measured with the Symptom Checklist-Core Depression Scale (SCL-CD6) a 6 item subscale from the Symptom Checklist-90. The question ‘How much during the last week have you been troubled by…’ was followed by six core symptoms of depression; feeling blue/sad, feeling no interest in things, feeling low in energy, feeling that everything is an effort, worrying too much, and blaming yourself for various things. The five response alternatives ranged from not at all to very much and the depression index score from 0 (lowest) to 24 (highest) (Magnusson Hanson et al., Citation2014). In the present study we labelled the trajectories according to suggested cut-points for the depression scale in line with the International Classification system of Diseases (ICD): 0–9 = no depression, 10–11 = mild depression, 12–15 = moderate depression, and 16–20 = severe depression (Bech, Citation2011).
Risk factors
Data on socio-economic status was derived from the wave preceding the retirement and included register data on education and personal taxable income, and self-reported data on managerial position, subjective social status, and marital status. Education was categorised into (1) up to 9 years of education, (2) up to 12 years of education, (3) university education ≤3 years, (4) university >3 years, and (5) research education. Income was a logarithmic linear variable based on register data. Managerial position included the categories yes and no. Subjective social status was measured with an illustration of a ladder and the question: ‘Think of this ladder as representing where people stand in our society. At the top of the ladder are the people who are the best off – those with the most money, most education and the best jobs. At the bottom are the people who are worst off – those who have the least money, least education, and the worst jobs or no job. The higher up you are on this ladder, the closer you are to the people at the very top and the lower you are, the closer you are to the people at the very bottom. Mark a large X on the rung where you think you stand (not in between the rungs)’ (Singh-Manoux, Adler, & Marmot, Citation2003). The ladder comprises ten rungs and subjective social status consequently varies between 1 and 10. Civil status was measured with the question ‘Are you single or married/cohabitant?’ with two response alternatives.
Covariates
Physical disease was measured as a dichotomous variable. Value 1 indicated that the participant had reported having one or more of the following: cardiovascular disease, diabetes, rheumatic disease or lung disease. Value 0 indicated absence of any of the above diseases. Age at retirement was categorised into the five groups ≤60, 61–63, 64–66, 67–69 and ≥70.
Statistical analyses
B-spline group-based trajectory modelling
In order to estimate trajectories of depressive symptoms around retirement, our first objective, we performed B-spline group-based trajectory modelling (BGBTM) separately for women and men, following the procedure suggested by Francis, Elliott, and Weldon (Citation2016). We first used B-spline smoothing to describe the general shape of the depressive symptoms curves. Then we included the B-splines in the group based trajectory model as time varying covariates (Francis et al., Citation2016; Nagin, Citation2005). The BGBTM method is based on the estimation of different smooth functions (spline smoothers) instead of the polynomial functions of time used in the GBTM approach. Spline smoothers are a set of cubic piecewise polynomials that meet a series of knots on the x-axis and are not influenced by local points. The depressive symptoms variable was continuous and the estimation of depression trajectories was therefore accomplished using the censored normal model (CNORM). We compared models with different numbers of knots, also represented in terms of degrees of freedom as df = number of knots + 3. The model with the best fit to the data according to the Bayesian Information Criterion (BIC) was selected (Nagin, Citation2005; Nagin & Odgers, Citation2010).
In order to examine whether socio-economic status predicted probability of membership in the identified trajectories, our second objective, we included measures of socio-economic status as risk factors, measured in the wave preceding the retirement and treated as time-invariant variables. The association of these predictor variables to trajectory group membership was examined by specifying the probability of trajectory group membership as following a multinomial logit model. Coefficients for risk factors indicated the increase or decrease in relative log odds of being in a trajectory (relative to the lowest group) per unit change in the risk factor (Nagin, Citation2005). Also odds ratios were calculated. We tested the influence of risk factors on group membership in a model where all risk factors were mutually adjusted for each other as well as for retirement age and physical disease. The BGBTM analyses were conducted using the splines library in R (R Development Core Team, Citation2008) as well as the PROC TRAJ procedure developed by Jones and Nagin (Jones, Nagin, & Roeder, Citation2001) in the SAS software (version 9.4; SAS Institute).
Results
The average age of retirement in the final study sample was 64.7 among men and 64.5 among women. The results corresponding to our first objective, to estimate trajectories of depressive symptoms around retirement, and to our second objective, to estimate to what extent socio-economic status predicted probability of trajectory group membership, are presented separately for women and men below.
Results for women
Trajectory groups
Among women the model providing the best fit to the data was a four-group model with four degrees of freedom. This model had the lowest BIC score when fitting a sequence of models from two to five trajectory groups and from one to three knots (four to six smoothing degrees of freedom). The model is presented in .
Figure 1. Trajectories (with 95% confidence intervals) of depressive symptoms around old age retirement among women in SLOSH 2008–2016 (n = 907).
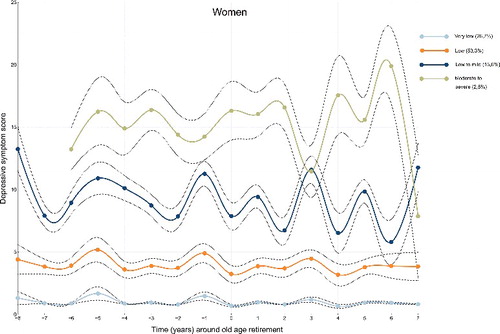
The model shows scores of depressive symptoms measured from 2008 (year -8 if retired in 2016) to 2016 (year 7 if retired in 2009). The first trajectory group (Very low, n = 232, 26.7%) comprised women with the lowest depression scores at all time points, the second group (Low, n = 525, 55.3%) women with slightly higher scores, but with no indication of depression, the third group (Low to mild, n = 129, 15.6%) women with depression scores between low and mild depressive symptom levels, and the fourth group comprised women for whom depression scores ranged between moderate and severe levels (Moderate to severe, n = 21, 2.5%). The depressive symptom scores were in the two larger groups similar over time, whereas they fluctuated in the groups Low to mild and Moderate to severe. The distribution of the study variables across the trajectory groups at the measurement point preceding the retirement is presented in .
Table 1. Profiles of depressive symptoms trajectory groups (Very low, Low, Low to mild, and Moderate to severe) among women (n = 907). The variables are taken from the SLOSH wave preceding the retirement.
Predicting group membership
The odds of belonging to the Low, Low to mild, or Moderate to severe trajectory groups when using Very low as the reference for each of the predictor variables, when mutually adjusted for each other as well as for retirement age and physical disease, are presented in . The results show that higher educational level was associated with higher odds of belonging to the trajectory groups Low (OR 1.55, 95% CI 1.28–1.89) Low to mild (OR 1.97, 95% CI 1.56–2.49), and Moderate to severe (OR 2.08, 95% CI 1.22–3.52). Higher subjective social status was furthermore associated with lower odds of belonging to the groups Low (OR 0.67, 95% CI 0.56–0.79), Low to mild (OR 0.54, 95% CI 0.44–0.67), and Moderate to severe (OR 0.38, 95% CI 0.25–0.57). Income (log), managerial position, and marital status were not significant risk factors for depression around old age retirement among women. Having one or more physical diseases, but not age of retirement, was furthermore associated with higher odds of belonging to trajectory groups with higher depression scores.
Table 2. Results from the multinomial logistic regression analysis showing the log odds that risk factors (education, income, managerial position, subjective social status, and marital status) influence membership in the second (Low), third (Low to mild), and fourth (Moderate to severe) depressive symptoms trajectory groups when using the first trajectory group (Very low) as reference among women. Data were derived from SLOSH 2008–2016. Analyses were adjusted for physical disease and retirement age.
Results for men
Trajectory groups
The best model for men based on the BIC test statistic was a model with four trajectory groups and four degrees of freedom. The model is presented in below.
Figure 2. Trajectories (with 95% confidence intervals) of depressive symptoms around old age retirement among men in SLOSH 2008–2016 (n = 806).
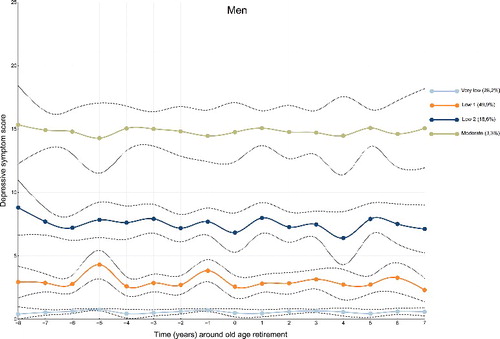
Among men the depressive symptom scores were relatively unchanged across time, but the symptom score levels differed between trajectory groups (). The trajectory groups identified in the sample were the following: Very low (n = 219, 28.2%), Low 1 (n = 420, 49.9%), Low 2 (n = 141, 18.6%) and Moderate (n = 26, 3.3%). Profiles of the four trajectory groups at the measurement point preceding the retirement are presented in .
Table 3. Profiles of depressive symptoms trajectory groups (Very low, Low 1, Low 2, and Moderate) among men (n = 806). The variables are taken from the SLOSH wave preceding the retirement.
Predicting group membership
Results of the influence of predictors on odds of belonging to the Low 1, Low 2 and Moderate trajectory groups in models where all risk factors were mutually adjusted for each other as well as for retirement age and physical disease are presented in . The trajectory group Very low was used as the reference group. Higher educational level was associated with higher odds of belonging to Low 2 (OR 1.38, 95% CI 1.09–1.74) and Moderate (OR 1.72, 95% CI 1.05–2.80) trajectory groups. Higher subjective social status was associated with lower odds of membership in Low 1 (OR 0.74, 95% CI 0.62–0.88), Low 2 (OR 0.57, 95% CI 0.46–0.71) and Moderate (OR 0.33, 95% CI 0.23–0.47) trajectory groups. Last, being married was associated with lower odds of belonging to trajectory group Low 2 (OR 0.33, 95% CI 0.16–0.18) compared with the reference group Very low. Income and managerial position were not significant predictors of trajectory group membership. Having one or more physical diseases was associated with higher odds of belonging to trajectory groups with higher depression scores, but retirement age was not.
Table 4. Results from the multinomial logistic regression analysis showing the log odds that risk factors (education, income, managerial position, subjective social status, and marital status) influence membership in the second (Low 1), third (Low 2), and fourth (Moderate) depressive symptoms trajectory groups when using the first trajectory group (Very low) as reference among men. Data were derived from SLOSH 2008–2016. Analyses were adjusted for physical disease and retirement age.
Discussion
Using data derived from an approximately representative sample of the Swedish working population we followed women and men separately up to eight years before to seven years after retirement and identified four distinct trajectory groups of depressive symptoms in each gender. In the three largest groups in both genders depression scores were very low, low or low to mild. Among women the fourth trajectory group comprised individuals with moderate to severe levels of depressive symptoms and among men the fourth group had moderate levels. Depression scores were stable across time in all groups among men, but in the two groups with the highest depression scores among women more fluctuating patterns were observed. No clear change in symptoms at the time of retirement was seen for any group. Higher educational level and lower subjective social status were in both genders associated with higher odds of belonging to trajectory groups with higher depression scores. Among men being married was furthermore associated with lower odds of belonging to one of the trajectory groups with higher depression scores compared with the reference group.
The present results suggest that in most women and men retiring from old age between 2008 and 2016 in Sweden levels of depressive symptoms were relatively unaffected by the retirement transition. This result supports those reported in some previous studies (Laaksonen et al., Citation2012; Leinonen et al., Citation2013; Olesen et al., Citation2015), but opposes others (Oksanen et al., Citation2011; van der Heide et al., Citation2013; Westerlund et al., Citation2010). There was no support for the proposition that retirement may be associated with role changes with possible changes in depressive symptoms as a consequence, or that this process would be very different for women and men. It should be noted that the present sample is limited to those who worked at least 30% before retirement. Those who were unhealthy before retirement and presumably would have benefitted the most from quitting work may already have been on sickness absence (Westerlund et al., Citation2010). On the other hand, participants whose mental health was negatively affected by transition into retirement may have gone back to work (i.e. ‘unretired’) and were excluded from the study for this reason. This group is, however, quite small. Thus, the existence of a trajectory group with poor mental health development is unlikely in the present sample.
The results of risk factors for group membership in the four trajectories of depression indicated similar patterns for women and men. Higher educational level was associated with higher odds of membership in trajectory groups with higher depression score levels and higher subjective social status was associated with lower odds. Among men an additional association was observed. Being married was associated with lower odds of membership in a trajectory group with higher depression score. The result that higher educational level was associated with higher depression scores contradicts a large body of research in general populations indicating the opposite (Erickson et al., Citation2016; Lorant et al., Citation2003; McFarland & Wagner, Citation2015; Miech & Shanahan, Citation2000; Peyrot et al., Citation2015). Some studies have, however, not been able to confirm such an association (Inaba et al., Citation2005), and it has been pointed out that results vary depending on for example region and the way depression is measured (Lorant et al., Citation2003). It was recently reported that a job promotion was associated with an increase in depressive symptoms in the SLOSH study (Nyberg et al., Citation2016). One could speculate that, partly in line with this result, a higher educational level may be associated with higher internal and external demands and more responsibility. Future research is, however, needed to clarify the association between educational attainment and depression around retirement. It is furthermore interesting that subjective social status was found to be associated with depressive symptoms around retirement also when all other measures of socio-economic status were included. Although it is clearly stated in the question that one should consider financial situation, education, and type of job when answering, respondents may still have included also other aspects of social status that were not measured in the present study. Examples could be socio-economic status during childhood, household financial situation, or position in a social community. Another possible explanation is, of course, that people with depressive symptoms devalue their social status. Being married or co-habitant was associated with lower odds of belonging to one of the trajectory groups with higher depression scores (Low 2) among men only. The result indicates that support from a spouse may be protective against depressive symptoms the years around retirement in some groups among men. This finding supports previous research indicating spousal support as an important factor for preventing mental health problems in older adults (Ahn, Kim, & Zhang, Citation2016; Cornwell & Waite, Citation2009). We cannot, however, rule out the possibility that the association is explained by selection, i.e. that men with lower depression scores are more likely to have a spouse than men with higher depression scores.
Strengths and limitations
The current study extended previous work by estimating several socio-economic predictors of group membership in trajectories of depression around old age retirement separately for women and men. Strengths of this study include the application of B-spline group-based trajectory modelling, identifying distinct subpopulations rather than estimating the overall depressive symptoms pattern in the population. The method furthermore overcomes problems of GBTM based on polynomial curves, such as producing unexpected changes in direction and identifying groups that do not exist in the data (Francis et al., Citation2016). An additional strength is that missing data in dependent variables are assumed to be missing at random and GBTM are estimated by using all available observations on the dependent measure.
The data were derived from a representative sample of the Swedish working population. However, due to selective dropout (a higher proportion of responders than non-responders to SLOSH are across waves women, married, born in Sweden, of higher age, have a university education, and work in the governmental sector) the present results cannot be generalised to the Swedish population at large. The sample was furthermore restricted to individuals who were in paid work 30% or more of full-time before they retired, and the results may not be applicable to individuals who have poorer health when they enter retirement. However, because our objective was to study the impact of the retirement transition on depressive symptoms, only individuals who were in paid work before retirement could be included. Lack of association for some risk factors may be due to the fact that they were used as linear variables in the analyses. However, using categorical variables would have reduced the power of our data since several cases would have been excluded from the analysis due to missing values. It should also be noted that with the present design each participant could contribute only odd or even years, which may have created spurious instability in the graphs seen particularly in the second highest trajectory group among women. One last limitation is that we used subjectively rated symptoms of depression. This scale is, however, derived from the SCL depression scale, which has been validated against clinical diagnostic interviews and has been found robust (Lundin, Hallgren, & Forsell, Citation2015).
Conclusion
The retirement transition was not associated with symptoms of depression. Depressive symptom levels differed between trajectory groups, and higher educational level and lower subjective social status predicted higher symptom levels among both men and women.
Disclosure statement
The authors report no conflicts of interest.
Additional information
Funding
Related Research Data
References
- Ahn, S., Kim, S., & Zhang, H. (2016). Changes in depressive symptoms among older adults with multiple chronic conditions: Role of positive and negative social support. International Journal of Environmental Research and Public Health, 14(1), 16. doi:10.3390/ijerph14010016 Retrieved from https://www.ncbi.nlm.nih.gov/pubmed/28035968
- Bech, P. (2011). Klinisk Psykometri [Clinical Psychometrics]. Copenhagen, Denmark: Munksgard.
- Cornwell, E. Y., & Waite, L. J. (2009). Social disconnectedness, perceived isolation, and health among older adults. Journal of Health and Social Behavior, 50(1), 31–48. doi:10.1177/002214650905000103 Retrieved from https://www.ncbi.nlm.nih.gov/pubmed/19413133
- Erickson, J., El-Gabalawy, R., Palitsky, D., Patten, S., Mackenzie, C. S., Stein, M. B., & Sareen, J. (2016). Educational attainment as a protective factor for psychiatric disorders: Findings from a nationally representative longitudinal study. Depress Anxiety, 33, 1013–1022. doi:10.1002/da.22515 Retrieved from https://www.ncbi.nlm.nih.gov/pubmed/27096927
- Francis, B., Elliott, A., & Weldon, M. (2016). Smoothing group-based trajectory models through B-splines. Journal of Developmental and Life Course Criminology, 2, 113–133.
- Hymowitz, C., & Schellhardt, T. D. (1986, March 24). The glass-ceiling: Why women can't seem to break the invisible barrier that blocks them from top jobs. The Wall Street Journal.
- Inaba, A., Thoits, P. A., Ueno, K., Gove, W. R., Evenson, R. J., & Sloan, M. (2005). Depression in the United States and Japan: Gender, marital status, and SES patterns. Social Science & Medicine, 61(11), 2280–2292. doi:10.1016/j.socscimed.2005.07.014 Retrieved from https://www.ncbi.nlm.nih.gov/pubmed/16115712
- Jones, B. L., Nagin, D. S., & Roeder, K. (2001). A SAS procedure based on mixture models for estimating developmental trajectories. Sociological Methods & Research, 29, 374–393.
- Kim, J. E., & Moen, P. (2002). Retirement transitions, gender, and psychological well-being: A life-course, ecological model. The Journals of Gerontology Series B: Psychological Sciences and Social Sciences, 57(3), P212–P222. Retrieved from http://www.ncbi.nlm.nih.gov/pubmed/11983732
- Laaksonen, M., Metsa-Simola, N., Martikainen, P., Pietilainen, O., Rahkonen, O., Gould, R., … Lahelma, E. (2012). Trajectories of mental health before and after old-age and disability retirement: A register-based study on purchases of psychotropic drugs. Scandinavian Journal of Work, Environment & Health, 38(5), 409–417. doi:10.5271/sjweh.3290 Retrieved from http://www.ncbi.nlm.nih.gov/pubmed/22411588
- Leinonen, T., Lahelma, E., & Martikainen, P. (2013). Trajectories of antidepressant medication before and after retirement: The contribution of socio-demographic factors. European Journal of Epidemiology, 28(5), 417–426. doi:10.1007/s10654-013-9792-0 Retrieved from https://www.ncbi.nlm.nih.gov/pubmed/23508328
- Lorant, V., Deliege, D., Eaton, W., Robert, A., Philippot, P., & Ansseau, M. (2003). Socioeconomic inequalities in depression: A meta-analysis. American Journal of Epidemiology, 157(2), 98–112. Retrieved from https://www.ncbi.nlm.nih.gov/pubmed/12522017
- Lundin, A., Hallgren, M., & Forsell, Y. (2015). The validity of the symptom checklist depression and anxiety subscales: A general population study in Sweden. Journal of Affective Disorders, 183, 247–252. doi:10.1016/j.jad.2015.05.024 Retrieved from https://www.ncbi.nlm.nih.gov/pubmed/26025371
- Magnusson Hanson, L. L., Leineweber, C., Persson, V., Hyde, M., Theorell, T., & Westerlund, H. (in press). Cohort profile - The Swedish Longitudinal Occupational Survey of Health (SLOSH). International Journal of Epidemiology. doi: 10.1093/ije/dyx260.
- Magnusson Hanson, L. L., Theorell, T., Oxenstierna, G., Hyde, M., & Westerlund, H. (2008). Demand, control and social climate as predictors of emotional exhaustion symptoms in working Swedish men and women. Scandinavian Journal of Public Health, 36(7), 737–743. doi:10.1177/1403494808090164 Retrieved from http://www.ncbi.nlm.nih.gov/pubmed/18684778
- Magnusson Hanson, L. L., Westerlund, H., Leineweber, C., Rugulies, R., Osika, W., Theorell, T., & Bech, P. (2014). The Symptom Checklist-core depression (SCL-CD6) scale: Psychometric properties of a brief six item scale for the assessment of depression. Scandinavian Journal of Public Health, 42(1), 82–88. doi:10.1177/1403494813500591 Retrieved from http://www.ncbi.nlm.nih.gov/pubmed/23982463
- McFarland, M. J., & Wagner, B. G. (2015). Does a college education reduce depressive symptoms in American young adults ? Social Science & Medicine, 146, 75–84. doi:10.1016/j.socscimed.2015.09.029 Retrieved from https://www.ncbi.nlm.nih.gov/pubmed/26513116
- Mein, G., Martikainen, P., Hemingway, H., Stansfeld, S., & Marmot, M. (2003). Is retirement good or bad for mental and physical health functioning? Whitehall II longitudinal study of civil servants. Journal of Epidemiology and Community Health, 57(1), 46–49. Retrieved from http://www.ncbi.nlm.nih.gov/pubmed/12490648
- Miech, R. A., & Shanahan, M. J. (2000). Socioeconomic status and depression over the life course. Journal of Health and Social Behavior, 41(2), 162–176.
- Nagin, D. S. (2005). Group-based modeling of development. Cambridge, MA: Harvard University Press.
- Nagin, D. S., & Odgers, C. L. (2010). Group-based trajectory modeling in clinical research. Annual Review of Clinical Psychology, 6, 109–138. doi:10.1146/annurev.clinpsy.121208.131413 Retrieved from http://www.ncbi.nlm.nih.gov/pubmed/20192788
- Nyberg, A., Peristera, P., Westerlund, H., Johansson, G., & Magnusson Hansson, L. (2016). Does job promotion affect men's and women's health differently? Dynamic panel models with fixed effects. International Journal of Epidemiology, 46, 1137–1146. doi:10.1093/ije/dyw310
- Oksanen, T., Vahtera, J., Westerlund, H., Pentti, J., Sjosten, N., Virtanen, M., … Kivimaki, M. (2011). Is retirement beneficial for mental health?: Antidepressant use before and after retirement. Epidemiology, 22(4), 553–559. doi:10.1097/EDE.0b013e31821c41bd Retrieved from http://www.ncbi.nlm.nih.gov/pubmed/21502864
- Olesen, K., Rod, N. H., Madsen, I. E., Bonde, J. P., & Rugulies, R. (2015). Does retirement reduce the risk of mental disorders? A national registry-linkage study of treatment for mental disorders before and after retirement of 245,082 Danish residents. Occupational and Environmental Medicine, 72(5), 366–372. doi:10.1136/oemed-2014-102228 Retrieved from https://www.ncbi.nlm.nih.gov/pubmed/25814269
- Peyrot, W. J., Lee, S. H., Milaneschi, Y., Abdellaoui, A., Byrne, E. M., Esko, T., … Penninx, B. W. J. H. (2015). The association between lower educational attainment and depression owing to shared genetic effects? Results in ∼25,000 subjects. Molecular Psychiatry, 20(6), 735–743. doi:10.1038/mp.2015.50 . Retrieved from https://www.ncbi.nlm.nih.gov/pubmed/25917368
- R Development Core Team. (2008). R: A language and environment for statistical computing. Wienna: R Foundation for Statistical Computing.
- Reitzes, D. C., Mutran, E. J., & Fernandez, M. E. (1996). Does retirement hurt well-being? Factors influencing self-esteem and depression among retirees and workers. The Gerontologist, 36(5), 649–656. Retrieved from http://www.ncbi.nlm.nih.gov/pubmed/8942108
- Singh-Manoux, A., Adler, N. E., & Marmot, M. G. (2003). Subjective social status: Its determinants and its association with measures of ill-health in the Whitehall II study. Social Science & Medicine, 56(6), 1321–1333. Retrieved from https://www.ncbi.nlm.nih.gov/pubmed/12600368
- Statistics Sweden. (2014). Women and men in Sweden 2014. Facts and figures. Stockholm: Statistics Sweden.
- Vahtera, J., Westerlund, H., Hall, M., Sjosten, N., Kivimaki, M., Sal, O. P., … Zins, M. (2009). Effect of retirement on sleep disturbances: The GAZEL prospective cohort study. Sleep, 32(11), 1459–1466. Retrieved from https://www.ncbi.nlm.nih.gov/pubmed/19928385
- van der Heide, I., van Rijn, R. M., Robroek, S. J., Burdorf, A., & Proper, K. I. (2013). Is retirement good for your health? A systematic review of longitudinal studies. BMC Public Health, 13, 1180. doi:10.1186/1471-2458-13-1180 Retrieved from http://www.ncbi.nlm.nih.gov/pubmed/24330730
- Westerlund, H., Kivimaki, M., Singh-Manoux, A., Melchior, M., Ferrie, J. E., Pentti, J., … Vahtera, J. (2009). Self-rated health before and after retirement in France (GAZEL): A cohort study. The Lancet, 374(9705), 1889–1896. doi:10.1016/S0140-6736(09)61570-1 Retrieved from http://www.ncbi.nlm.nih.gov/pubmed/19897238
- Westerlund, H., Vahtera, J., Ferrie, J. E., Singh-Manoux, A., Pentti, J., Melchior, M., … Kivimaki, M. (2010). Effect of retirement on major chronic conditions and fatigue: French GAZEL occupational cohort study. BMJ, 341, c6149. doi:10.1136/bmj.c6149 Retrieved from http://www.ncbi.nlm.nih.gov/pubmed/21098617
- Zins, M., Gueguen, A., Kivimaki, M., Singh-Manoux, A., Leclerc, A., Vahtera, J., … Goldberg, M. (2011). Effect of retirement on alcohol consumption: Longitudinal evidence from the French Gazel cohort study. PLoS One, 6(10), e26531. doi:10.1371/journal.pone.0026531 Retrieved from http://www.ncbi.nlm.nih.gov/pubmed/22028898