
Abstract
Objectives: There is strong evidence about the association between low socioeconomic status (SES) and higher risk of dementia. However, it has not been conveniently addressed so far the role of SES on the incidence of mild cognitive impairment (MCI). This study examines the impact of individual and neighbourhood dimensions of SES, as well as their interaction, on the risk of developing MCI in a sample of older adults.
Method: Data from the Vallecas Project cohort, an ongoing community-based longitudinal study for early detection of cognitive impairment and dementia, were used to build two indices of SES namely individual and neighbourhood, as well as a global SES as a combination of both, and to investigate their effects on MCI conversion by means of a multivariate-adjusted Cox proportional hazard model.
Results: A total of 1180 participants aged 70 years and older were enrolled in this study. Of these, 199 cases of MCI (16.9%) were diagnosed at any point of the follow-up. The individual and neighbourhood dimensions of SES played different roles in the dynamics of the MCI occurrence through aging. Most importantly, the risk of developing MCI was almost double for lower SES quartiles when compared to the highest one.
Conclusion: The incidence of MCI in older adults was related to both individual characteristics and socioeconomic context. Public health strategies should be holistic and focus not only on promoting the classical individual preventive measures, but also on reducing social inequalities to foster healthy aging and reduce dementia burden.
Introduction
In the last years social phenomena have been incorporated into the scope of neuroscience, especially neuroepidemiology, to better explain individual behaviour, dysfunction and disease. The socioeconomic status (SES), that was a mere covariate in statistical analyses, has become a topic of interest for researchers in its own right (Farah, Citation2017). SES is a complex construct that reflects the overall position in the society of a person. Thus, SES is often operationalized as a combination of education, occupation, income, and other related familiar and neighbourhood characteristics such as exposure to violence, pollution, parental and health care or cognitively stimulating environment (Krieger, Williams, & Moss, Citation1997). A good understanding of how SES interacts with both healthy and pathological human development is a crucial issue for public health.
Although in general terms SES could be conceptualized as a continuum from worst to best off in which those who are better off have access to more material and non-material resources, SES is typically divided into levels to refer to the places where an individual can be situated (e.g. quintiles, quartiles, etc.). The utility of SES lies precisely in its ability to place a person in a continuum in relation to the others. Consequently, the SES has been analysed as a predictor of a broad range of health variables. In particular, higher SES have been associated with lower rates of some physical conditions such as coronary disease, diabetes, stroke, cancer, and arthritis (Adler & Stewart, Citation2010), or psychiatric illnesses such as depression or anxiety (Kessler et al., Citation2005; Lorant et al., Citation2003). Regarding cognition, it has been demonstrated an association between SES and cognitive performance in adults across lifespan, independent of other individual demographic and health characteristics (Besser, McDonald, Song, Kukull, & Rodriguez, Citation2017; Lorant et al., Citation2003; Weng et al., Citation2018). There has also been evidenced an association between SES and the incidence of dementia (Cadar et al., Citation2018; Nakahori et al., Citation2018), as well as with mortality (Åberg Yngwe, Kondo, Hägg, & Kawachi, Citation2012; Russ et al., Citation2013; van de Vorst, Koek, Stein, Bots, & Vaartjes, Citation2016). However, it has not been conveniently addressed so far the role of SES on the incidence of Mild Cognitive Impairment (MCI) which is considered a prodromal stage of latter dementia (Jack et al., Citation2018; Petersen, Citation2004).
Socioeconomic factors could affect health at different times in the lifespan, at distinct levels (e.g. individual, familiar, or area-based), and through different causal pathways (e.g. by determining exposures, vulnerability, or direct physiological effects) (Braveman et al., Citation2005). In research practice SES is often indirectly estimated in terms of individual factors, specifically education and occupation, or in terms of area-based characteristics such as the context or the neighbourhood where a person lives. Therefore, two dimensions of SES namely individual SES (ISES) or neighbourhood SES (NSES) could be differentiated.
The main aim of the present study is to examine the impact of ISES and NSES, as well as their interaction, on the risk of developing MCI over time in a sample of people over 70 years of age who have been followed-up for seven years.
Methods
Participants
The Vallecas Project is an ongoing community-based longitudinal investigation for early detection of cognitive impairment and dementia (Olazarán et al., Citation2015). The study began in October 2011 and currently 6 complete waves of data collection have been performed over a follow-up period of 7 years. At baseline 1180 community-dwelling individuals aged 70 and over were enrolled. All participants have undergone a detailed assessment protocol at every wave including medical history, neurological and neuropsychological examination, biochemical and genetic blood test, MRI scan, as well as information on lifestyle, well-being and socioeconomic circumstances. The complete assessment at every visit has been usually carried out within four hours with convenient breaks. Ethical approval for the Vallecas Project was granted by the Research Ethics Committee of the Carlos III Institute of Health. Written informed consent was obtained from all the participants.
Study variables
Socioeconomic indicators
Different socioeconomic features were measured at baseline to ascertain two composite measures of SES:
ISES index was estimated according to the following three variables:
Educational attainment: (0) no formal qualifications; (1) primary education; (2) secondary education; and (3) higher education.
Occupation: (0) non-qualified/homemaker; (1) manual work; (2) clerical work; (3) graduate/technician work; and (4) managerial positions.
The highest level of education reached by parents: (0) no formal qualifications; (1) primary education; and (2) secondary or higher education.
NSES index was based on the administrative boundaries of the city of Madrid, Spain. The city is divided into 21 districts (metropolitan boroughs) which are further subdivided into 131 administrative neighbourhoods. The addresses of all participants were collected, encoded and linked at baseline to their corresponding neighbourhoods where they resided. A total of 111 neighbourhoods were finally included in the analyses. Then, the following public data were retrieved from the Department of Statistics of Madrid City Council (https://datos.madrid.es/portal/site/egob) for every neighbourhood: average annual net income (up to €24,999; €25,000–€49,999; €50,000 and over), % of resident with no formal qualifications, % of residents with higher education, % of residents with white-collar jobs, unemployment rate, and housing price (€/square meter).
Each individual and neighbourhood variable was firstly standardized as z-score to facilitate comparisons; then, a mean composite z-score was calculated for every participant both in the ISES and in the NSES dimensions. Finally, the distribution of composite z-scores was split into quartiles where Q1 represented the worst-off and Q4 the best-off.
Clinical diagnoses
Cognitive status of every participant was diagnosed after each visit taking into account his/her age, gender, cognitive reserve, functional information, and cognitive scores. Cognitive diagnoses were agreed between neurologists and neuropsychologists at consensus meetings. MRIs were done to rule out the presence of macroscopic lesions or significant vascular damage which could interfere with cognitive performance. Criteria from the National Institute on Aging-Alzheimer´s Association (NIA-AA) were used to diagnose MCI and mild dementia (Albert et al., Citation2011). All cognitively healthy subjects had a score = 0 in the global Clinical Dementia Rating (CDR) (Hughes, Berg, Danziger, Coben, & Martin, Citation1982) while MCI and mild dementia cases scored 0.5 and 1, respectively.
Covariates
For the purposes of our study we analysed the association of ISES and NSES with the following set of variables collected in the Vallecas Project at baseline: (i) Demographics: age, education, occupation, gender, ApoE; (ii) Clinical: hypertension, cholesterol, diabetes, stroke with no apparent cognitive or motor impairment, smoking, depression, auditory deficit, visual deficit; (iii) Cognitive status: Mini Mental Status Examination (MMSE), Free and Cued Selective Reminding Test (FCSRT), Semantic fluency, Digit-Symbol Test, Functional Activities Questionnaire (FAQ), CDR; (iv) Neuroimaging: grey matter volume, white matter volume performed using FAST (FSL v6.0.1); (v) Motor exam: Up & Go test, Taps right hand, Taps left hand; (vi) Lifestyle: EuroQol-5D (EQ-5D), frequency of physical exercise, manual activities, leisure, creative activity, social activity, reading, and ICT use; (vii) Diet: frequency of fruit and vegetables consumption; and (viii) Anthropometric: weight, height, body mass index (BMI). We specially considered age at conversion to MCI, gender, and ApoE genotype as potential confounders for cognitive impairment. ApoE genotype was studied with total DNA isolated from peripheral blood following standard procedures. Genotyping of polymorphisms (rs429358 and rs7412) was performed by Real-Time PCR (Calero, Hortigüela, Bullido, & Calero, Citation2009). ApoE was coded 1 for the ε4-carriers, and 0 for non-carriers. Males and ε4 carriers were used as reference groups.
Statistical analyses
We performed a preliminary comparison of the demographic, individual and neighbourhood variables between cognitively normal and MCI cases. Categorical variables were analysed using Fisher or Pearson´s χ2 test. The analyses of continuous variables were performed with the non-parametric Wilcoxon test due to the different sample sizes and to the non-adjustment to the parametric assumptions of most of them. Then an analysis of demographic, clinical, cognitive, neuroimaging, motor, lifestyle, dietary and anthropometric variables at baseline was compared by ISES and NSES quartiles.
Both ISES and NSES were treated as four-level independent variables defined by the quartile; upper quartile was always used as the reference group in the analyses. An exploratory study of the associations between ISES, NSES, and the last cognitive diagnosis registered in the follow-up for every participant was performed by means of contingency tables. Moreover, to analyse longitudinally the relationship between ISES, NSES, and conversion rate to MCI, two multivariate-adjusted Cox proportional hazard models were obtained and their results were presented as hazard ratio (HR) with a 95% confidence interval (CI). Time to event was calculated as date of entry into the study to date of MCI diagnosis or the end of the follow-up period. Age at MCI onset, gender, ApoE genotype, hypertension, cholesterol, diabetes, smoking, BMI, and depression were introduced as covariates. The Schoenfeld residual test was used to test the proportional hazards assumption of the models. Finally, to study the interaction between the individual and the neighbourhood dimensions of SES upon the MCI conversion, we created a new variable by crossing lower and upper quartiles of the ISES and the NSES. This resulted in a global SES (GSES) dimension with 4 categories ordered from the highest (Qgses1) to the lowest (Qgses4) risk of MCI conversion. Then, a final third Cox proportional hazard model was obtained for GSES.
All analyses were conducted in R version 3.5.1. (R Development Core Team, Citation2008). We used 2-sided significance tests for all analyses, with statistical significance set at p < 0.05.
Results
The sample analysed in this study included 1180 individuals (median follow-up duration, 5 years; range, 1–7 years). The baseline diagnoses were 1088 cognitively normal individuals, 83 MCI cases and 9 dementia patients. shows the baseline characteristics of the sample.
Table 1. Baseline characteristics of the cohort by final clinical diagnosis.
The comparison of cognitively unimpaired and MCI subjects showed statistically significant differences in all the individual and neighbourhood characteristics (). A strong association was also found between ISES and NSES quartiles and both diagnostic groups whereby the upper quartiles showed a lower percentage of MCI cases than the lower quartiles (). A complementary examination of a large set of diverse baseline variables by ISES and NSES also showed a straight and consistent linear trend in favour of higher versus lower quartiles of SES (). Similar results were found after controlling for the effect of gender.
Table 2. Baseline characteristics of the cohort by quartiles of individual and neighbourhood socioeconomic status.Table Footnotea
shows the percentage of individuals who were diagnosed as cognitively unimpaired throughout the visits at the Vallecas Project by ISES (bars in blue) and NSES (bars in red). The percentage of cognitively intact subjects decreased over the follow-up period and the number of MCI patients increased up to 199 subjects (16.9%). Interestingly, the age at MCI onset for lower quartiles (Q1-Q2) was earlier than for upper ones (Q3-Q4) both for ISES (77.1 vs. 79.8 years old) and for NSES (76.8 vs. 80.5 years old). Moreover, the distribution of the MCI prevalence by age is different for ISES and NSES as shown in .
Figure 1. Individuals diagnosed as cognitively unimpaired throughout the visits at the Vallecas Project. a) Cognitively unimpaired subjects by Individual Socioeconomic Status (ISES). b) Cognitively unimpaired subjects by Neighbourhood Socioeconomic Status (NSES).
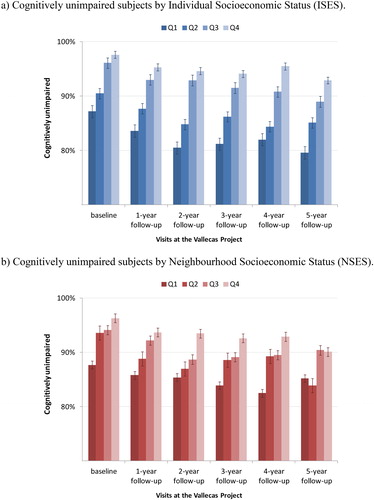
Figure 2. Mild Cognitive Impairment prevalence throughout aging. a) Prevalence of Mild Cognitive Impairment by Individual Socioeconomic Status (ISES) and age. b) Prevalence of Mild Cognitive Impairment by Neighbourhood Socioeconomic Status (NSES) and age. MCI, Mild Cognitive Impairment; Q, quartile. To better illustrate the rate of MCI progression according to age, the initial quartiles were collapsed into two categories representing lower (Q1–Q2) and upper (Q3–Q4) quartiles. As expected, there is an overall increase of MCI prevalence with age for both ISES (2a) and NSES (2b); lower quartiles show a major percentage of MCI diagnoses than upper quartiles, especially for ISES and between 70–80 years. However, some differences can be appreciated when inspecting both figures. While lower and upper quartiles in ISES follow the same trend with respect to MCI, in NSES there is a decrease in the percentage of individuals with MCI from the age of 85 onwards. This phenomenon is associated with the attrition of the cohort which is more marked in lower quartiles probably due to several factors intrinsically associated to NSES such as lower expectancy of life, major rate of disability, or worse general health status.
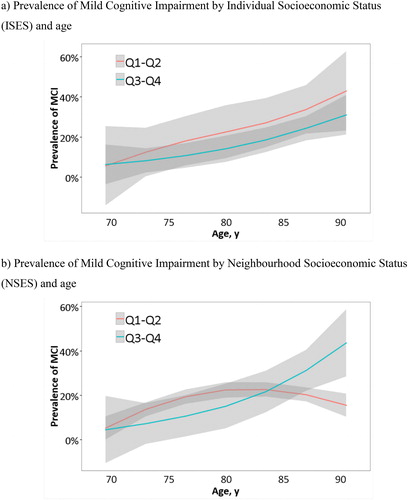
A significant association between SES and the last cognitive diagnosis was found for ISES (χ2 = 20.12; p = 0.003), with a greater percentage of MCI cases in lower versus upper quartiles especially at the ages of 75–85. However, only a similar but not significant pattern of results was observed for NSES until the age of 80 (χ2= 7.08; p = 0.314). shows that this outcome was mainly due to an unexpected decrease in the prevalence of MCI in the lower NSES quartiles in comparison to upper ones where prevalence continued to rise.
Finally, we performed Cox proportional hazard models with 911 participants who were diagnosed as cognitively healthy at baseline and at least they had two completed visits. The unadjusted models longitudinally confirmed the results that lower quartiles had an increased risk of progression to MCI compared to upper ones. Specifically, the analysis of the interaction of individual and neighbourhood dimensions showed that GSES Q1 and Q2 had about a 60–67% increased risk of MCI progression compared to GSES Q4. Kaplan-Meier plots showed clear differences in risk by Q1 and Q2 after 7 years of follow-up (). On the other hand, adjusted Cox regression models were also conducted to control the influence of age at MCI onset, gender, ApoE genotype, hypertension, cholesterol, diabetes, smoking, BMI, and depression upon GSES and its association with conversion to MCI. The multivariate adjusted HRs were 1.88 (95% CI = 1.05–3.35) for GSES Q1 and 1.68 (95% CI = 1.02–2.78) for GSES Q2 compared to GSES Q4 (). GSES Q3 did not differ from Q4.
Figure 3. Kaplan-Meier survival curves for rates of Mild Cognitive Impairment by Global Socioeconomic Status quartiles. Survival curves based on Cox regression analysis comparing cumulative Mild Cognitive Impairment (MCI) incidence in subjects cognitively normal at baseline by each Global Socioeconomic Status (GSES) quartile. The figure is derived from a model that is adjusted for age at diagnosis, sex and ApoE genotype. Duration of follow-up is truncated at 7 years. Q1 and Q2 show the highest risk of conversion to MCI compared with Q4.
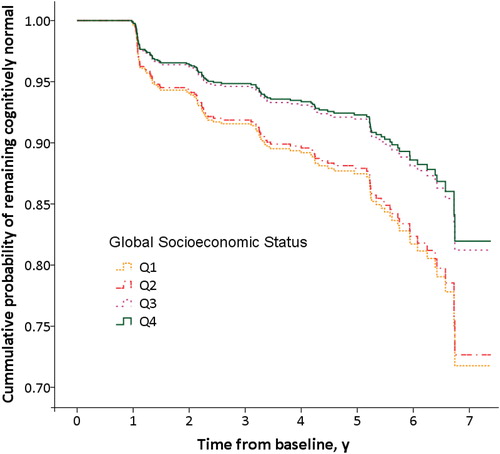
Table 3. Cox proportional hazard regression models of conversion rate to MCI.
Discussion
Our study aimed to examine the relative impact of individual and neighbourhood dimensions of SES, as well as their interaction, on the risk of developing MCI in a sample of older adults that were followed-up for seven years. We used a composite score to assess the SES and to explore its effect as a more robust construct than any individual variable. Overall, our results support the idea that there is a definite relationship between SES and the risk of developing MCI in elderly people.
A moderate-high overlapping between ISES and NSES was found in our sample. This fact seems to be mediated by individual factors, such as educational attainment, and indicate that there was very little social promotion in this cohort born between 1925 and 1944. This segment of population suffered most of the effects of the Spanish civil war (1936–1939) and its economic consequences at the post-war period. Individuals born in a disadvantaged environment were more likely to remain in a deprived environment because of the scarcity of opportunities to have good education as a way to reduce social inequalities. We hypothesize that this phenomenon is gradually being alleviated in next generations thanks to the improvement of the socioeconomic context and the universal access to education. The normalization of international relationships of Spain with the introduction of the parliamentary democracy after Franco's dictatorial regime has played an important role in shortening social distances in our country.
The linear trend in favour of higher versus lower levels of SES in a large set of baseline demographic, clinical, cognitive, grey and white matter volumetry, motor, functional and anthropometric variables are in agreement with other data in the literature showing with larger brain sizes (Waldstein et al., Citation2017), greater thicknesses of cortical grey matter and even brain´s functional network organization (Chan et al., Citation2018), better cognitive performance (Lyu & Burr, Citation2016; Marden, Tchetgen, Kawachi, & Glymour, Citation2017), and richer life-styles such as more high-quality food (Mayén, Marques-Vidal, Paccaud, Bovet, & Stringhini, Citation2014) or less smoking habits (Eibner & Evans, Citation2005) in high-SES individuals. Our results also showed that gender was not a confounder factor.
We also found an increase in the prevalence of the MCI as a function of age for ISES and NSES which is consistent with other similar studies (Kim et al., Citation2017; Wee et al., Citation2012). For both SES dimensions, subjects in lower quartiles showed a higher rate of MCI than those in upper ones, especially between 70 and 80 of age. However, as depicted in , the lower quartiles of ISES and NSES dimensions have different trends from 80 years: the prevalence of MCI increased in ISES, but in NSES decreased. This outcome could be related to the sample attrition which is more marked to persons living in deprived areas. Several factors intrinsically associated with NSES, such as greater morbidity and earlier mortality (Kopp, Skrabski, Réthelyi, Kawachi, & Adler, Citation2004), major rate of physical disability and worse general health status (Veenstra, Citation2000), and greater stress and worse psychological well-being (Everson-Rose et al., Citation2011; Präg, Mills, & Wittek, Citation2016) may explain the differential attrition. Individuals over 80 years living in the most deprived neighbourhoods are more likely to drop out the study and those who remain are probably in better physical and cognitive health conditions determining a decrease of the prevalence of MCI in our study. This may not be the case for the individual dimension of SES as the variables that make up the ISES index are more cross-sectional and spread across the continuum. Ultimately, reflects the importance of considering the conjunction of ISES and NSES dimensions to better explain the dynamics in the occurrence of the MCI.
The impact of GSES on the conversion rate to MCI during 7-year follow-up showed that the risk of developing cognitive impairment was almost double for lower quartiles than for upper ones. According to our results, elderly people with low-GSES have 60–67% increased risk of developing MCI than those with high-GSES. Thus, low-GSES may be considered a risk factor for MCI. These data are consistent with previous findings in the literature (Goldbourt, Schnaider-Beeri, & Davidson, Citation2007; Kim et al., Citation2017) and could have several explanations. First, high-SES is usually related to wealth and associated with the availability of better products, goods and services providing positive effects upon health and cognition (Diez Roux & Mair, Citation2010; Rosso et al., Citation2016). Second, high-SES is also related to cognitive enriched environments which favour the growth of social networks, emotional support, major sense of social effectiveness, and better general health condition (Berkman, Glass, Brissette, & Seeman, Citation2000; Kim & Park, Citation2015). Third, NSES is able to influence individual´s health through a series of environmental variables that include exposures to crime or pollution, proximity to services such as hospitals or parks, etc. (Sharkey & Faber, Citation2014). Fourth, low-NSES have often more chronic stressors and fewer resources compared to high-NSES, and this might lead to restricted opportunities for social and cognitive stimulation as well as less access to good health services (Barnes, Mendes de Leon, Wilson, Bienias, & Evans, Citation2004; Ertel, Glymour, & Berkman, Citation2008). Fifth, individuals with low-SES tend to be more depressed and stressed due to their difficulty making ends meet and may have a faster aging (Kondo, Citation2012). Finally, high-SES might not only improve life conditions but also facilitate the ability and motivation to participate in activities that improve the well-being and indirectly help to prevent cognitive disorders (Sattler, Toro, Schönknecht, & Schröder, Citation2012).
In terms of the cognitive reserve hypothesis (Stern, Citation2002, Citation2012), and based on our results, we propose that the two SES dimensions considered in this study play complementary roles in brain and cognitive functioning. On the one hand, ISES which was defined as a combination of three factors -educational attainment, occupation and parents´ level of education- appears to be associated with the concept of cognitive reserve. High-ISES would be related to a greater acquisition of knowledge and effective cognitive strategies from childhood to adulthood. In addition, high-SES individuals tend to have healthy behaviours which include read and practice more cultural and leisure activities and also help to maintain cognitive reserve capacity (Pampel, Krueger, & Denney, Citation2010). This would explain why MCI is more prevalent for low-ISES than high-ISES through the lifespan because cognitive reserve is able to compensate the neuropathological damages related to aging. On the other hand, NSES, a composite score based on characteristics of the neighbourhood in which a person lives, seems to impact further on brain reserve. The best living conditions (e.g. diet, cognitive stimulation, access to health services, etc.) that are supposedly associated with high-NSES, especially in the early life, would allow for greater neurocognitive and brain development (Hackman, Farah, & Meaney, Citation2010). In any event, early experiences like amount and quality of education could override the influences of the neighbourhood context, being more important in predicting later cognitive performance (Glymour & Manly, Citation2008).
The findings of this study have two important implications for health care. First, the dynamics and prevalence of MCI through aging is conditioned by the SES of individuals and health care professionals should take into account both the individual characteristics and the socioeconomic context to better understand MCI. Second, it is crucial to go beyond the classical perspective on individual preventive strategies for dementia based on lifestyle modifications (e.g. diet, physical activity or cognitive training). Programs and policies targeting the reduction of social inequalities may also offer a means of promoting healthy aging in society. For example, policies aimed at reducing disparities in wealth or favouring access to educational or health resources for the most disadvantaged people. The understanding of how SES relates to cognitive function could help policy-makers to design strategies for prevention and intervention for older adults (Hackman et al., Citation2010; Meyer et al., Citation2018).
Strengths
To our knowledge, this is the first longitudinal study that examines separately the influence of the two dimensions of SES on the prevalence of MCI, a prodromal stage that increases the probability of suffering latter dementia (Jack et al., Citation2018; Petersen, Citation2004). Through a 7-year follow-up of a well-characterized and annually tracked cohort of older adults and the official and accurate data about neighbourhoods provided by the Department of Statistics of Madrid City Council, we have been able to demonstrate the association of low ISES and NSES with cognitive diagnose of MCI.
Limitations
There is a lack of longitudinal information on individuals who discontinued the study. Therefore, we don’t know the mortality rate of the entire cohort and we can only speculate on the reason for the loss of subjects in NSES Q1 and Q2 after 80 years of age. Moreover, MCI is a multifactorial condition that can be produced by a set of candidate causes, both reversible and non-reversible (Petersen et al., Citation2014); since we do not have specific biological information we cannot determine the aetiology of every MCI case. The effect of other variables associated with SES was not appropriately measured; for instance, individual earnings could be more relevant to this study than the income associated with the neighbourhood of residence. Finally, the influence of other well-established risk factors such as alcohol and drug abuse was not thoroughly studied. Nevertheless, both were exclusion criteria to participate in the project and so we do not have any significant number of individuals suffering from these conditions to increase the risk of developing a neurodegenerative disease.
Conclusions
In a well-characterized Spanish cohort of older adults, the risk of MCI was associated with the two dimensions of SES, and specifically the effect of ISES was consistently higher. However, since ISES and NSES have different effects mediated by age on cognitive impairment, the interplay of both SES dimensions must be considered. Public health strategies should focus not only on promoting the classical individual preventive measures (e.g. through lifestyle modification), but also on reducing social inequalities (e.g. by favouring access to educational and health resources for the most disadvantaged people) as a means to foster healthy aging and reduce dementia burden.
Acknowledgement
We wish to thank the research participants and the staff of the CIEN Foundation.
Disclosure statement
No potential conflict of interest was reported by the authors.
Additional information
Funding
References
- Åberg Yngwe, M., Kondo, N., Hägg, S., & Kawachi, I. (2012). Relative deprivation and mortality–A longitudinal study in a Swedish population of 4.7 million, 1990–2006. BMC Public Health, 12(1), 664. doi:10.1186/1471-2458-12-664
- Adler, N. E., & Stewart, J. (2010). Health disparities across the lifespan: Meaning, methods, and mechanisms. Annals of the New York Academy of Sciences, 1186(1), 5–23. doi:10.1111/j.1749-6632.2009.05337.x
- Albert, M. S., DeKosky, S. T., Dickson, D., Dubois, B., Feldman, H. H., Fox, N. C., … Phelps, C. H. (2011). The diagnosis of mild cognitive impairment due to Alzheimer’s disease: Recommendations from the National Institute on Aging and Alzheimer’s Association workgroup. Alzheimer's & Dementia, 7(3), 270–279. doi:10.1016/j.jalz.2011.03.008
- Barnes, L. L., Mendes de Leon, C. F., Wilson, R. S., Bienias, J. L., & Evans, D. A. (2004). Social resources and cognitive decline in a population of older African Americans and whites. Neurology, 63(12), 2322–2326. doi:10.1212/01.WNL.0000147473.04043.B3
- Berkman, L. F., Glass, T., Brissette, I., & Seeman, T. E. (2000). From social integration to health: Durkheim in the new millennium. Social Science & Medicine (1982), 51(6), 843–857. doi:10.1016/S0277-9536(00)00065-4
- Besser, L. M., McDonald, N. C., Song, Y., Kukull, W. A., & Rodriguez, D. A. (2017). Neighborhood environment and cognition in older adults: A systematic review. American Journal of Preventive Medicine, 53(2), 241–251. doi:10.1016/j.amepre.2017.02.013
- Braveman, P. A., Cubbin, C., Egerter, S., Chideya, S., Marchi, K. S., Metzler, M., & Posner, S. (2005). Socioeconomic status in health research. JAMA, 294(22), 2879. doi:10.1001/jama.294.22.2879
- Cadar, D., Lassale, C., Davies, H., Llewellyn, D. J., Batty, G. D., & Steptoe, A. (2018). Individual and area-based socioeconomic factors associated with dementia incidence in England. JAMA Psychiatry, 75(7), 723. doi:10.1001/jamapsychiatry.2018.1012
- Calero, O., Hortigüela, R., Bullido, M. J., & Calero, M. (2009). Apolipoprotein E genotyping method by Real Time PCR, a fast and cost-effective alternative to the TaqMan® and FRET assays. Journal of Neuroscience Methods, 183(2), 238–240. doi:10.1016/j.jneumeth.2009.06.033
- Chan, M. Y., Na, J., Agres, P. F., Savalia, N. K., Park, D. C., & Wig, G. S. (2018). Socioeconomic status moderates age-related differences in the brain’s functional network organization and anatomy across the adult lifespan. Proceedings of the National Academy of Sciences, 115(22), E5144–E5153. doi:10.1073/pnas.1714021115
- Diez Roux, A. V., & Mair, C. (2010). Neighborhoods and health. Annals of the New York Academy of Sciences, 1186(1), 125–145. doi:10.1111/j.1749-6632.2009.05333.x
- Eibner, C., & Evans, W. N. (2005). Relative deprivation, poor health habits, and mortality. Journal of Human Resources, 40(3), 591–620. doi:10.2307/4129553
- Ertel, K. A., Glymour, M. M., & Berkman, L. F. (2008). Effects of social integration on preserving memory function in a nationally representative US elderly population. American Journal of Public Health, 98(7), 1215–1220. doi:10.2105/AJPH.2007.113654
- Everson-Rose, S. A., Skarupski, K. A., Barnes, L. L., Beck, T., Evans, D. A., & Mendes de Leon, C. F. (2011). Neighborhood socioeconomic conditions are associated with psychosocial functioning in older black and white adults. Health & Place, 17(3), 793–800. doi:10.1016/j.healthplace.2011.02.007
- Farah, M. J. (2017). The neuroscience of socioeconomic status: Correlates, causes, and consequences. Neuron, 96(1), 56–71. doi:10.1016/j.neuron.2017.08.034
- Glymour, M. M., & Manly, J. J. (2008). Lifecourse social conditions and racial and ethnic patterns of cognitive aging. Neuropsychology Review, 18(3), 223–254. doi:10.1007/s11065-008-9064-z
- Goldbourt, U., Schnaider-Beeri, M., & Davidson, M. (2007). Socioeconomic status in relationship to death of vascular disease and late-life dementia. Journal of the Neurological Sciences, 257(1-2), 177–181. doi:10.1016/j.jns.2007.01.021
- Hackman, D. A., Farah, M. J., & Meaney, M. J. (2010). Socioeconomic status and the brain: Mechanistic insights from human and animal research. Nature Reviews Neuroscience, 11(9), 651–659. doi:10.1038/nrn2897
- Hughes, C. P., Berg, L., Danziger, W., Coben, L. A., & Martin, R. L. (1982). A new clinical scale for the staging of dementia. British Journal of Psychiatry, 140(6), 566–572. doi:10.1192/bjp.140.6.566
- Jack, C. R., Bennett, D. A., Blennow, K., Carrillo, M. C., Dunn, B., Haeberlein, S. B., … Contributors, R. (2018). NIA-AA Research Framework: Toward a biological definition of Alzheimer’s disease. Alzheimer's & Dementia, 14(4), 535–562. doi:10.1016/j.jalz.2018.02.018
- Kessler, R. C., Berglund, P., Demler, O., Jin, R., Merikangas, K. R., & Walters, E. E. (2005). Lifetime prevalence and age-of-onset distributions of DSM-IV disorders in the national comorbidity survey replication. Archives of General Psychiatry, 62(6), 593. doi:10.1001/archpsyc.62.6.593
- Kim, G. H., Lee, H. A., Park, H., Lee, D. Y., Jo, I., Choi, S. H., … Jeong, J. H. (2017). Effect of individual and district-level socioeconomic disparities on cognitive decline in community-dwelling ederly in Seoul. Journal of Korean Medical Science, 32(9), 1508. doi:10.3346/jkms.2017.32.9.1508
- Kim, J.-H., & Park, E.-C. (2015). Impact of socioeconomic status and subjective social class on overall and health-related quality of life. BMC Public Health, 15(1), 783. doi:10.1186/s12889-015-2014-9
- Kondo, N. (2012). Socioeconomic disparities and health: Impacts and pathways. Journal of Epidemiology, 22(1), 2–6. doi:10.2188/jea.JE20110116
- Kopp, M., Skrabski, A., Réthelyi, J., Kawachi, I., & Adler, N. E. (2004). Self-rated health, subjective social status, and middle-aged mortality in a changing society. Behavioral Medicine ( Medicine, ), 30(2), 65–70. doi:10.3200/BMED.30.2.65-72
- Krieger, N., Williams, D. R., & Moss, N. E. (1997). Measuring social class in US public health research: Concepts, methodologies, and guidelines. Annual Review of Public Health, 18(1), 341–378. doi:10.1146/annurev.publhealth.18.1.341
- Lorant, V., Deliège, D., Eaton, W., Robert, A., Philippot, P., & Ansseau, M. (2003). Socioeconomic inequalities in depression: A meta-analysis. American Journal of Epidemiology, 157(2), 98–112. doi:10.1093/aje/kwf182
- Lyu, J., & Burr, J. A. (2016). Socioeconomic status across the life course and cognitive function among older adults. Journal of Aging and Health, 28(1), 40–67. doi:10.1177/0898264315585504
- Marden, J. R., Tchetgen, E. J., Kawachi, I., & Glymour, M. M. (2017). Contribution of socioeconomic status at 3 life-course periods to late-life memory function and decline: Early and late predictors of dementia risk. American Journal of Epidemiology, 186(7), 805–814. doi:10.1093/aje/kwx155
- Mayén, A.-L., Marques-Vidal, P., Paccaud, F., Bovet, P., & Stringhini, S. (2014). Socioeconomic determinants of dietary patterns in low- and middle-income countries: A systematic review. The American Journal of Clinical Nutrition, 100(6), 1520–1531. doi:10.3945/ajcn.114.089029
- Meyer, O. L., Mungas, D., King, J., Hinton, L., Farias, S., Reed, B., … Beckett, L. (2018). Neighborhood socioeconomic status and cognitive trajectories in a diverse longitudinal cohort. Clinical Gerontologist, 41(1), 82–93. doi:10.1080/07317115.2017.1282911
- Nakahori, N., Sekine, M., Yamada, M., Tatsuse, T., Kido, H., & Suzuki, M. (2018). A pathway from low socioeconomic status to dementia in Japan: Results from the Toyama dementia survey. BMC Geriatrics, 18(1), 102. doi:10.1186/s12877-018-0791-6
- Olazarán, J., Valentí, M., Frades, B., Zea-Sevilla, M. A., Ávila-Villanueva, M., Fernández-Blázquez, M. Á., … Martínez-Martín, P. (2015). The Vallecas Project: A cohort to identify early markers and mechanisms of Alzheimer’s disease. Frontiers in Aging Neuroscience, 7, 181. doi:10.3389/fnagi.2015.00181
- Pampel, F. C., Krueger, P. M., & Denney, J. T. (2010). Socioeconomic disparities in health behaviors. Annual Review of Sociology, 36(1), 349–370. doi:10.1146/annurev.soc.012809.102529
- Petersen, R. C. (2004). Mild cognitive impairment as a diagnostic entity. Journal of Internal Medicine, 256(3), 183–194. doi:10.1111/j.1365-2796.2004.01388.x
- Petersen, R. C., Caracciolo, B., Brayne, C., Gauthier, S., Jelic, V., & Fratiglioni, L. (2014). Mild cognitive impairment: A concept in evolution. Journal of Internal Medicine, 275(3), 214–228. doi:10.1111/joim.12190
- Präg, P., Mills, M. C., & Wittek, R. (2016). Subjective socioeconomic status and health in cross-national comparison. Social Science & Medicine , 149, 84–92. doi:10.1016/j.socscimed.2015.11.044
- R Development Core Team. (2008). R: A language and environment for statistical computing. Vienna: R Foundation for Statistical Computing. Retrieved from http://www.r-project.org
- Rosso, A. L., Flatt, J. D., Carlson, M. C., Lovasi, G. S., Rosano, C., Brown, A. F., … Gianaros, P. J. (2016). Neighborhood socioeconomic status and cognitive function in late life. American Journal of Epidemiology, 183(12), 1088–1097. doi:10.1093/aje/kwv337
- Russ, T. C., Stamatakis, E., Hamer, M., Starr, J. M., Kivimäki, M., & Batty, G. D. (2013). Socioeconomic status as a risk factor for dementia death: Individual participant meta-analysis of 86 508 men and women from the UK. British Journal of Psychiatry, 203(1), 10–17. doi:10.1192/bjp.bp.112.119479
- Sattler, C., Toro, P., Schönknecht, P., & Schröder, J. (2012). Cognitive activity, education and socioeconomic status as preventive factors for mild cognitive impairment and Alzheimer’s disease. Psychiatry Research, 196(1), 90–95. doi:10.1016/j.psychres.2011.11.012
- Sharkey, P., & Faber, J. W. (2014). Where, when, why, and for whom do residential contexts matter? Moving away from the dichotomous understanding of neighborhood effects. Annual Review of Sociology, 40(1), 559–579. doi:10.1146/annurev-soc-071913-043350
- Stern, Y. (2002). What is cognitive reserve? Theory and research application of the reserve concept. Journal of the International Neuropsychological Society, 8(3), 448–460. doi:10.1017/S1355617702813248
- Stern, Y. (2012). Cognitive reserve in ageing and Alzheimer’s disease. The Lancet Neurology, 11(11), 1006–1012. doi:10.1016/S1474-4422(12)70191-6
- van de Vorst, I. E., Koek, H. L., Stein, C. E., Bots, M. L., & Vaartjes, I. (2016). Socioeconomic disparities and mortality after a diagnosis of dementia: Results from a nationwide registry linkage study. American Journal of Epidemiology, 184(3), 219–226. doi:10.1093/aje/kwv319
- Veenstra, G. (2000). Social capital, SES and health: An individual-level analysis. Social Science & Medicine (1982), 50(5), 619–629. doi:10.1016/S0277-9536(99)00307-X
- Waldstein, S. R., Dore, G. A., Davatzikos, C., Katzel, L. I., Gullapalli, R., Seliger, S. L., … Zonderman, A. B. (2017). Differential associations of socioeconomic status with global brain volumes and white matter lesions in African American and White adults. Psychosomatic Medicine, 79(3), 327–335. doi:10.1097/PSY.0000000000000408
- Wee, L. E., Yeo, W. X., Yang, G. R., Hannan, N., Lim, K., Chua, C., … Shen, H. M. (2012). Individual and area level socioeconomic status and its association with cognitive function and cognitive impairment (low MMSE) among community-dwelling elderly in Singapore. Dementia and Geriatric Cognitive Disorders Extra, 2(1), 529–542. doi:10.1159/000345036
- Weng, P.-H., Chen, J.-H., Chiou, J.-M., Tu, Y.-K., Chen, T.-F., Chiu, M.-J., … Chen, Y.-C. (2018). The effect of lifestyle on late-life cognitive change under different socioeconomic status. PLoS One, 13(6), e0197676. doi:10.1371/journal.pone.0197676