
Abstract
Objectives
Against the background of the growing recognition of the need for a holistic perspective on health behaviour, we aim to identify longitudinal patterns of multiple health behaviours, and to assess associations of such patterns with depressive symptoms among older people in China.
Methods
Using three waves of China Health and Retirement Longitudinal Study data (n = 8439), we performed latent class growth analyses (LCGAs) to identify longitudinal patterns of multiple health behaviours. Random-effects models were estimated to assess associations between health behaviour patterns and depressive symptoms.
Results
The best fitting LCGA model had seven classes: (1) connected active non-smokers (average posterior probability: 21.8%), (2) isolated active non-smokers (24.7%), (3) isolated inactive non-smokers (17.0%), (4) isolated active smokers (14.5%), (5) connected active smokers (12.2%), (6) increasingly connected and active non-smokers (5.4%), and (7) moderately connected inactive smokers (4.4%). Depressive symptoms were highest in the four classes with lower probabilities of social participation across waves. No evidence was found of change over time in depressive symptomatology gaps between people with different health behaviour trajectories.
Conclusion
Health behaviour patterns characterized by consistently low social participation were associated with raised depressive symptomatology, suggesting that focusing on social participation may benefit later-life mental health promotion strategies.
Introduction
Depression has become the single greatest cause of disability and a major contributor to disease burden globally, affecting approximately 280 million people worldwide (World Health Organization, Citation2021). Although the prevalence of depression is, overall, lower in China than in Western countries (Kendler et al., Citation2015), older adults in China are at a greater risk of depression than their counterparts in other East Asian countries (Lei et al., Citation2014). Depressive symptoms have been associated with modifiable unhealthy behaviours, such as physical inactivity (cf. Bishwajit et al., Citation2017; Verger et al., Citation2009). Given that people in China tend to feel ashamed to seek professional help for depressive symptoms (Phillips et al., Citation2009), preventive strategies that involve lifestyle modification may be particularly promising in efforts to counter later-life depression in the Chinese context.
In the past two decades, researchers have begun to recognize that health behaviours do not occur in isolation; instead, they are interrelated and cluster together (Conry et al., Citation2011; deRuiter et al., Citation2014; Fine et al., Citation2004; Poortinga, Citation2007; Van den Broek, Citation2021a). Consequently, the number of studies focusing on multiple health behaviours has increased rapidly, and such research is considered to represent the future of preventive medicine (Prochaska, Citation2008).
The investigation of multiple health behaviours in conjunction is important for several reasons. First, clustered behaviours may have synergistic effects on health outcomes (Johnson et al., Citation2018; Poortinga, Citation2007)that are more potent than the behaviours’ individual effects (Conry et al., Citation2011). Second, a phenomenon called health behaviour overshadowing may occur. That is, the detrimental effects of certain unhealthy behaviours may be so impactful that they render other health behavioural dimensions largely irrelevant (Shaw & Agahi, Citation2012, Citation2014). For example, Shaw and Agahi (Citation2012) found that the harmful effects of physical inactivity were not evident among smokers.
Although several studies have involved the combined consideration of multiple health behaviours, most researchers have used an additive approach (Barboza Solís et al., Citation2016; Harrington et al., Citation2010; Zaninotto et al., Citation2020). Typically, an additive index is employed, with one point added for unhealthy behaviour in each of the dimensions considered. Implicit assumptions underlying this approach are (1) that every type of (un)healthy behaviour has a similar effect on the outcome considered, and (2) that the health implications of (un)healthy behaviours are independent of each other. Consequently, potential synergistic or overshadowing effects cannot be detected. Hence, an approach that considers particular patterns or clusters of health behaviours is called for.
In a few studies, associations of patterns or clusters of multiple health behaviours with depression and mental health have been examined. For example, Oftedal et al. (2019) used latent class analysis to identify patterns of multiple health behaviours and found that people with high-risk behaviours in all aspects had the greatest odds of experiencing mental distress. However, studies of this type (cf. Verger et al., Citation2009; Ye et al., Citation2016) have provided only snapshots of such associations, because of their cross-sectional designs. Not only the influence of patterns of multiple health behaviours on depressive symptoms, but also the longitudinal effects of these patterns, need to be examined concurrently, because some behaviours show no observable health benefit unless they are maintained for certain periods of time (Conner, Citation2008; Jacka & Berk, Citation2013).
The identification of particular longitudinal combinations of health behaviours that have detrimental effects on depressive symptoms is of practical relevance. For example, insights in particular risky behaviour combinations can aid policymakers and health practitioners in developing optimal health promotion strategies. We focus on smoking, physical activity, and social participation, because these aspects of health behaviour are known to be associated separately with depressive symptoms (Bishwajit et al., Citation2017; Stubbs et al., Citation2018), but little is known about whether their longitudinal combinations are associated with depressive symptom trajectories. As older adults’ inability to stay socially active and connected to others puts them at greater risk of experiencing depressive symptomatology over time (Du et al., Citation2022), we incorporate social participation as a modifiable health behaviour, in addition to the traditional health behaviours smoking and being physically inactive which are well-known threats to the health of Chinese people (Chen et al., Citation2015; Li, Citation2016). No previous study of health behaviour patterns has, to our best knowledge, considered social participation. This is unfortunate because social participation is arguably an important health behaviour. It increases community engagement and social interaction (Feng et al., Citation2020; Mackenzie & Abdulrazaq, Citation2021), which is, in turn, protective against depressive symptoms in older adults (Chiao et al., Citation2011; Sibalija et al., Citation2020).
Older persons rate social relationships among the most important determinants of successful ageing (von Faber et al., Citation2001). Although to our best knowledge no research on what older adults in China find important aspects of successful ageing has been conducted, recent studies on the Chinese diaspora suggest that social participation is typically seen as a key component of a good later life (Hui Chian Teh et al., Citation2020; Zhang et al., Citation2018). It may therefore be expected that cognitive dissonance as a result of missing out on the social participation deemed indispensable may be so detrimental for mental health that it overshadows the mental health risks of the other health behaviours (cf. Shaw & Agahi, Citation2014). Such overshadowing effects only become apparent when studying patterns of multiple health behaviours in conjunction, as we do in the current study. The aims of the current study are to identify longitudinal patterns of multiple health behaviours using latent class growth analysis (LCGA), and to assess associations of such patterns with depressive symptoms in a population-based sample of people aged ≥50 years in China.
Methods
Data source and sample
Data used are from the China Health and Retirement Longitudinal Study (CHARLS), a population-based survey of non-institutionalized middle-aged and older individuals in China (Phillips et al., Citation2021; Zhao et al., Citation2014). The baseline (Wave 1) survey was collected between May 2011 and March 2012 with 17,708 participants, and follow-up surveys were collected in 2013 (Wave 2) and 2015 (Wave 4). Trained interviewers conducted face-to-face interviews. The CHARLS sampling strategy has been described in detail elsewhere (Zhao et al., Citation2014). In this study, we analyzed CHARLS data from Waves 1, 2, and 4. Given that Wave 3 was a special life-history survey that did not include the collection of data on health behaviour or mental health variables, Wave 3 data were not included in our analysis.
Ethics statement
The CHARLS team obtained ethical approval for the research from the Ethical Review Committee of Peking University. All participants provided written informed consent (Zhao et al., Citation2013).
Analytical sample
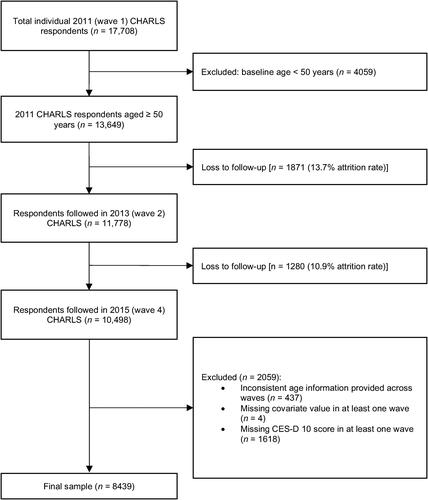
Respondents were excluded from the present analysis for the following reasons: age <50 years at baseline; inconsistent age information across waves (e.g. younger reported age than in a previous wave); missing value for any covariate of interest in at least one wave; or missing 10-item Centre for Epidemiologic Studies Depression Scale (CES-D-10) score in at least one wave. We applied the age threshold of 50 years to focus on middle-aged and older adults, based on previous studies (Pan et al., Citation2008; Shaw & Agahi, Citation2012) and in accordance with the World Health Organization’s Study on Global Ageing and Adult Health (Kowal et al., Citation2012). The final analytical sample comprised 25,317 observations from 8439 respondents. The procedure used for sample selection is summarized in .
Figure 1. Flow chart of sample selection.
Measures
As we adopt an LCGA approach in pursuit of our research aims, three types of measures are distinguished: manifest items, the distal outcome, and covariates. Manifest items are observed health behaviour variables based on which the underlying latent health behaviour trajectories can be identified. The distal outcome is a measure of depressive symptomatology that will be regressed on the latent health behaviour trajectories, whereby we will adjust for a range of covariates.
Manifest items
Smoking, physical activity, and social participation served as manifest items in the LCGA. Smoking status was measured with a dichotomous variable distinguishing between current smokers and non-smokers.
With regard to physical activity, respondents were asked whether they performed vigorous physical activity (VPA) or moderate physical activity (MPA) for at least 10 min every week (‘yes’ or ‘no’). ‘Yes’ responses prompted the interviewers to ask respondents on how many days they performed at least 10 min of VPA and MPA in a usual week (0–7). VPA was defined to include activities that made respondents breathe much harder than normal, such as heavy lifting and cycling with a heavy load. MPA was defined to include activities that made respondents breathe somewhat harder than normal, such as bicycling at regular pace or mopping the floor. Consistent with earlier work (Li et al., Citation2020), we dichotomized the physical activity variable by classifying respondents as physically active (MPA/VPA on ≥2 days/week) and physically inactive (MPA/VPA on <2 days/week).
The social participation variable was operationalized by asking participants whether they had done any of the following social activities in the month prior to the interview: interacted with (a) friend(s); played ma-jong, chess, or cards or gone to a community club; gone to a sporting event or participated in a social group or other type of club; engaged in the activities of a community-related organization; conducted volunteer or charity work; attended an educational or training course. A dichotomous variable for social participation was derived by coding respondents who did not participate in any listed social groups or activities as 0 and respondents who participated in at least one of the listed social activities in the past month as 1.
Distal outcome
Depressive symptoms were measured with the 10-item version of the Center for Epidemiologic Studies Depression Scale (CES-D-10) (Andresen et al., Citation1994; Radloff, Citation1977). The respondents were asked how often they had experienced each of the following in the past week: (1) ‘I was bothered by things that do not usually bother me’, (2) ‘I had trouble keeping my mind on what I was doing’, (3) ‘I felt depressed’, (4) ‘I felt hopeful about the future’, (5) ‘I felt everything I did was an effort’, (6) ‘I felt fearful’, (7) ‘My sleep was restless’, (8) ‘I was happy’, (9) ‘I felt lonely’, and (10) ‘I could not get “going”’. Item responses were provided on a four-point scale ranging from 0 (‘rarely or none of the time’) to 3 (‘most or all of the time’). Responses to the positively worded items 4 and 8 were reverse coded before analysis. Total CES-D-10 scores range from 0 to 30, with higher scores indicating higher levels of depressive symptoms. The CES-D-10 has demonstrated sufficient reliability and validity among community-dwelling older adults in China (Chen & Mui, Citation2014), and showed good internal consistency for all three CHARLS waves in this study (Cronbach’s α: 0.777–0.807).
Covariates
Wave of data collection was used as our indicator of time. Wave numbers were deducted with one, so that the intercepts in the estimated models of depressive symptoms can be interpreted more intuitively. Given their known associations with health behaviours (Feng et al., Citation2021; Grundy & Read, Citation2015; Margolis, Citation2013; Van den Broek, Citation2021a; Van den Broek & Fleischmann, Citation2021) as well as with mental health (Chen et al., Citation2017; Feng et al., Citation2019; Grundy et al., Citation2019; Read et al., Citation2016; Van den Broek, Citation2021b; Zhai et al., Citation2015), age, gender, level of urbanization of location of residence, level of education, marital status, number of children, and co-residence with a child were moreover considered as potential confounders. Time-invariant covariates were gender (male/female), age at baseline in years (centred on the sample mean), educational attainment (at least upper secondary education/lower secondary education or lower]), level of urbanization of location of residence (urban/rural) and number of living children (0/1/2/3/≥4).Time-varying covariates were co-residence with at least one child (no/yes) and partner status (not partnered [separated, divorced, widowed, or never married]/partnered [currently married or cohabiting]).An overview of sample characteristics is provided in .
Table 1. Sample characteristics; means and percentages.
Statistical analysis
The analysis performed for this study consisted of multiple steps. First, we used LCGA to identify the most representative categories of latent longitudinal trajectories of multiple health behaviours across three waves. We did so, because a vast number of health behaviour combinations can potentially be observed as three health behaviours are considered at three timepoints. LCGA is a data reduction technique suitable for the identification of sub-populations (i.e. unobserved, but distinct groups) that display particular trajectories of health behaviours over time (Hodgekins et al., Citation2015). Secondly, we performed random-effects regression analyses to estimate associations between identified behaviour patterns with depressive symptoms over time. LCGA was performed using Mplus version 8.3 and all other analyses were performed in Stata 17.0.
Estimation of latent longitudinal health behaviour patterns
The main goal of LCGA is to explain individual variability in growth parameters (Berlin et al., Citation2014). LCGA is part of a family of measurement models called mixture models. These models assume that a population contains a mixture of different groups of individuals that display different behaviour patterns. Probability methods allow to identify the number of groups or classes that adequately explains heterogeneity in observed behaviours, and assignment of individuals to one or another of these classes. Individuals are assumed to belong to only one class, and the classes are exhaustive (i.e. all individuals are in one class or another).
In this study, we modelled the trajectories of the three behaviours of interest (physical activity, smoking, and social participation) simultaneously within classes. The expectation-maximization algorithm (EM) used in LGCA can deal with missing information on manifest items under the missing at random (MAR) assumption (Dempster et al., Citation1977). This means that it is assumed that any differences between the distributions of missing values and the distributions of observed values can be explained by the other variables included in the model (Bhaskaran & Smeeth, Citation2014).Due to routing errors during the Wave 2 data collection, Wave 2 smoking information was not available for approximately one in four respondents (cf. Phillips et al., Citation2021). Moreover, the physical activity questions were only asked to half of the CHARLS sample in each of the three waves used here (Phillips et al., Citation2021). It should be noted that for each wave of data collection a random selection procedure determined the subsample that was asked the physical activity questions in that particular wave. Hence, the MAR assumption was arguably not violated.
A drawback of the EM algorithm is that it may only produce a local rather than the global maximum of the log likelihood function dependent on the initial parameter values chosen in the first iteration. We therefore used 2000 sets of random starting values to avoid local maxima. The best log-likelihood value was replicated on several final stages of the EM algorithm, which indicates successful convergence (Jung & Wickrama, Citation2008). We began with a two-class solution model, and added classes until we observed no further improvement of the model fit. Identification of the optimal number of classes was guided by the Bayesian information criterion (BIC). BIC is a fit statistic that favours more parsimonious models, as it penalizes model complexity relatively strongly (Dziak et al., Citation2020). We also considered the entropy, a measure of the overall classification accuracy, when deciding on the optimal number of classes (Supplementary Table 1).
Predicting depressive symptoms
In the last step, we estimated longitudinal random-effects models of depressive symptoms. In a first random-effects model, CES-D-10 scores were regressed on the latent health behaviour trajectories, time (measured by wave number) and the aforementioned covariates. Intercepts the slope of time were allowed to vary randomly across individuals. In a second random-effects model, we added cross-level interaction terms that enabled the effects of time to vary as a function of the latent health behaviour profiles. This enabled us to assess whether differences in depressive symptomatology between people with different health behaviour trajectories became larger or smaller over time.
Given that latent class assignment is based on probability, individuals’ affiliation to a class has a degree of uncertainty that must be accounted for when using latent classes as predictors of other variables. After determination of the optimal number of latent classes, we therefore extracted each participant’s posterior probabilities of being in each class. This database was used to create n = 50 imputed datasets where each participant was assigned to one of the latent classes estimated on the basis of the individual’s posterior probability of being in each of these classes. This procedure is dubbed pseudo-random draws, to emphasise that the latent class imputations are bounded by the estimated posterior probabilities of being in one class or another. This is akin to the multiple imputation approach, which uses the posterior distribution of a parameter to generate m sets of parameter estimates. These multiple draws where each participant was reassigned to one latent class can thus be used in further analyses to relate latent classes to other covariates while controlling for latent class uncertainty. This was achieved by combining estimates from the imputed pseudo-random draws using Rubin’s combination rules (Little & Rubin, Citation1989).
Results
Latent longitudinal health behaviour patterns
Models with two to ten latent classes were estimated. A seven-class solution best fit the data (BIC: 63,613.1 vs. 63,620.0 [six-class solution] and 63,620.4 [eight-class solution]); full goodness-of-fit indices are provided in Supplement Table 1). In addition, this model provided a somewhat more definite classification (entropy) compared with models with a greater number of classes. A graphical overview of the seven classes is presented in . The presented class-conditional response probabilities correspond perfectly with the distribution on the various observed health behaviour items for the respective latent classes.
Figure 2. Class-conditional response probabilities on manifest health behaviour items over time.
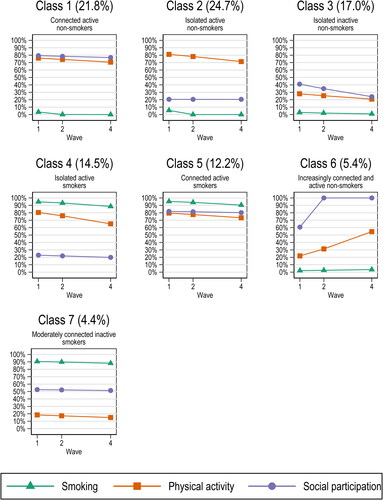
The first class identified can be labelled connected active non-smokers. This class is characterized by very low probabilities of smoking and high probabilities of physical activity and social participation in all three waves. 21.8% of our sample were estimated to be in this class.
The second class was the most prevalent in our sample (average posterior probability: 24.7%).People in this class also had high probabilities of physical activity and low probabilities of smoking in all waves. In contrast to their counterparts in the first class, they had relatively low probabilities of social participation in all waves. This class can therefore be labelled isolated active non-smokers.
The third class (average posterior probability: 17.0%) was also characterized by low probabilities of smoking and social participation in all waves. Given that the probabilities of physical activity were relatively low in all waves as well, we labelled this class isolated inactive non-smokers.
People in the fourth class (average posterior probability: 14.5%) were highly likely to smoke and to be physically active in all waves. Given that their probabilities of social participation were relatively low in all waves, this class can be labelled isolated active smokers.
The fifth class (average posterior probability: 12.2%) was also characterized by high probabilities of smoking in all waves. We labelled this class connected active smokers, because people in this class were highly likely to be both physically and socially active in all waves.
Whereas the health behaviour of people in the classes described thus far tended to be highly stable over time, the smaller sixth class (average posterior probability: 5.4%) was characterized by increases over time in both the probability of physical activity and the probability of social participation. The probabilities of smoking were low in all waves. This class can therefore be labelled increasingly connected and active non-smokers.
The health behaviour of people in the seventh class (average posterior probability: 4.4%) was again characterized by stability over time. In all waves, they were relatively unlikely to be physically active, highly likely to smoke and moderately likely to be socially active. Consequently, we labelled this class moderately connected inactive smokers.
As shown in , there were substantial differences in the background characteristics of people with different health behaviour patterns. Most notably, the share of women greatly exceeded the share of men in groups with health behaviour profiles characterized by high probabilities of smoking, whereas the opposite was the case in health behaviour profile groups with low probabilities of smoking. Also, groups with health behaviour profiles characterized by high probabilities of social participation tended to have relatively high shares of people with at least secondary education.
Table 2. Background characteristics at baseline by health behaviour pattern; means and percentages.
Depressive symptoms
Results of the random effects models predicting depressive symptoms are presented in . The first model, in which the effects of time are constrained to be similar for all health behaviour classes, shows that connected active non-smokers had significantly fewer depressive symptoms than their counterparts in all other health behaviour classes, except the increasingly connected and active non-smokers. Predicted depressive symptoms for people in the latter health behaviour class were also significantly lower than for the isolated active non-smokers (Δb = −1.265, p < .001), isolated inactive non-smokers (Δb = −1.001, p < .01), isolated active smokers (Δb = −1.380, p < .01), connected active smokers (Δb = −0.736, p < .05), and moderately connected inactive smokers (Δb = −1.125, p < .001). Being in the connected active smokers health behaviour class was associated with intermediate levels of predicted depressive symptoms. People in this class had significantly fewer predicted depressive symptoms than their counterparts in the isolated active non-smokers (Δb = −0.529, p < .05) and the isolated active smokers (Δb = −0.644, p < .01) health behaviour classes. Depressive symptoms were highest in the four classes characterized by less than high probabilities of social participation in all waves (isolated active non-smokers; isolated inactive non-smokers; isolated active smokers; moderately connected inactive smokers), and they did not differ significantly between these four classes.
Table 3. Results of random effects models of depressive symptoms (CES-D-10).
The model also showed that, after adjusting for health behaviour class and the other covariates included, depressive symptomatology significantly weakened over time. Furthermore, male gender, higher age at baseline, having at least upper secondary education and living with a partner were associated with fewer depressive symptoms. Both childlessness and high fertility were associated with raised depressive symptoms, as was living in rural area.
In the second model, we added a range of cross-level interaction terms to assess whether the effects of time varied as a function of the health behaviour classes. None of these interaction terms were statistically significant. The analyses thus did not provide evidence that the differences in depressive symptomatology between people with different health behaviour trajectories became larger or smaller over time.
Discussion
In this study, we aimed to identify longitudinal patterns of multiple health behaviours, and to assess associations of such patterns with depressive symptoms in a population-based sample of people aged ≥50 years in China. We identified seven distinct longitudinal patterns of (un)healthy behaviours. Consistent with earlier work (Saint Onge & Krueger, Citation2017), all but one of the health behaviour patterns identified were discordant, that is, neither uniformly healthy nor uniformly unhealthy. We observed that patterns entailing low probabilities of being socially active were associated with significantly more depressive symptoms, almost regardless of scores on the other health behaviour indicators. This suggests the presence of an overshadowing effect (cf. Shaw & Agahi, Citation2012), that is, the harmful effects of being socially inactive might be so detrimental to depression status that they marginalize the impacts of co-existing health behaviours.
The influence of social relationships on risk for mortality is comparable with a well-established risk factor such as smoking and exceeds the influence of other risk factors such as physical inactivity (Holt-Lunstad et al., Citation2010). Our findings suggest that social participation is also very important for mental health. Our finding that depressive symptoms were highest in all four classes with lower probabilities of social participation across waves highlights the key role the fulfilment of social needs has for human beings to function well and thrive. Plausibly, cognitive dissonance as a result of missing out on the social participation deemed indispensable may be so detrimental for mental health that it overshadows the mental health risks of other health behaviours. The vital role of social participation in the amelioration of depressive symptoms has not been documented as well as those of other health behaviours among older adults from a longitudinal perspective. Thus, our findings contribute to the bridging of this research gap and highlight the potential importance of social participation for the reduction of depressive symptoms among middle-aged and older adults in China. Therefore, helping people to become (or stay) socially active might be a way to decrease depressive symptoms in later life.
Although middle-aged and older adults can benefit from positive health behaviour changes, we observed stability in most of the identified health behaviour patterns over four years. This result is consistent with the finding that health behaviour stability was more common than change in a 25-year study conducted with U.S. adults (Burgard et al., Citation2020). Empirical findings indicate that many behaviours posing health risks are initiated during earlier life stages (Barnett et al., Citation2008; Steptoe et al., Citation2002), and that healthy and unhealthy behaviours stabilize in adolescence and adulthood (Burgard et al., Citation2020; Daw et al., Citation2017; Wiium et al., Citation2015). Thus, we suggest that health behaviour interventions among adolescents and young adults are needed before unhealthy behaviours become stabilized.
Limitations
Limitations of the study are respondents’ self-reporting for all health behaviour variables, which may have introduced bias. Researchers have, for instance, reported suboptimal retest validity for self-reported physical activity measures (Dal Grande et al., Citation2012). Given that suboptimal health behaviour, e.g. smoking, tends to be stigmatized (Goldstein, Citation1991), respondents may moreover provide socially desirable answers to questions regarding health behaviours. Nevertheless, research has shown that self-reports of smoking behaviour are accurate in most studies (Patrick et al., Citation1994).
Secondly, although the total sample size was substantial, the rather low prevalence of two of the estimated latent health behaviour patterns (increasingly connected and active non-smokers and moderately connected inactive smokers) resulted in limited statistical power for estimating the effects of these particular health behaviour patterns on (changes in) depressive symptoms. Specifically, the presumed beneficial influence of social participation on mental health would lead one to expect relatively favourable trajectories of change in depressive symptoms for increasingly connected and active non-smokers, but we did not find statistically significant evidence for change over time in depressive symptomatology gaps between these people and their counterparts with different health behaviour trajectories. As this may be related to the current study’s limited statistical power to detect such effects, future studies with even larger samples are called for to generate more precise estimates of the mental health impact of change in social participation in conjunction with other health behaviours.
Thirdly, the high level of stability over time noted among both health behaviour patterns and depressive symptomatology call for caution when interpreting the estimated impact of the health behaviour patterns on depressive symptoms. Prior to reaching midlife or old age, people may turn to suboptimal health behaviour, e.g. smoking, as a way of coping with stress (McEwen, Citation1998), and it is thus not unplausible that depressive symptomatology may, to some extent, predispose persons to particular suboptimal health behaviour patterns. Analyses of long-running birth cohort data with frequently repeated measures of both health behaviour and depressive symptomatology are needed to gain better insights into the ways in which health behaviour patterns and depressive symptoms mutually shape each other. Unfortunately, such data are not yet available for the Chinese context.
Conclusions
Our empirical findings indicate that health behaviour patterns characterized by consistently low probabilities of social participation are associated with more depressive symptoms among middle-aged and older adults in China. This suggests that the impact of social inactivity may overshadow the effects of other (un)healthy behaviours. In addition, the stability of the patterns of multiple health behaviours over time suggests that behavioural interventions are needed earlier in life. These findings should be considered when developing health promotion strategies that aim to reduce depressive symptoms among middle-aged and older adults in China.
| Abbreviations | ||
| BIC | = | Bayesian information criterion |
| CES-D-1010-item | = | Centre for Epidemiologic Studies Depression Scale |
| CHARLS | = | China Health and Retirement Longitudinal Study |
| EM | = | expectation-maximization |
| LCGA | = | latent class growth analysis |
| MAR | = | missing at random |
| MPA | = | moderate physical activity |
| VPA | = | vigorous physical activity |
Supplemental Material
Download MS Word (17.3 KB)Disclosure statement
No potential conflict of interest was reported by the author(s).
Additional information
Funding
References
- Andresen, E. M., Malmgren, J. A., Carter, W. B., & Patrick, D. L. (1994). Screening for depression in well older adults: Evaluation of a short form of the CES-D. American Journal of Preventive Medicine, 10(2), 77–84. https://doi.org/10.1016/S0749-3797(18)30622-6
- Barboza Solís, C., Fantin, R., Castagné, R., Lang, T., Delpierre, C., & Kelly-Irving, M. (2016). Mediating pathways between parental socio-economic position and allostatic load in mid-life: Findings from the 1958 British birth cohort. Social Science & Medicine, 165, 19–27. https://doi.org/10.1016/j.socscimed.2016.07.031
- Barnett, T. A., Gauvin, L., Craig, C. L., & Katzmarzyk, P. T. (2008). Distinct trajectories of leisure time physical activity and predictors of trajectory class membership: A 22 year cohort study. The International Journal of Behavioral Nutrition and Physical Activity, 5(1), 57. https://doi.org/10.1186/1479-5868-5-57
- Berlin, K. S., Parra, G. R., & Williams, N. A. (2014). An introduction to latent variable mixture modeling (Part 2): Longitudinal latent class growth analysis and growth mixture models. Journal of Pediatric Psychology, 39(2), 188–203. https://doi.org/10.1093/jpepsy/jst085
- Bhaskaran, K., & Smeeth, L. (2014). What is the difference between missing completely at random and missing at random? International Journal of Epidemiology, 43(4), 1336–1339. https://doi.org/10.1093/ije/dyu080
- Bishwajit, G., O’Leary, D. P., Ghosh, S., Yaya, S., Shangfeng, T., & Feng, Z. (2017). Physical inactivity and self-reported depression among middle- and older-aged population in South Asia: World health survey. BMC Geriatrics, 17(1), 100. https://doi.org/10.1186/s12877-017-0489-1
- Burgard, S. A., Lin, K. Y. P., Segal, B. D., Elliott, M. R., & Seelye, S. (2020). Stability and change in health behavior profiles of U.S. adults. The Journals of Gerontology Series B: Psychological Sciences and Social Sciences, 75(3), 674–683. https://doi.org/10.1093/geronb/gby088
- Chen, H., & Mui, A. C. (2014). Factorial validity of the Center for Epidemiologic Studies Depression Scale short form in older population in China. International Psychogeriatrics, 26(1), 49–57. https://doi.org/10.1017/S1041610213001701
- Chen, Y., Bennett, D., Clarke, R., Guo, Y., Yu, C., Bian, Z., Ma, L., Huang, Y., Sun, Q., Zhang, N., Zheng, X., Chen, J., Peto, R., Kendler, K. S., Li, L., & Chen, Z. (2017). Patterns and correlates of major depression in Chinese adults: A cross-sectional study of 0.5 million men and women. Psychological Medicine, 47(5), 958–970. https://doi.org/10.1017/S0033291716002889
- Chen, Z., Peto, R., Zhou, M., Iona, A., Smith, M., Yang, L., Guo, Y., Chen, Y., Bian, Z., Lancaster, G., Sherliker, P., Pang, S., Wang, H., Su, H., Wu, M., Wu, X., Chen, J., Collins, R., & Li, L. (2015). Contrasting male and female trends in tobacco-attributed mortality in China: Evidence from successive nationwide prospective cohort studies. The Lancet, 386(10002), 1447–1456. https://doi.org/10.1016/S0140-6736(15)00340-2
- Chiao, C., Weng, L.-J., & Botticello, A. L. (2011). Social participation reduces depressive symptoms among older adults: An 18-year longitudinal analysis in Taiwan. BMC Public Health, 11(1), 292. 292. https://doi.org/10.1186/1471-2458-11-292
- Conner, M. (2008). Initiation and maintenance of health behaviors. Applied Psychology, 57(1), 42–50. https://doi.org/10.1111/j.1464-0597.2007.00321.x
- Conry, M. C., Morgan, K., Curry, P., McGee, H., Harrington, J., Ward, M., & Shelley, E. (2011). The clustering of health behaviours in Ireland and their relationship with mental health, self-rated health and quality of life. BMC Public Health, 11(1), 692. https://doi.org/10.1186/1471-2458-11-692
- Dal Grande, E., Fullerton, S., & Taylor, A. W. (2012). Reliability of self-reported health risk factors and chronic conditions questions collected using the telephone in South Australia, Australia. BMC Medical Research Methodology, 12(1), 108. 108. https://doi.org/10.1186/1471-2288-12-108
- Daw, J., Margolis, R., & Wright, L. (2017). Emerging adulthood, emergent health lifestyles: Sociodemographic determinants of trajectories of smoking, binge drinking, obesity, and sedentary behavior. Journal of Health and Social Behavior, 58(2), 181–197. https://doi.org/10.1177/0022146517702421
- Dempster, A. P., Laird, N. M., & Rubin, D. B. (1977). Maximum likelihood from incomplete data via the EM algorithm. Journal of the Royal Statistical Society Series B: Methodological, 39(1), 1–38. https://doi.org/10.2307/2984875
- deRuiter, W. K., Cairney, J., Leatherdale, S. T., & Faulkner, G. E. J. (2014). A longitudinal examination of the interrelationship of multiple health behaviors. American Journal of Preventive Medicine, 47(3), 283–289. https://doi.org/10.1016/j.amepre.2014.04.019
- Du, M., Dai, W., Liu, J., & Tao, J. (2022). Less social participation is associated with a higher risk of depressive symptoms among Chinese older adults: A community-based longitudinal prospective cohort study. Frontiers in Public Health, 10, 781771. https://doi.org/10.3389/fpubh.2022.781771
- Dziak, J. J., Coffman, D. L., Lanza, S. T., Li, R., & Jermiin, L. S. (2020). Sensitivity and specificity of information criteria. Briefings in Bioinformatics, 21(2), 553–565. https://doi.org/10.1093/bib/bbz016
- Feng, Z., Cramm, J. M., & Nieboer, A. P. (2019). A healthy diet and physical activity are important to promote healthy ageing among older Chinese people. The Journal of International Medical Research, 47(12), 6061–6081. https://doi.org/10.1177/0300060519882590
- Feng, Z., Cramm, J. M., & Nieboer, A. P. (2020). Social participation is an important health behaviour for health and quality of life among chronically ill older Chinese people. BMC Geriatrics, 20(1), 299. https://doi.org/10.1186/s12877-020-01713-6
- Feng, Z., Cramm, J. M., & Nieboer, A. P. (2021). Associations of social cohesion and socioeconomic status with health behaviours among middle-aged and older Chinese people. International Journal of Environmental Research and Public Health, 18(9), 4894. https://doi.org/10.3390/ijerph18094894
- Fine, L. J., Philogene, G. S., Gramling, R., Coups, E. J., & Sinha, S. (2004). Prevalence of multiple chronic disease risk factors: 2001 National Health Interview Survey. American Journal of Preventive Medicine, 27(2 Suppl), 18–24. https://doi.org/10.1016/j.amepre.2004.04.017
- Goldstein, J. (1991). The stigmatization of smokers: An empirical investigation. Journal of Drug Education, 21(2), 167–182. https://doi.org/10.2190/Y71P-KXVJ-LR9H-H1MG
- Grundy, E., & Read, S. (2015). Pathways from fertility history to later life health: Results from analyses of the English Longitudinal Study of Ageing. Demographic Research, 32(1), 107–146. https://doi.org/10.4054/DemRes.2015.32.4
- Grundy, E., Van den Broek, T., & Keenan, K. (2019). Number of children, partnership status, and later-life depression in Eastern and Western Europe. The Journals of Gerontology Series B: Psychological Sciences and Social Sciences, 74(2), 353–363. https://doi.org/10.1093/geronb/gbx050
- Harrington, J., Perry, I. J., Lutomski, J., Fitzgerald, A. P., Shiely, F., McGee, H., Barry, M. M., Van Lente, E., Morgan, K., & Shelley, E. (2010). Living longer and feeling better: Healthy lifestyle, self-rated health, obesity and depression in Ireland. European Journal of Public Health, 20(1), 91–95. https://doi.org/10.1093/eurpub/ckp102
- Hodgekins, J., Birchwood, M., Christopher, R., Marshall, M., Coker, S., Everard, L., Lester, H., Jones, P., Amos, T., Singh, S., Sharma, V., Freemantle, N., & Fowler, D. (2015). Investigating trajectories of social recovery in individuals with first-episode psychosis: A latent class growth analysis. The British Journal of Psychiatry, 207(6), 536–543. https://doi.org/10.1192/bjp.bp.114.153486
- Holt-Lunstad, J., Smith, T. B., & Layton, J. B. (2010). Social relationships and mortality risk: A meta-analytic review. PLoS Medicine, 7(7), e1000316. https://doi.org/10.1371/journal.pmed.1000316
- Hui Chian Teh, J., Brown, L. J. E., & Bryant, C. (2020). Perspectives on successful ageing: The views of Chinese older adults living in Australia on what it means to age well. Australasian Journal on Ageing, 39(1), e24–e31. https://doi.org/10.1111/ajag.12677
- Jacka, F. N., & Berk, M. (2013). Depression, diet and exercise. The Medical Journal of Australia, 199(S6), S21–S23. https://doi.org/10.5694/mja12.10508
- Johnson, S. K., Von Sternberg, K., & Velasquez, M. M. (2018). Changing multiple health risk behaviors in CHOICES. Preventive Medicine Reports, 11, 69–73. https://doi.org/10.1016/j.pmedr.2018.05.006
- Jung, T., & Wickrama, K. A. S. (2008). An introduction to latent class growth analysis and growth mixture modeling. Social and Personality Psychology Compass, 2(1), 302–317. https://doi.org/10.1111/j.1751-9004.2007.00054.x
- Kendler, K. S., Aggen, S. H., Li, Y., Lewis, C. M., Breen, G., Boomsma, D. I., Bot, M., Penninx, B. W. J. H., & Flint, J. (2015). The similarity of the structure of DSM-IV criteria for major depression in depressed women from China, the United States and Europe. Psychological Medicine, 45(9), 1945–1954. https://doi.org/10.1017/S0033291714003067
- Kowal, P., Chatterji, S., Naidoo, N., Biritwum, R., Fan, W., Lopez Ridaura, R., Maximova, T., Arokiasamy, P., Phaswana-Mafuya, N., Williams, S., Snodgrass, J. J., Minicuci, N., D’Este, C., Peltzer, K., Boerma, J. T., & SAGE Collaborators. (2012). Data resource profile: The World Health Organization Study on global AGEing and adult health (SAGE). International Journal of Epidemiology, 41(6), 1639–1649. https://doi.org/10.1093/ije/dys210
- Lei, X., Sun, X., Strauss, J., Zhang, P., & Zhao, Y. (2014). Depressive symptoms and SES among the mid-aged and elderly in China: Evidence from the China Health and Retirement Longitudinal Study national baseline. Social Science & Medicine, 120, 224–232. https://doi.org/10.1016/j.socscimed.2014.09.028
- Li, F. (2016). Physical activity and health in the presence of China’s economic growth: Meeting the public health challenges of the aging population. Journal of Sport and Health Science, 5(3), 258–269. https://doi.org/10.1016/j.jshs.2016.06.004
- Li, J., Pang, H., Sun, Z., Zhao, L., & Bai, C. (2020). Health status of middle-aged and older cancer survivors: A nationwide cross-sectional study from the China Health and Retirement Longitudinal Study (CHARLS). Annals of Translational Medicine, 8(5), 183–183. https://doi.org/10.21037/atm.2020.01.105
- Little, R. J. A., & Rubin, D. B. (1989). The analysis of social science data with missing values. Sociological Methods & Research, 18(2-3), 292–326. https://doi.org/10.1177/0049124189018002004
- Mackenzie, C. S., & Abdulrazaq, S. (2021). Social engagement mediates the relationship between participation in social activities and psychological distress among older adults. Aging & Mental Health, 25(2), 299–305. https://doi.org/10.1080/13607863.2019.1697200
- Margolis, R. (2013). Educational differences in healthy behavior changes and adherence among middle-aged Americans. Journal of Health and Social Behavior, 54(3), 353–368. https://doi.org/10.1177/0022146513489312
- McEwen, B. S. (1998). Stress, adaptation, and disease: Allostasis and allostatic load. Annals of the New York Academy of Sciences, 840(1), 33–44. https://doi.org/10.1111/j.1749-6632.1998.tb09546.x
- Oftedal, S., Vandelanotte, C., & Duncan, M. J. (2019). Patterns of diet, physical activity, sitting and sleep are associated with socio-demographic, behavioural, and health-risk indicators in adults. International Journal of Environmental Research and Public Health, 16(13), 2375. https://doi.org/10.3390/ijerph16132375
- Pan, A., Franco, O. H., Wang, Y., Yu, Z., Ye, X., & Lin, X. (2008). Prevalence and geographic disparity of depressive symptoms among middle-aged and elderly in China. Journal of Affective Disorders, 105(1–3), 167–175. https://doi.org/10.1016/j.jad.2007.05.003
- Patrick, D. L., Cheadle, A., Thompson, D. C., Diehr, P., Koepsell, T., & Kinne, S. (1994). The validity of self-reported smoking: A review and meta-analysis. American Journal of Public Health, 84(7), 1086–1093. https://doi.org/10.2105/ajph.84.7.1086
- Phillips, D., Green, H., Petrosyan, S., Shao, K., Wilkens, J., Lee, J. (2021). Harmonized CHARLS documentation, version D (2011–2018). http://charls.pku.edu.cn/Public/ashelf/public/uploads/document/harmonized_charls/application/Harmonized_CHARLS_D.pdf
- Phillips, M. R., Zhang, J., Shi, Q., Song, Z., Ding, Z., Pang, S., Li, X., Zhang, Y., & Wang, Z. (2009). Prevalence, treatment, and associated disability of mental disorders in four provinces in China during 2001–05: An epidemiological survey. The Lancet, 373(9680), 2041–2053. https://doi.org/10.1016/S0140-6736(09)60660-7
- Poortinga, W. (2007). The prevalence and clustering of four major lifestyle risk factors in an English adult population. Preventive Medicine, 44(2), 124–128. https://doi.org/10.1016/j.ypmed.2006.10.006
- Prochaska, J. O. (2008). Multiple health behavior research represents the future of preventive medicine. Preventive Medicine, 46(3), 281–285. https://doi.org/10.1016/j.ypmed.2008.01.015
- Radloff, L. S. (1977). The CES-D scale: A self-report depression scale for research in the general population. Applied Psychological Measurement, 1(3), 385–401. https://doi.org/10.1177/014662167700100306
- Read, S., Grundy, E., & Foverskov, E. (2016). Socio-economic position and subjective health and well-being among older people in Europe: A systematic narrative review. Aging & Mental Health, 20(5), 529–542. https://doi.org/10.1080/13607863.2015.1023766
- Saint Onge, J. M., & Krueger, P. M. (2017). Health lifestyle behaviors among U.S. adults. SSM - Population Health, 3, 89–98. https://doi.org/10.1016/j.ssmph.2016.12.009
- Shaw, B. A., & Agahi, N. (2012). A prospective cohort study of health behavior profiles after age 50 and mortality risk. BMC Public Health, 12(1), 803. https://doi.org/10.1186/1471-2458-12-803
- Shaw, B. A., & Agahi, N. (2014). Smoking and physical inactivity patterns during midlife as predictors of all-cause mortality and disability: A 39-year prospective study. European Journal of Ageing, 11(3), 195–204. https://doi.org/10.1007/s10433-013-0298-0
- Sibalija, J., Savundranayagam, M. Y., Orange, J. B., & Kloseck, M. (2020). Social support, social participation, and depression among caregivers and non-caregivers in Canada: A population health perspective. Aging & Mental Health, 24(5), 765–773. https://doi.org/10.1080/13607863.2018.1544223
- Steptoe, A., Wardle, J., Cui, W., Bellisle, F., Zotti, A.-M., Baranyai, R., & Sanderman, R. (2002). Trends in smoking, diet, physical exercise, and attitudes toward health in European university students from 13 countries, 1990–2000. Preventive Medicine, 35(2), 97–104. https://doi.org/10.1006/pmed.2002.1048
- Stubbs, B., Vancampfort, D., Firth, J., Solmi, M., Siddiqi, N., Smith, L., Carvalho, A. F., & Koyanagi, A. (2018). Association between depression and smoking: A global perspective from 48 low- and middle-income countries. Journal of Psychiatric Research, 103, 142–149. https://doi.org/10.1016/j.jpsychires.2018.05.018
- Van den Broek, T. (2021a). Early-life circumstances, health behavior profiles, and later-life health in Great Britain. Journal of Aging and Health, 33(5–6), 317–330. https://doi.org/10.1177/0898264320981233
- Van den Broek, T. (2021b). Is having more children beneficial for mothers’ mental health in later life? Causal evidence from the national health and aging trends study. Aging & Mental Health, 25(10), 1950–1958. https://doi.org/10.1080/13607863.2020.1774739
- Van den Broek, T., & Fleischmann, M. (2021). The causal effect of number of children on later-life overweight and obesity in parous women. An instrumental variable study. Preventive Medicine Reports, 24, 101528. https://doi.org/10.1016/j.pmedr.2021.101528
- Verger, P., Lions, C., & Ventelou, B. (2009). Is depression associated with health risk-related behaviour clusters in adults? European Journal of Public Health, 19(6), 618–624. https://doi.org/10.1093/eurpub/ckp057
- von Faber, M., Bootsma-van der Wiel, A., van Exel, E., Gussekloo, J., Lagaay, A. M., van Dongen, E., Knook, D. L., van der Geest, S., & Westendorp, R. G. (2001). Successful aging in the oldest old: Who can be characterized as successfully aged? Archives of Internal Medicine, 161(22), 2694–2700. https://doi.org/10.1001/archinte.161.22.2694
- Wiium, N., Breivik, K., & Wold, B. (2015). Growth trajectories of health behaviors from adolescence through young adulthood. International Journal of Environmental Research and Public Health, 12(11), 13711–13729. https://doi.org/10.3390/ijerph121113711
- World Health Organization. (2021). Factsheet depression. Retrieved November 27, 2021, from https://www.who.int/news-room/fact-sheets/detail/depression
- Ye, Y., Wang, P., Qu, G., Yuan, S., Phongsavan, P., & He, Q. (2016). Associations between multiple health risk behaviors and mental health among Chinese college students. Psychology, Health & Medicine, 21(3), 377–385. https://doi.org/10.1080/13548506.2015.1070955
- Zaninotto, P., Head, J., & Steptoe, A. (2020). Behavioural risk factors and healthy life expectancy: Evidence from two longitudinal studies of ageing in England and the US. Scientific Reports, 10(1), 6955. https://doi.org/10.1038/s41598-020-63843-6
- Zhai, Y., Yi, H., Shen, W., Xiao, Y., Fan, H., He, F., Li, F., Wang, X., Shang, X., & Lin, J. (2015). Association of empty nest with depressive symptom in a Chinese elderly population: A cross-sectional study. Journal of Affective Disorders, 187, 218–223. https://doi.org/10.1016/j.jad.2015.08.031
- Zhang, W., Liu, S., & Wu, B. (2018). Defining successful aging: Perceptions from elderly Chinese in Hawai’i. Gerontology & Geriatric Medicine, 4, 2333721418778182. https://doi.org/10.1177/2333721418778182
- Zhao, Y., Hu, Y., Smith, J. P., Strauss, J., & Yang, G. (2014). Cohort profile: The China Health and Retirement Longitudinal Study (CHARLS). International Journal of Epidemiology, 43(1), 61–68. https://doi.org/10.1093/ije/dys203
- Zhao, Y., Strauss, J., Yang, G., Giles, J., Hu, P., Hu, Y., Lei, X., Liu, M., Park, A., Smith, J. P., & Wang, Y. (2013). China Health and Retirement Longitudinal Study: 2011–2012 national baseline users’ guide. Retrieved from http://charls.pku.edu.cn/Public/ashelf/public/uploads/document/2011-charls-wave1/application/CHARLS_nationalbaseline_users_guide.pdf