
ABSTRACT
The effects of single and double pulse resistance spot welding on the microstructures of an advanced high strength automotive steel are presented in this work. The double pulse welding schemes partially remelt the primary weld nugget and anneal the area at the fusion boundary of the nugget. The effects of the annealing treatment on the segregation and the microstructure have been studied by electron probe microanalysis (EPMA) in combination with electron backscatter diffraction (EBSD). Results show that phosphorus has been redistributed at the primary weld nugget edge of the double pulse welds, while the mean block width and ellipticity of the prior austenite grains were smaller in welds subjected to double pulsing compared with single pulse weld. A favourable failure mode was obtained for the double pulse welds although behaviour did not correlate with the measured grain size.
Introduction
The continued development of Advanced High Strength Steels (AHSSs) to combine high strength and formability with excellent crashworthiness behaviour for automotive vehicles requires the investigation of weldability. The favourable properties of AHSSs are obtained by appropriate design of the alloys to provide multi-phase microstructures.
The main method used to join sheet metals in the automotive industry is resistance spot welding (RSW), which is characterised by the low costs, high reliability, high operating speeds and suitability for automation [Citation1,Citation2]. The carefully designed multi-phase microstructures of the parent material are destroyed in and around the weld by the thermal-mechanical cycle imposed during RSW, with the resulting weld microstructures becoming chemically and mechanically heterogeneous. The relatively high alloying content of 3rd generation AHSSs limits their weldability, and unfavourable modes of weld failure are frequently observed [Citation3]. Generally in RSW, there is a critical weld nugget size where the failure changes from interfacial to plug failure mode [Citation4,Citation5]. However, in the newest generation of AHSSs, even the largest weld nugget sizes have the tendency to show failure modes other than the desirable full plug failure when subjected to cross tension strength (CTS) testing. During CTS testing, the crack initiates at the weld edge; the local microstructure of this zone therefore plays an important role in the mechanical performance of the welds [Citation6,Citation7].
The cooling rates in RSW are high, in the order of 2000–4000 Ks−1 and the maximum temperature gradient is perpendicular to the fusion line. The orientations of the solidified grains are in the direction of maximum temperature gradient. During solidification, alloying elements such as manganese, silicon and phosphorous tend to segregate to the grain boundaries [Citation8].
The combined effect of high amounts of alloying elements and the high cooling rates in RSW, result in the formation of a lath martensitic microstructure in the weld nugget zone. The lath martensite has a sub-grain structure including packets, blocks, sub-blocks and laths [Citation9,Citation10]. Different crystallographic lath variants can exist within a single prior austenite grain. Parallel laths with a pair of different variants form blocks, and parallel blocks with a common habit plane form packets. It has been reported that the prior austenite grain size (PAGS) and the variant selection have important effects on the mechanical performance of lath martensite structures [Citation11–16]. A decrease in PAGS reduces the packet and block size of lath martensite and increases the strength of the steel [Citation15]. In summary, the performance of the welds is affected by both the segregation of the alloying elements and formation of the lath martensite substructure.
One of the most efficient means of modifying the microstructure and thus the mechanical properties of resistance spot welds is re-heating of the weld by application of a second current pulse, known as post pulsing [Citation17–23]. Various welding schemes were applied to improve the mechanical properties of the spot welds. However, none of these studies has reported the effects of second current pulse level that partially remelts the weld nugget on both elemental distribution and the microstructure of the AHSS resistance spot welds.
In this paper, an analysis of elemental distribution and microstructural changes on the mechanical properties of the welds due to variation in second current pulse level that partially remelts the weld nugget and re-austenitises the weld edge is reported. The results contribute to better understanding of the metallurgical phenomena in RSW of AHSSs.
Experimental procedure
The material examined was a 3rd generation 1 GPa complex phase AHSS with a thickness of 1.3 mm. The steel was received in a cold-rolled and galvanised condition (surface density of 50 gm−2). Material characteristics and composition are according to the VDA chemistry for 590Y980T-DH in the recently drafted VDA specifications [Citation24], as listed in Table .
Table 1. Material characteristics.
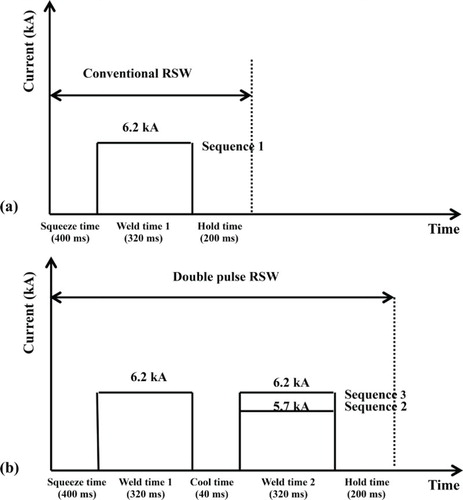
RSW was carried out on a SchlattesTM 50 Hz AC spot welding machine using F1 16 × 5.5 electrodes with a holding force of 4 kN and welding parameters, as described in the VDEh SEP1220-2 standard [Citation25]. The selected welding parameters are based on the weld nugget growth analysis reported elsewhere [Citation7,Citation26] and are indicated schematically in Figure , showing the welding sequences for single pulse and double pulsing. Sequence 1 is a single pulse weld; sequence 2 is a double pulse weld with the second current pulse 8% lower than the first and sequence 3 involves two equal current pulses.
Figure 1. Schematic representation of the (a) conventional and (b) double pulse RSW schemes.
Microstructural characterisations were carried out on the area where failure is initiated during mechanical loading under peel forces; i.e. at the fusion line of the primary weld nugget. For optical microscopy analysis, the sheets were cross-sectioned, polished and etched with Béchet-Beaujard reagent. Quantitative elemental distributions were determined by electron probe microanalysis (EPMA). Analyses were made on 200 × 200 µm2 areas with a step size of 1 µm. Details of the EPMA measurements are discussed in a previous publication [Citation26]. Electron backscatter diffraction (EBSD) measurements by means of a scanning electron microscope equipped with a FEI Quanta 450 field emission gun were conducted, using an accelerating voltage of 20 kV, a spot size of 5 µm and a working distance of 16 mm. All the samples were tilted at 70° to the horizontal axis. The scans were made on a square grid of 200 × 200 µm2 with the step sizes of 0.15 µm. The EBSD data were post processed by means of TSL®- orientation image microscopy (OIM™) data analysis software. Post processing omitted the points with confidence index (CI) lower than 0.1 from the EBSD maps. To reconstruct the prior austenite grain boundaries, APRGE software was used [Citation27]. The block width was estimated by drawing misorientation profile lines along various parallel block batches. Measurements were made along a line perpendicular to the long axis of the blocks and more than 500 blocks were considered to obtain an average block width.
Mechanical properties of the welds were evaluated by standard tensile shear strength (TSS) and CTS [Citation25] tests. The TSS and CTS tests were repeated twice and three times, respectively, for each sequence. The ductility ratio (ratio of the CTS to the TSS) [Citation28] was calculated for each weld. The weld nugget size and plug ratio (ratio of plug size to weld nugget size) were measured for CTS samples with a calliper. Finally, the microstructures of the fractured CTS samples were investigated and related to the crack path.
Results
Microstructural characterisation
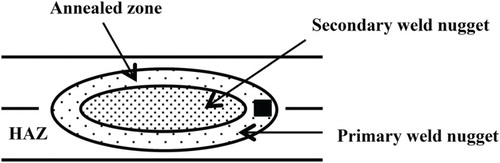
A schematic representation of a cross section for the AHSS subjected to a double pulse welding scheme is shown in Figure . During the first pulse, the primary weld nugget is produced. The second pulse results in a re-melted zone inside the primary weld nugget, forming a secondary weld nugget.
Figure 2. Schematic representation of the (a) primary and secondary weld nugget in the welds subjected to double pulse RSW. The dotted area is the primary weld nugget. The coloured square at the primary weld nugget edge indicates the EBSD and EPMA scanned area.
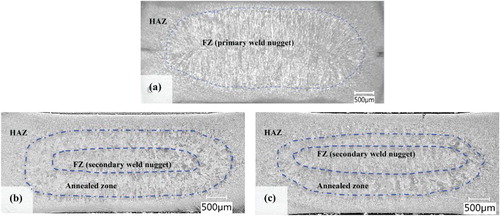
Cross section macrographs of the single and double pulse welds are shown in Figure . As can be seen, the weld nugget of the single pulse weld (sequence 1) contains a typical solidification structure (Figure (a)). The secondary weld nugget diameter increases with an increase in the second current pulse (Figure (b) and (c)). The zone between the primary and secondary weld nuggets is annealed and differs in size and microstructure for different welds according to the second current pulse level (Figure (b) and (c)). The measured primary nugget diameters for sequences 1, 2 and 3 are similar; 5.1 mm, 5.2 mm and 5.2 mm, respectively.
Figure 3. Macrographs of the cross sections of the welds (a) sequence 1, (b) sequence 2 and (c) sequence 3.
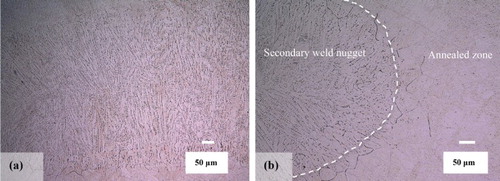
The microstructures of the single and double pulse welds are fully martensitic [Citation7]. The typical microstructures of the secondary weld nugget and the annealed zone of a double pulse weld are shown in Figure . The secondary weld nugget shows a dendritic structure with a typical solidification grain orientation at the weld nugget similar to the single pulse weld (Figure (a)). However, the annealed zone reveals prior austenite grains with an equi-axed grain structure (Figure (b)).
Figure 4. Micrographs of the cross sections of a double pulse weld (sequence 3), (a) secondary weld nugget, (b) annealed zone showing more equi-axed grains.
Elemental distribution
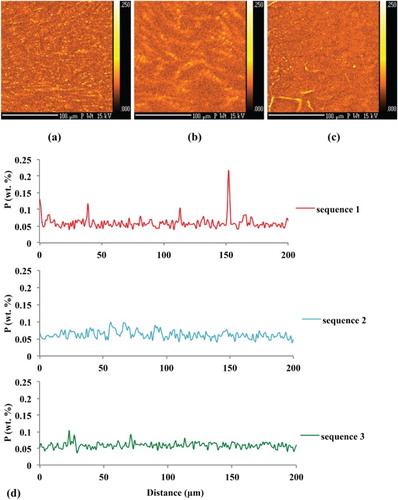
The measured phosphorus distribution at the primary weld nugget edge (indicated by the square area in Figure ) is shown for different welds in Figure . Sequence 1 shows severe segregation matching the dendritic solidification structure. In double pulse welds (sequences 2 and 3), the phosphorus segregation at the weld edge has reduced. The line scans extracted from the EPMA plots are presented in Figure (d). The absolute average phosphorous level in the measured results is 0.060 wt-%, while the parent material analysis indicates 0.012 wt-%. The error is related to lack of EPMA calibration but should not influence the trends observed with respect to the phosphorous level. The average phosphorus composition and standard deviations obtained from the EPMA line scans are 0.060 ± 0.018, 0.062 ± 0.011 and 0.059 ± 0.009 wt-% for sequences 1, 2 and 3, respectively.
Figure 5. Elemental maps of phosphorus taken at the primary weld nugget edge of (a) sequence 1, (b) sequence 2 and (c) sequence 3, (d) line scans taken vertically at approximately 25 µm from the right hand side of the elemental plots.
Martensite substructure and dislocation density
To obtain more detailed information concerning the morphology and crystallographic features of the lath martensite, inverse pole figure colour maps taken from the edge of the primary weld nugget of the welds (Figure ) were acquired by EBSD and are shown in Figure . The prior austenite grains were reconstructed from the lath martensite structure, using the Kurdjumov–Sachs (K–S) orientation relationship, via ARPGE software [Citation27]. The mean PAGSs for sequences 1, 2 and 3 are 24 µm, 15 µm and 22 µm, respectively (Table ).
Figure 6. Colour-coded inverse pole figure maps with indexation at the primary weld nugget edge of the (a) sequence 1, (b) sequence 2 and (c) sequence 3.
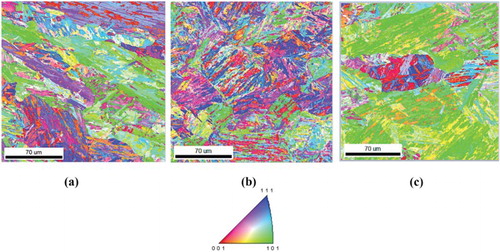
Table 2. Calculated values from EBSD maps for different welds.
In addition, also the ellipticity ((a-b)/a, where a and b are major and minor ellipse radii, respectively) of the prior austenite grains was calculated. The mean ellipticity for the sequences is shown in Table . Sequence 1 shows the lowest circularity of the parent austenite grains and the inverse pole figure map confirms the typical solidification orientation of the grains at the weld edge. The ellipticity of prior austenite grains decreases for the double pulse spot welds and the grains within the annealed zone of the primary weld nugget typically changes to a more equi-axed structure.
Another feature to characterise the microstructure obtained is the block width. The block width determined, assuming the K-S orientation relationship between prior austenite grain and martensite and considering a misorientation of around 50° to 60° is presented in Table . The highest block width is related to sequence 1. In double pulse welds, the block width is reduced.
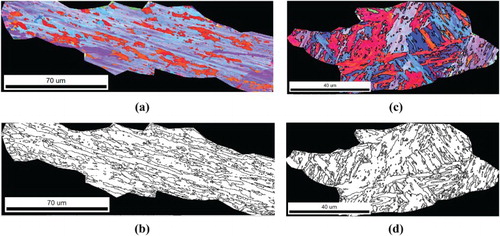
The change in block orientation is evident when double pulsing is applied. In the single pulse weld, the blocks are elongated (Figure (a) and (b)). In double pulse welds, the ellipticity of the prior austenite grains has reduced and the blocks are less elongated (Figure (c) and (d)).
Figure 7. (a) Inverse pole figure map and (b) rotation angles higher than 10 degrees of a typical single PAG taken from the single pulse weld, (c) inverse pole figure map and (d) rotation angles higher than 10 degrees of a typical single PAG taken from the double pulse weld.
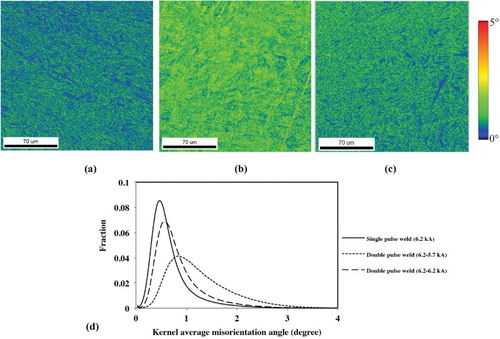
The substructure of lath martensite subjected to high cooling rates, contains high densities of dislocation tangles. Kernel average misorientation (KAM) maps and distribution graphs of the KAM for the three weld sequences are presented in Figure . The average KAM for these sequences is shown in Table . The geometrically necessary dislocation density (ρGND) is related to KAM by Equation (1) [Citation29,Citation30]:
(1)
where,
is the kernel average misorientation angle,
(Burgers vector) is 0.286 nm for BCC phase, u is the step size of the measurement and n is the number of nearest neighbours (considered 2 in this study). The calculated ρGND for the welds are shown in Table . Sequence 1 shows the lowest KAM and subsequently the lowest ρGND, whereas sequence 2 shows the highest KAM and ρGND. The distribution of KAM (Figure (d)) shows that when the average KAM increases, the distribution widens.
Figure 8. KAM maps at the primary weld nugget edge of the (a) sequence 1, (b) sequence 2 and (c) sequence 3 and (d) distribution of KAM of different welds.
The overall EBSD results reveal that sequence 2 shows the smallest average prior austenite grains and block widths as well as the highest average KAM and ρGND and the ellipticity of the double pulse welds has decreased (Table ) at the primary weld nugget edges. The most important change of microstructural features by double pulsing is the more equiaxed prior austenite grains at the weld edge of sequences 2 and 3.
Mechanical properties
The microhardness profiles and mechanical response of the welds are shown in Figure (a) and (b). It is shown that the HAZ of the sequences 2 and 3 are wider than sequence 1, due to the increased heat input. No significant microhardness changes are observed between different sequences, although double pulse welds show a slightly higher hardness in the weld nugget. The microhardness of the annealed zone of the welds is highlighted in Figure (a). The welds have similar primary weld nugget sizes of about 5.1 mm. The CTS test results reveal that the double pulse welds show higher CTS than the single pulse weld. The highest CTS is related to sequence 3. The failure modes of the sequences 1, 2 and 3 subjected to CTS testing are interfacial, partial plug (average plug ratio of 35%) and full plug failure, respectively.
Figure 9. (a) Microhardness profiles (Location of hardness profile is indicated in the inset image) [Citation26] and (b) mechanical response of single and double pulse welds. Red indicates interfacial failure, orange partial plug failure and green full plug failure.
![Figure 9. (a) Microhardness profiles (Location of hardness profile is indicated in the inset image) [Citation26] and (b) mechanical response of single and double pulse welds. Red indicates interfacial failure, orange partial plug failure and green full plug failure.](/cms/asset/e9b05b45-9ddd-432a-8537-223b9e2ff880/ystw_a_1274848_f0009_c.jpg)
The TSS test results show that the double pulse welds also show higher TSS. However, there is no significant difference between the TSS of sequence 2 and 3. Sequence 1 shows a partial plug failure during TSS testing, whereas in sequence 2 and 3, full plug failure was obtained for TSS tests. From the combined CTS and TSS results, the ductility ratio is calculated. Sequence 3 has the highest ductility ratio.
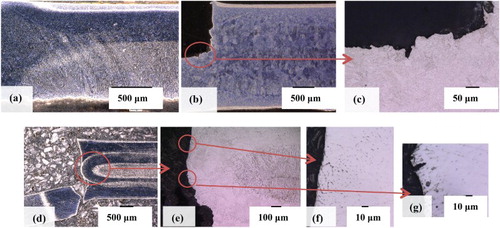
The cross sections of the fractured samples subjected to CTS testing are shown in Figure , indicating that in sequence 1, weld metal failure occurred. In sequence 2, failure occurred in the annealed zone. The higher magnification image (Figure (c)) shows that the crack has propagated particularly along the prior austenite grain boundaries. A cross section of a sequence 3 weld shows that the failure has taken place outside the primary weld nugget (Figure (d) and (e)) and the crack path initially followed the prior austenite grain boundaries and then continued as a ductile shear fracture in the HAZ material, which can be seen in Figure (f) and (g).
Figure 10. Cross sections of the fractured CTS samples, (a) sequence 1, (b) sequence 2, (c) higher magnification of b, (d) sequence 3, (e) higher magnification of d and (f-g) higher magnification of e.
Discussion
The single pulse welds show weld metal failure during CTS testing and the microstructure at the weld edge is dendritic and has a preferred orientation along the maximum thermal gradient at the weld edge. Microstructural changes in welds produced by double pulsing lead to improved mechanical response and failure modes. Simulated welding thermal histories at the primary weld edge of different sequences are shown in Figure . At this location, the calculated temperature during the second pulse is about 1680 K for sequence 2 and around 1760 K for sequence 3. During the second pulse, solid-state phase transformations occur at the primary weld edge and due to the higher second current pulse (heat input) of sequence 3 in comparison with sequence 2, the material in sequence 3 experiences higher temperatures at the primary weld edge (within the annealed zone) (Figure ). During the second pulse in sequence 2, the material at the weld edge is austenitised (resulting in grain refinement). As the peak temperature is relatively low, grain growth of the austenite is limited (average PAGS of 15 µm). In sequence 3, due to the higher peak temperature, larger grains (average PAGS of 22 µm) are observed. The optical microscopy and EBSD results also confirm that the austenitisation transformation (nucleation and grain growth) occurred during the second pulse in sequences 2 and 3. This changes the elongated grains to a more equi-axed shape.
Figure 11. Simulated thermal histories at the primary weld edge of different welds [Citation26].
![Figure 11. Simulated thermal histories at the primary weld edge of different welds [Citation26].](/cms/asset/f9cc585a-0b52-4c70-a08c-39b008492b11/ystw_a_1274848_f0011_c.jpg)
It has been reported that there is a direct relationship between the PAGS and the block width in a lath martensite structure [Citation14]. The results here confirm that the weld with smallest prior austenite grains contains the lowest block width (sequence 2). In case of sequences 1 and 3, the calculated mean PAGS is almost the same and the estimated block width is also comparable.
The increase in KAM and widening of the KAM curves in double pulse welds (Figure ) reflect that the grain size decreases and the ρGND increases. It has been reported that in low carbon lath martensite, the dislocation density increases with prior austenite grain refinement [Citation31]. This observation has been confirmed in the present study. The larger PAGS of sequence 3 in comparison with sequence 2, which is attributed to the higher second current pulse, results in the lower ρGND of lath martensite in this weld. In general, a refined microstructure (i.e. small prior austenite grain and block width) will result in improved mechanical properties [Citation11–16]. This means that the microstructure of sequence 2 should be the most favourable.
The elemental partitioning at the weld edge is also an important factor that determines the mechanical properties during peel type loading of resistance spot welds [Citation6]. In the double pulse welds (sequences 2 and 3), redistribution of phosphorous takes place during the second current pulse. As sequence 3 experiences the highest peak temperature during the second pulsing, the redistribution of phosphorous in this weld is most pronounced, indicated by a low standard deviation. At some prior austenite grain boundaries, phosphorous is segregated and similar boundaries in the HAZ could be the path for crack during the mechanical testing. Although, these prior austenite grain boundaries form a weak part in the HAZ, crack will no longer run through the weld nugget, but via the weld edge, which leads to an improvement of the strength.
During CTS and TSS testing, cracking initiates from the weld edges. The crack path is dictated by the local microstructure and the elemental distribution in this area. In this work, it is shown that double pulsing during RSW affects the lath martensite microstructure and the elemental distribution at the primary weld nugget edge of the welds. The specific temperature cycle of sequence 2 with a relative low peak temperature at the weld edge of the primary weld nugget results in the smallest prior austenite grains and block widths and the highest KAM and ρGND. However, this temperature does not result in complete redistribution of phosphorous. In sequence 3, where a higher current level (i.e. higher temperature) is applied during second pulsing, the phosphorous distribution is improved. However, at the same time somewhat larger PAGSs, block widths and lower KAM and ρGND were found. Grain size and phosphorous distribution are two competing mechanisms in the area of interest. The peak temperature should be limited to avoid excessive grain growth (sequence 2), whereas from the phosphorous distribution point of view, a high temperature is required (sequence 3). The mechanical testing of welds show that sequence 3 has the highest CTS and TSS. It appears that the fracture path always follows prior austenite grain boundaries, where the phosphorous is segregated. Therefore, phosphorous distribution plays the dominant role in the mechanical properties of the welds examined. Future work should be conducted to avoid or minimise phosphorous segregation at the prior austenite grain boundaries.
Conclusions
Based on the results obtained in this study, the following conclusions can be drawn:
The redistribution of the phosphorous as a detrimental alloying element and the improvement of the substructure (i.e. decreasing the block sizes) of the lath martensite at the weld edge of a resistance spot weld with a double pulse welding scheme are the determining factors in the mechanical response of the AHSSs welds.
The elemental distribution of phosphorous at the primary weld nugget edge of the double pulse welds is more uniform. The distribution is improved when the area is subjected to a higher temperature (i.e. a second current pulse of equal magnitude to the first).
The ellipticity of prior austenite grains at the primary weld nugget edge decreases during the second current pulse and the elongated grains become more equi-axed.
Double pulsing decreases the average PAGS and the block width and increases the geometrically necessary dislocation density of the lath martensite. The smallest mean PAGS and estimated block width and the highest geometrically necessary dislocation density is obtained for double pulse welds subjected to a second current pulse lower than the first. In this case, the peak temperature at the primary weld nugget edge only allows limited austenite grain growth.
The mechanical properties of the welds have improved due to double pulsing and welds subjected to two equal current pulses show the highest maximum CTS and TSS and a favourable plug failure.
For the AHSS examined in this study, negative influence of phosphorous segregation to the grain boundaries on the mechanical performance of the welds is more pronounced than the positive influence expected due to grain size reduction.
Acknowledgement
This research was carried out under project number F22.8.13507 in the framework of the Partnership Program of the Materials innovation institute M2i (www.m2i.nl) and the Foundation of Fundamental Research on Matter (FOM) (www.fom.nl), which is part of the Netherlands Organisation for Scientific Research (www.nwo.nl). The authors thank Tata Steel for delivering the materials, Dr. Roumen Petrov for his wise advice for the present work and Hans Winter for performing the EPMA measurements.
ORCID
P. Eftekharimilani http://orcid.org/0000-0003-4254-0913
E.M. van der Aa http://orcid.org/0000-0001-5561-1528
M.J.M. Hermans http://orcid.org/0000-0002-6204-5285
I.M. Richardson http://orcid.org/0000-0002-3651-3233
Additional information
Funding
References
- Khanna SK, Long X. Residual stresses in resistance spot welded steel joints. Sci Technol Weld Join. 2008;13(3):278–288. doi: 10.1179/174329308X283884
- Nayak SS, Zhou Y, Baltazar Hernandez VH. Resistance spot welding of dual-phase steels: heat affected zone softening and tensile properties. Proceedings of the 9th International Conference on ‘Trends in Welding Research’, Chicago, USA; 2012. p. 641–649.
- Den Uijl NJ, Smith S. Resistance spot welding of advanced high strength steels for automotive industry. Proceedings of the 4th International Seminar on ‘Advances in Resistance Welding’, Wels, Austria; 2006. p. 30–60.
- Pouranvari M, Asgari HR, Mosavizadch SM, et al. Effect of weld nugget size on overload failure mode of resistance spot welds. Sci Technol Weld Join. 2007;12(3):217–225. doi: 10.1179/174329307X164409
- Chao YJ. Failure mode of spot welds: interfacial versus pull out. Sci Technol Weld Join. 2003;8(2):133–137.
- Furusako S, Murayama G, Oikawa H, et al. Current problems and the answer techniques in welding technique of auto bodies-first part. Tokyo, Japan; 2013. p. 69–75 (Nippon Steel Technical Report No. 103).
- Eftekharimilani P, van der Aa E, Hermans MJM, et al. The microstructural evolution and elemental distribution of a 3rd generation 1 GPa advanced high strength steel during double pulse resistance spot welding. IIW Annual Assembly, Melbourne, Australia; 2016, document III-1764-16.
- Amirthalingam M, van der Aa EM, Kwakernaak C, et al. Elemental segregation during resistance spot welding of boron containing advanced high strength steels. Weld World. 2015;59:743–755. doi: 10.1007/s40194-015-0250-3
- Morito S, Tanaka H, Konishi R, et al. The morphology and crystallography of lath martensite in Fe-C alloys. Acta Mater. 2003;51:1789–1799. doi: 10.1016/S1359-6454(02)00577-3
- Morito S, Huang X, Furuhara T, et al. The morphology and crystallography of lath martensite in alloy steels. Acta Mater. 2006;54:5323–5331. doi: 10.1016/j.actamat.2006.07.009
- Ray RK, Jonas JJ. Transformation textures in steels. Int Mater Rev. 1990;35(1):1–36. doi: 10.1179/095066090790324046
- Hidalgo J, Santofimia MJ. Effect of prior austenite grain size refinement by thermal cycling on the microstructural features of as-quenched lath martensite. Metall Trans A. 2016;47:5288–5301. doi: 10.1007/s11661-016-3525-4
- Krauss G. Steels: heat treatment and processing principles. Materials Park, OH: ASM International; 1990.
- Furuhara T, Kikumoto K, Saito H, et al. Phase transformation from fine-grained austenite. ISIJ Int. 2008;48(8):1038–1045. doi: 10.2355/isijinternational.48.1038
- Hanamura T, Torizuka S, Tamura S. Effect of austenite grain size on transformation behaviour, microstructure and mechanical properties of 0.1C–5Mn martensitic steel. ISIJ Int. 2013;53:2218–2225. doi: 10.2355/isijinternational.53.2218
- Hui W. Microstructure refining and strengthening of martensitic steel, incl. in ultra-fine grained steels. Berlin Heidel-berg: Springer; 2009. p. 300–349.
- Pouranvari M, Marashi SPH. Critical review of automotive steels spot welding: process, structure and properties. Sci Technol Weld Join. 2013;18(5):361–403. doi: 10.1179/1362171813Y.0000000120
- van der Aa EM, Amirthalingam M, Winter J, et al. Improved resistance spot weldability of 3rd generation AHSS for automotive applications. 11th International Seminar on ‘Numerical Analysis of Weldability’, Graz, Austria; 2015.
- Baltazar Hernandez VH, Okita Y, Zhou Y. Second pulse current in resistance spot welded TRIP steel-effects on the microstructure and mechanical behaviour. Weld J. 2012;91:278s–285s.
- Matsushita M, Taniguchi K, Oi K. Development of next generation resistance spot welding technologies. 2013 (JFE Technical Report No. 18:111–117).
- Sawanishi C, Ogura T, Taniguchi K, et al. Mechanical properties and microstructures of resistance spot welded DP980 steel joints using pulsed current pattern. Sci Technol Weld Join. 2014;19(1):52–59. doi: 10.1179/1362171813Y.0000000165
- Jahandideh AR, Hamedi M, Mansourzadeh SA, et al. An experimental study on effects of post-heating parameters on resistance spot welding of SAPH440 steel. Sci Technol Weld Join. 2011;16(8):669–675. doi: 10.1179/1362171811Y.0000000053
- Wakabayashi C, Furusako S, Miyazaki Y. Strengthening spot weld joint by autotempering acceleration at heat affected zone. Sci Technol Weld Join. 2015;20(6):468–472. doi: 10.1179/1362171815Y.0000000023
- VDA 239-100 Material specification: Sheet Steel for Cold Forming; 5 May 2016.
- SEP 1220-2: Testing and documentation guideline for the joinability of thin sheet of steel-part 2: resistance spot welding. VDEh Standard; 2007 (Technical Report 08).
- Eftekharimilani P, van der Aa E, Amirthalingam M, et al. Effect of double pulsing on the microstructural evolution of low alloyed and 3rd generation 1 GPa advanced high strength steels during resistance spot welding. 9th International Seminar on ‘Advances in Resistance Welding’, Miami, FL; 2016.
- Cayron C. ARPGE: a computer program to automatically reconstruct the parent grains from electron backscatter diffraction data. J Appl Crystallogr. 2007;40:1183–1188. doi: 10.1107/S0021889807048777
- Jung GS, Lee KY, Lee JB, et al. Spot weldability of TRIP assisted steels with high carbon and aluminium contents. Sci Technol Weld Join. 2012;17(2):92–98. doi: 10.1179/1362171811Y.0000000081
- Calcagnotto M, Ponge D, Demir E, et al. Orientation gradients and geometrically necessary dislocations in ultrafine grained dual-phase steels studied by 2D and 3D EBSD. Mater Sci Eng A. 2010;527:2738–2746. doi: 10.1016/j.msea.2010.01.004
- Kubin LP, Mortensen A. Geometrically necessary dislocations and strain-gradient plasticity: a few critical issues. Scripta Mater. 2003;48:119–125. doi: 10.1016/S1359-6462(02)00335-4
- Kennett SC, Krauss G, Findley KO. Prior austenite grain size and tempering effects on the dislocation density of low-C Nb–Ti microalloyed lath martensite. Scripta Mater. 2015;107:123–126. doi: 10.1016/j.scriptamat.2015.05.036