
 ?Mathematical formulae have been encoded as MathML and are displayed in this HTML version using MathJax in order to improve their display. Uncheck the box to turn MathJax off. This feature requires Javascript. Click on a formula to zoom.
Abstract
Purpose
To develop a bleeding-pattern prediction model to inform counselling on amount and regularity of bleeding after levonorgestrel-releasing intrauterine system (LNG-IUS) placement.
Materials and methods
Fixed-cluster and regression-tree models were developed using bleeding data pooled from two clinical trials of LNG-IUSs. Models were trained and cross-validated on LNG-IUS 12 data, then applied to LNG-IUS 20 and LNG-IUS 8 data. Three clusters were generated for the fixed-cluster model: predominantly amenorrhoea; predominantly spotting; and predominantly bleeding. A random-forest model predicted the future-bleeding cluster, then the probability of cycle regularity was calculated. In the regression-tree model, women were assigned by the model to less- or more-bleeding groups.
Results
With LNG-IUS 12 (n = 1351) in the fixed-cluster model, 70.4% of women were correctly classified. The correct classification rates for LNG-IUS 20 (n = 216) and LNG-IUS 8 (n = 1300) were 72.2% and 69.0%. The probability distribution for cycle regularity showed regular and irregular bleeding were best separated with LNG-IUS 12 data, and less well with LNG-IUS 20 and LNG-IUS 8 data. In the regression-tree model there was high variability in the more- and less-bleeding group distributions with LNG-IUS 12 data.
Conclusions
A fixed-cluster model predicted bleeding patterns better than a regression-tree model in women using LNG-IUS, yielding understandable, informative output.
摘要
目的:建立一个月经出血模式预测模型, 为左炔诺孕酮宫内释放系统(LNG-IUS)置入术后月经量及规律性的咨询提供依据。
材料和方法:应用两项LNG-IUS临床试验得出的有关月经出血模式数据建立固定聚类和回归树模型。利用LNG-IUS 12的数据对模型进行校准和交叉验证, 然后将该模型应用于LNG-IUS 20和LNG-IUS 8的数据。固定聚类模型产生三个集群:以闭经为主;以经间期点滴状出血为主;以出血为主。利用随机森林模型预测未来的出血类型集群, 并计算出月经周期规律的概率。在回归树模型中, 女性被分配到出血较少或较多的组。
结果:应用LNG-IUS 12(n=1351)固定聚类模型, 70.4%的女性被正确分类。LNG-IUS 20(n=216)和LNG-IUS 8(n=1300)的正确分类率分别为72.2%和69.0%。月经周期规律的概率分布表明, LNG-IUS 12数据对经期规则出血和不规则出血的分组效果最好, LNG-IUS 20和LNG-IUS 8数据对经期规则出血和不规则出血的分组效果较差。在回归树模型中, LNG-IUS 12数据对出血量多组和出血量少组的分组效果有很高的变异性。
结论:在放置LNG-IUS的女性中, 固定聚类模型比回归树模型可更好地预测出血模式, 所提供的信息合理且有价值。
Introduction
Long-acting reversible contraceptive (LARC) methods provide highly effective, long-term, reversible birth control and overcome the reliance of other methods on user adherence [Citation1,Citation2]. There are hormonal (intrauterine system [IUS] or implant) and non-hormonal (copper intrauterine device [IUD]) LARC options, all with contraceptive efficacies similar to that of surgical sterilisation [Citation3]. Generally, LARCs are cost-effective and associated with high satisfaction and continuation rates.
As with many contraceptive methods LARC usage may change menstrual bleeding patterns, which can have an impact on user acceptability and compliance [Citation4,Citation5]. Furthermore, changes in bleeding pattern can vary depending on the method adopted. Contraceptive implants are often associated with cycle irregularity, possibly with amenorrhoea or infrequent, frequent and/or prolonged bleeding [Citation6]. Copper IUDs have been reported to increase the volume, duration and frequency of menstrual bleeding, and intermenstrual spotting can also occur [Citation7–10]. Levonorgestrel-releasing IUSs (LNG-IUSs) have been associated with increased bleeding and spotting during the initial 1–3 months post-placement, owing to local effects of LNG on the endometrium, but the number of these episodes reduces over time, and LNG-IUSs are generally associated with fewer bleeding days at 12 months than at baseline [Citation11–16]. Changes in bleeding pattern with an LNG-IUS are likely to be dose-dependent. In a 12-month analysis, LNG-IUS 20 (Mirena®; average LNG release rate of 20 μg/24 h over first year) and LNG-IUS 12 (Kyleena®; average LNG release rate of 12 μg/24 h over first year) were associated with higher proportions of women with no bleeding or spotting days than was LNG-IUS 8 (Jaydess®/Skyla®; average LNG release rate of 8 μg/24 h over first year) [Citation17].
Despite very high satisfaction and continuation rates with LARCs [Citation1,Citation2,Citation18,Citation19], bleeding-pattern changes are the most common reason for discontinuation and user dissatisfaction [Citation7,Citation20]. Association of particular bleeding patterns with different contraceptive methods can influence women’s choice of, and persistence with a method. For example, an expectation of amenorrhoea was shown to influence method satisfaction with LNG-IUS [Citation21], and less bleeding or amenorrhoea appear to be important reasons why women choose LNG-IUS [Citation17]. Fears of menstrual irregularity can deter some women from using hormonal contraception [Citation22], so it is important to counsel about the likelihood of unpredictable, frequent or heavy bleeding [Citation4].
Contraceptive counselling should be tailored to women’s needs, concerns and preferences, and should inform about side-effects and potential complications [Citation23,Citation24]. Counselling can also reduce fears and uncertainty and encourage women to try a method [Citation25]. Long-acting contraception requires several years’ commitment, so understanding possible bleeding-pattern changes is desirable. Accordingly, counselling should cover both potential long-term bleeding patterns and what to expect in the initial 1–3 months. However, no tools are currently available to health care professionals (HCPs) that can provide such long-term personalised information for different LARC methods.
Previous analyses of bleeding diaries have identified bleeding-pattern clusters based on bleeding cyclicity and desirability [Citation26]. However, bleeding-pattern clusters associated with a product in clinical trials are less meaningful when counselling individuals in clinical practice. A model to estimate menstrual blood loss has also been developed based on bleeding diaries, laboratory parameters and age from three prospective clinical studies in women with bleeding issues such as heavy, frequent or prolonged bleeding [Citation27]. Although identifying bleeding- pattern clusters and predicting volume of menstrual blood loss may be useful, further analysis in healthy women is required. Moreover, a tool is needed that can predict menstrual bleeding pattern in terms of clinically meaningful outputs, such as bleeding categories. These could inform an individual about what duration and intensity of bleeding to expect after device placement.
Here, we report development of a model to predict bleeding pattern and regularity for individual LNG-IUS users. Two statistical approaches, random forests and regression trees, were developed. Both approaches have been used extensively in areas such as transportation and computer science [Citation28–31] however, this is the first time to the author’s knowledge that such approaches have been used to provide individualised information regarding menstrual bleeding pattern in the clinical setting. Models were developed, validated and their feasibility for use in counselling patients was assessed. Based on a woman’s short-term bleeding pattern following LNG-IUS placement, it is anticipated that the chosen model could be used by HCPs to tailor counselling on what long-term bleeding pattern might be expected.
Materials and methods
Source data
Source data were obtained from two studies. The first was a phase II, open-label, randomised dose-finding study in nulliparous and parous women (NCT00185380) [Citation13]. Women were randomised 1:1:1 to receive either LNG-IUS 12 (n = 245), LNG-IUS 8 mg (n = 239) or LNG-IUS 20 (n = 254). The second was a phase III, open-label, randomised contraceptive efficacy and safety study using two doses of LNG-IUS (NCT00528112) [Citation32]. Women were randomised 1:1 to LNG-IUS 12 (n = 1452) or LNG-IUS 8 (n = 1432). Both studies had similar designs and enrolled healthy adult women aged ≤40 years with regular menstrual cycles who had requested contraception.
Demographic characteristics for users of LNG-IUS 12 and LNG-IUS 8 were generally similar and consistent between studies. Overall, users of LNG-IUS 20 tended to be older (mean age 32 vs 28 for LNG-IUS 12 and LNG-IUS 8) and a higher proportion were parous (79.6% vs 64.9% for LNG-IUS 12 and 64.5% for LNG-IUS 8) perhaps as a reflection of the higher mean age. There was some degree of difference in the race of participants using LNG-IUS 12 and LNG-IUS 8 compared with LNG-IUS 20. The mean weight of users of LNG-IUS 12, LNG-IUS 8 and LNG-IUS 20 was similar (mean weight 68.4 kg, 68.0 kg and 67.9 kg respectively).
Available study data relevant to the models were: 24 baseline variables (including demography, gynaecological history, daily bleeding-diary entries post LNG-IUS placement) and 42 derived summary variables [Citation33]. No bleeding data before LNG-IUS placement were available. Bleeding diaries recorded the number of bleeding/spotting days and the intensity of bleeding (categorised as none, spotting, light, normal, heavy). As perceptions of bleeding intensity are subjective, the categories light, normal and heavy were combined into one category ‘bleeding’ for the prediction model. Valid bleeding diaries could have isolated missing days but no more than two consecutive missing days per reference period and no more than 24 missing days per year.
General considerations for classification
Both classification models assumed that a woman would enter bleeding-diary data without missing entries and would attend a check-up 90 days after LNG-IUS placement where she could receive further counselling; 90 days is recognised as the interval post-placement during which bleeding patterns are most affected by LNG-IUSs [Citation17]. Available information at this point included baseline variables and 90 days of a daily bleeding diary (). The model should process this information to assess bleeding patterns during the prediction timeframe, defined here as days 91–270 post-placement. Two different classification/prediction models (fixed cluster; regression tree) were trained using LNG-IUS 12 data. Then, two techniques were used to assess the validity of the models: parameter optimisation by three-fold cross-validation within the LNG-IUS 12 dataset, and application of the trained model to LNG-IUS 20 and LNG-IUS 8 data.
Figure 1. Bleeding intensity during days 0–360 post-placement of levonorgestrel-releasing intrauterine system, compiled from bleeding-diary entries from all participants using LNG-IUS 12 in two in clinical trials [Citation13,Citation28]. Each row represents data from one individual participant.
![Figure 1. Bleeding intensity during days 0–360 post-placement of levonorgestrel-releasing intrauterine system, compiled from bleeding-diary entries from all participants using LNG-IUS 12 in two in clinical trials [Citation13,Citation28]. Each row represents data from one individual participant.](/cms/asset/dbe6290d-4a71-444a-9c83-393bd5ac3cdd/iejc_a_1843015_f0001_c.jpg)
Fixed-cluster (random-forest) approach
The fixed-cluster model was based on a random-forest algorithm and least absolute shrinkage and selection operator (LASSO) linear regression (discussed below), and aimed to provide information on the category of bleeding pattern a woman may expect to have, and on her likelihood of cycle regularity. The idea was to identify clusters of similar bleeding patterns based on the amount and duration of bleeding or spotting in the diary data used for model development, then to set up a model that could predict to which of these clusters an untested individual would most likely belong.
Model development consisted of a four-step procedure using LNG-IUS 12 data. First, bleeding amount/intensity clusters were created. Clustering rules were developed based on the number of bleeding and spotting days during days 91– 270. Three clusters were generated corresponding to commonly reported bleeding pattern types [Citation34,Citation35]: predominantly amenorrhoea (<5% spotting days or <1% bleeding days within days 91–270 [equivalent to ≤8 spotting days or ≤1 bleeding day]); predominantly spotting (women not belonging to the predominantly amenorrhoea cluster and with <5% bleeding days [≤8 days] within days 91–270); predominantly bleeding (all other women, i.e., ≥5% bleeding days [>8 days] within days 91–270; ). Quantitative cut-point criteria and recognisable names for clusters were defined to make the output both informative and easily understandable for individuals being tested and to avoid cluster overlap.
Figure 2. Bleeding intensity from daily bleeding diaries during days 0–270 post-placement of LNG-IUS 12 in clinical trials [Citation13,Citation28], clustered by bleeding pattern for the fixed-cluster model. Each row represents data from one individual participant.
![Figure 2. Bleeding intensity from daily bleeding diaries during days 0–270 post-placement of LNG-IUS 12 in clinical trials [Citation13,Citation28], clustered by bleeding pattern for the fixed-cluster model. Each row represents data from one individual participant.](/cms/asset/a3ae61b9-f99a-42c6-acf6-9a65194e21b2/iejc_a_1843015_f0002_c.jpg)
Second, a random-forest model using R 3.5.1© (The R Foundation; https://www.r-project.org/, packages: mlr, forecast, randomForest and glmnet) was used to predict future-bleeding clusters and a cost matrix [Citation36] applied to penalise classification errors by severity (see supplementary information). Model performance was analysed by three-fold cross-validation randomly repeated 100 times, by which point the variance in performance values between iterations was small.
The third step involved assessment of the probability of cycle regularity among women classified as predominantly bleeding or predominantly spotting. This required development of a method to identify cycle regularity, which in turn required estimation of cycle length for each individual before regularity could be assessed. An autocorrelation function compared the distribution of an individual’s bleeding data with the same distribution shifted by different numbers of days corresponding to the span of a normal menstrual cycle (21–35 days) [Citation37]. The individual’s natural cycle length was the shift value at which the value of the autocorrelation function was maximal. Cycle length was then used to assess cycle regularity. Two time-series models (an individual’s pattern of bleeding during days 91–270) with and without seasonal (i.e., cyclical) components were compared using the Akaike information criterion. Cycle regularity was achieved (termed ‘true regularity’) if the seasonal model had a higher Akaike information criterion value than the unadjusted model ().
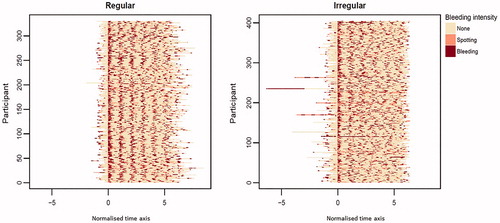
Figure 3. Bleeding patterns for participants using LNG-IUS 12 who were assigned to the ‘predominantly bleeding’ cluster, normalised with respect to cycle length and start of first bleeding/spotting episode within days 91–270. Each row represents data from one individual participant. LNG-IUS, levonorgestrel-releasing intrauterine system.
The fourth step was to train the model. Using cycle regularity as a binary outcome variable (regular or irregular), a logistic regression model was fitted to all available LNG-IUS 12 baseline-variable data. LASSO regression was then used for variable selection to train the model. Within the parameter estimation step, a penalty term equal to the absolute value of the magnitude of coefficients was added to the equation. Variables with coefficients that became zero because of regularisation were eliminated from the model (see supplementary information). The final model gave the probability of a regular cycle based on baseline variables by inputting the observed independent variables into the trained model equation:
where
is the number of covariates in the final model after applying the LASSO algorithm. The sensitivity and specificity of the model were investigated by receiver operating characteristic (ROC) analysis and the quality of prediction estimated by the area under the ROC curve (AUC). An AUC value of 0.5 = coincidence, a value of 1.0 = perfect prediction.
Regression-tree approach
Instead of predicting medically defined clusters as endpoints, an alternative approach was applied to predict a combination of individual continuous endpoints. Using SAS 9.4 (SAS Institute Inc., UK), a regression tree was developed by identifying baseline variables that categorise women into different groups according to predefined outcome variables [Citation38]. The most relevant baseline variables are identified by calculating and maximising the node purity (i.e., how well different distributions are separated) measured with the Gini coefficient [Citation39]. Outcome variables of interest during days 91–270 were: number of bleeding days; number of spotting days; and cycle regularity. First, each woman was assigned to a ‘more-bleeding’ or a ‘less-bleeding’ group. Then, women in the ‘more-bleeding’ group were assigned to either a ‘regular-bleeding’ or an ‘irregular-bleeding’ group, while women in the ‘less-bleeding’ group were assigned to either a ‘more-spotting’ or ‘less-spotting’ group. These outcome groups were based on the number of bleeding days during days 91–270, but there were no predefined splitting points for the outcome groups. Instead, criteria for assignment to each outcome group were determined by the model.
Results
Models were developed and trained using bleeding-diary data from women using LNG-IUS 12 (n = 1351). Model validity was assessed using LNG-IUS 20 (n = 216) and LNG-IUS 8 (n = 1300) bleeding-diary data [Citation13,Citation32].
Fixed-cluster model
The mean (standard deviation [SD]) correct classification rate with LNG-IUS 12 data was 70.4% (±0.005) (). Where misclassification occurred, most women were assigned to neighbouring clusters; 98.7% were assigned to the correct or to a neighbouring cluster. Additionally, there was a high probability (>86%) that the true cluster was the predicted cluster or a cluster representing less bleeding than predicted (e.g., the individual was predicted to be in the predominantly bleeding category, but their true category was predominantly spotting).
Table 1. Fixed-cluster model performance analysis with LNG-IUS data showing proportion of women allocated to each cluster and correct classification rates.
Validity
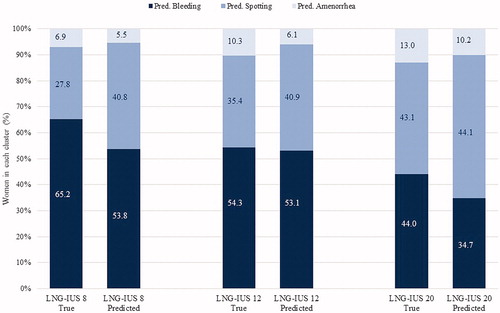
The validity of the fixed-cluster model was tested with LNG-IUS 20 and LNG-IUS 8 data. Testing found the true predominantly bleeding cluster was smallest with LNG-IUS 20 and largest with LNG-IUS 8. The opposite was true for the predominantly amenorrhoea cluster (). For LNG-IUS 12 the cluster sizes of the true and of the predicted clusters were quite similar. For LNG-IUS 20, proportionally more women were predicted to belong to the spotting cluster and proportionally fewer to the bleeding cluster than were observed in the true cluster distribution. Notably, the predicted LNG-IUS 8 cluster sizes were very similar to those for LNG-IUS 12 data. Model performance analyses with LNG-IUS 20 and LNG-IUS 8 data gave mean (SD) correct classification rates of 72.2% (±0.010) for LNG-IUS 20 and 69.0% (±0.004) for LNG-IUS 8 ().
Figure 4. Sizes of the true and predicted clusters by device and cluster type. LNG-IUS, levonorgestrel-releasing intrauterine system.
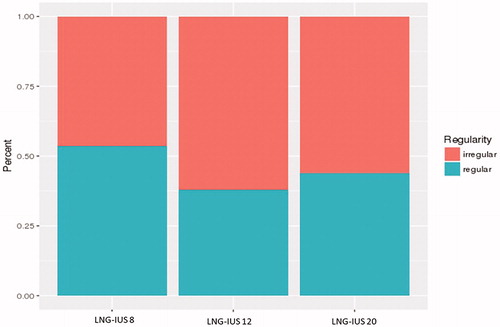
Data from LNG-IUS 20 and LNG-IUS 8 were also used to analyse the validity of the cycle regularity regression model. In the analysis of true regularity, proportionally more women using LNG-IUS 20 and LNG-IUS 8 than LNG-IUS 12 were predicted to have regular cycles ().
Figure 5. Proportion of women with regular and irregular cycles by device in the regularity assessment. LNG-IUS, levonorgestrel-releasing intrauterine system.
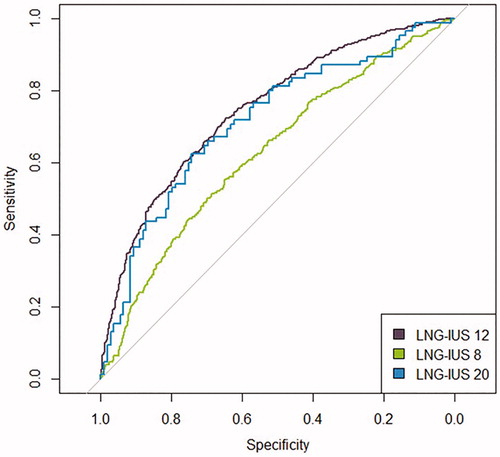
When predicted regularity status was separated by device and true regularity status, the best separation between the distributions of irregular and regular cycles was seen with LNG-IUS 12 (), with both the LNG-IUS 20 and LNG-IUS 8 regularity distributions showing greater overlap. Assessment of the performance of the model by ROC analysis () demonstrated that the highest AUC value (95% CI) was associated with LNG-IUS 12 data (0.75 [0.72, 0.78]), followed by LNG-IUS 20 (0.71 [0.64, 0.79]) and lowest for LNG-IUS 8 (0.63 [0.60, 0.66]), suggesting that the accuracy of the model was best for LNG-IUS 12 and poor for LNG-IUS 8. The relationship between the AUC values is consistent with the differences seen between the ROC curves. These findings indicate that the model is quite accurate for women using LNG-IUS 12, but less accurate with LNG-IUS 20 or LNG-IUS 8.
Figure 6. Logistic regression of regularity by device in the fixed-cluster model. The model’s ability to predict regularity is indicated by the amount of overlap between the coloured bars, with greater separation between the coloured bars indicating better prediction. LNG-IUS, levonorgestrel-releasing intrauterine system.
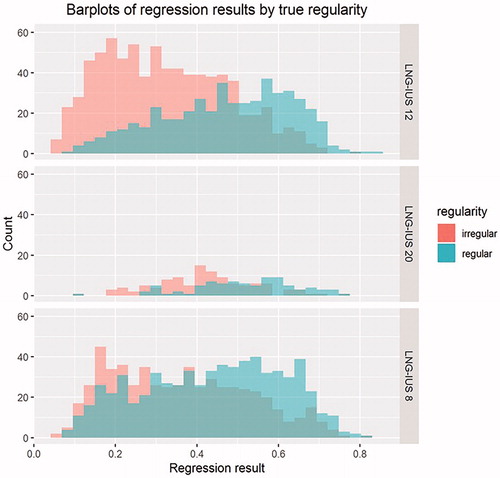
Figure 7. Receiver operating characteristics plot for LASSO regularity regression model in the fixed-cluster model demonstrating highest sensitivity and specificity is achieved for LNG-IUS 12. LASSO, least absolute shrinkage and selection operator; LNG-IUS, levonorgestrel-releasing intrauterine system.
A sensitivity analysis was further conducted and revealed that baseline parameters such as age, parity, weight, height, BMI and race did not influence model performance nor did factors relating to gynaecological or medical history. This confirmed that the model will have the same predictive accuracy regardless of the individual’s baseline characteristics.
Regression-tree model
The regression-tree model identified different splitting criteria during days 1–90 to separate the distributions of each outcome during days 91–270 (less versus more bleeding; regular versus irregular bleeding; less versus more spotting). Number of bleeding days within days 1–90 was the best splitting variable for the distribution of the number of bleeding days during day 91–270. Greatest node purity was achieved with a threshold of 19 bleeding days: women with ≤19 bleeding days during days 1–90 were assigned to the future less-bleeding group, and those with >19 bleeding days to the more-bleeding group.
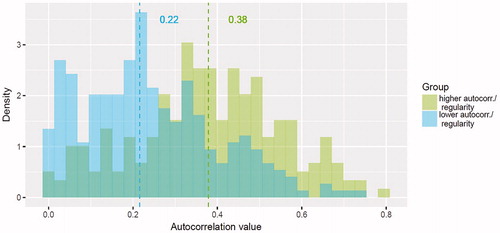
Within the more-bleeding group, an autocorrelation value 0.3 for days 1–90 was the best threshold to split the irregular (<0.3) and regular (≥0.3) bleeding subgroups during days 91–270 (). Within the less-bleeding group, 5 spotting days during month 3 was the best threshold to split the less- and more-spotting subgroups during days 91–270 (<5 spotting days: less-spotting subgroup; ≥5 spotting days: more-spotting subgroup).
Figure 8. Histogram and median values of autocorrelation values by group during days 91–270 in the regression-tree model. The model’s ability to predict regularity is indicated by the amount of overlap between the coloured bars, with greater separation between the coloured bars indicating better prediction. Autocorr., autocorrection.
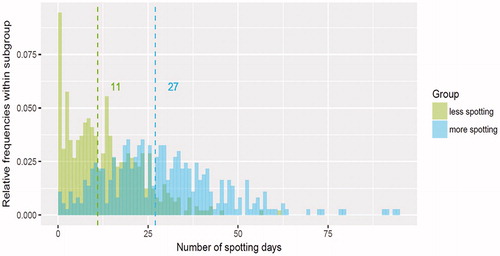
Testing the viability of the model with LNG-IUS 12 data found that the median number of bleeding days in the less-bleeding group was considerably lower than that in the more-bleeding group (5 days vs 23 days, respectively). However, there was greater variability in the distribution of values observed in the more-bleeding than in the less-bleeding group (). There was also a substantial difference in median values in the more-spotting and less-spotting subgroups (11 days vs 27 days), but the two distributions overlapped substantially ().
Figure 9. Distribution and median values of the number of bleeding days by subgroup during days 91–270 in the regression-tree model.
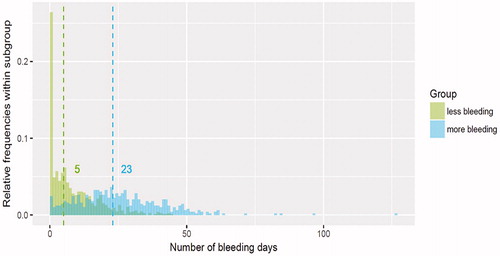
Figure 10. Distribution and median values of number of spotting days by subgroup during days 91–270 in the regression-tree model.
Finally, within the more-bleeding group, women with more irregular bleeding during days 1–90 generally had more cycle irregularity during days 91–270 than did those with more regular bleeding during days 1–90 (median autocorrelation value, 0.22 vs 0.38), but the distributions of the two groups were broad and overlapped substantially.
Validity
Performance and validity testing on LNG-IUS 20 and LNG-IUS 8 data was deemed unwarranted owing to the high variability and degree of overlap between the groups observed with LNG-IUS 12 data.
Discussion
Based on bleeding patterns during the 3 months post-placement of an LNG-IUS (days 1–90), our fixed-cluster (random-forest prediction) model was better than our regression-tree model in predicting bleeding outcomes among LNG-IUS users during the following 6 months (days 91–270). The fixed-cluster model also did well in performance analysis. Prediction of an individual’s future-bleeding cluster was quite accurate for all three LNG-IUSs in the fixed-cluster model, but further testing of the model’s validity showed that prediction of cycle regularity was better with LNG-IUS 12 than with LNG-IUS 8 and LNG-IUS 20, and ROC analysis corroborated that the model was most predictively accurate for LNG-IUS 12. On this basis, the fixed-cluster model may yield information that is useful when counselling women initiating LNG-IUS 12 but may be unsuitable for support of other LNG-IUSs.
Each model has strengths and limitations. The fixed-cluster approach allows pre-determined, understandable, well-separated clusters to be defined with obvious benefits in terms of providing comprehensible, informative output for the women being assessed. The model developed here predicts bleeding-pattern changes over a prediction timeframe of 6 months. Other timeframes were investigated (data not shown): shorter ones yielded better results and longer ones yielded worse results, but the 6-month interval provided the best balance between accuracy and utility. The predicted cluster sizes with LNG-IUS 8 and LNG-IUS 12 were similar, which may relate to the relatively small difference in LNG dose between these devices (13.5 mg vs 19.5 mg respectively) and therefore in differences seen during the period post-placement that informed prediction. However, the true clusters associated with these two devices were distributed differently.
Establishing a relationship between cycle regularity and the available baseline data proved difficult. The regularity prediction model was less accurate when based on LNG-IUS 20 and LNG-IUS 8 than on LNG-IUS 12 data, which may be attributable to the dose-dependent nature of bleeding-pattern alterations. The higher-dose LNG-IUS 20 is more commonly associated with amenorrhoea than are the other devices, and the lower-dose LNG-IUS 8 with a higher number of bleeding and spotting days than is LNG-IUS 12, differences that may limit the comparability of the devices [Citation13,Citation17,Citation32]. Furthermore, it is possible that confounding variables such as hormone levels, stress, external influences and intermenstrual bleeding, which are inherently difficult to identify correctly, may preclude modelling of cycle regularity. Other weaknesses of the fixed-cluster approach include the complexity of the underlying statistical methodology and, here, an observed misclassification error of approximately 29%.
A benefit of the regression-tree approach is that it uses an intuitive statistical method, which assigns individuals to a distribution of outcomes of interest, rather than predicting a specific value. Thus, there is no misclassification rate and no need to predefine groups. However, the main drawback of the regression-tree approach in this application is the high overlap and wide distribution of the more-bleeding and more-spotting groups, which would create ambiguous outcomes for users of the model.
An overall limitation of both models is that they are only applicable to LNG-IUS and not to hormonal implants or non-hormonal copper IUDs. Additionally, heavy menstrual bleeding was an exclusion criterion for the clinical trials and therefore the model is not applicable to these women. Further evaluation of the models in women using non-hormonal LARCs such as copper IUDs, and in women with heavy menstrual bleeding could broaden the models’ applicability. Additionally, bleeding data from before LNG-IUS placement were not obtained and therefore their impact on the models not investigated. However, they would likely have been confounded by use of other forms of contraception, and retrospective data collection would be susceptible to recall bias.
In terms of informing women initiating LNG-IUS about potential changes in bleeding patterns, anticipatory counselling is very important [Citation40]. Bleeding pattern during the first 3 months post-placement is considered a major determinant of method tolerability and continuation, with increased bleeding frequency and heavier volume of bleeding being associated with decreased satisfaction [Citation7,Citation17,Citation20]. Information in the product label and from clinical trials can guide HCPs when counselling women, but no model is currently available to predict future bleeding outcomes on an individual basis.
Notably, interactive digital tools are increasingly accepted by both women and HCPs when making health care decisions [Citation41]. A model that is simple to use and provides meaningful estimates of bleeding pattern could help women make informed contraceptive choices and might facilitate discussions of contraception and bleeding patterns between women without major bleeding issues and their HCPs. The model could also be used to reassure women who experience altered bleeding patterns following LNG-IUS placement and help them to feel more in control of the situation. Further, HCPs could use the model to personalise and enhance counselling about possible bleeding with LNG-IUS, helping women to set realistic expectations, potentially reducing discontinuation and increasing method satisfaction [Citation17].
In our analysis, the fixed-cluster (random-forest prediction) model predicted bleeding patterns better than the regression-tree model. For women using LNG-IUS 12, the probability of correct classification with the fixed-cluster model is high, the outputs are informative, and they are named for ease of understanding. The model was validated using a clinical trial dataset, but further testing with real-world data would help to determine the usability of the model in clinical practice. Development of an interface that can report the model outputs in a format that is clear and easy to understand, and enhance the usability of the model for both women and HCPs, is ongoing. A dedicated observational study is planned to gather real-world evidence of model validity. Women using the interface will have the option to participate in the study and share their anonymous bleeding diary and bleeding pattern prediction data.
Ethics approval and consent to participate
Ethics approval was granted for the original Phase II and Phase III studies and is recorded in the primary publications [Citation13,Citation14].
Consent for publication
Not applicable – manuscript does not contain data from any individual person.
Author contributions
All authors contributed to the study concept and design. CG, CA and A-KF contributed to the analysis and interpretation of the data. VB contributed to clinical interpretation of the results. All authors were involved in revising the manuscript for important intellectual content and approved of the final version for submission. The authors agree to be accountable for all aspects of the work.
Supplemental Material
Download MS Word (13.8 KB)Acknowledgements
Editorial support provided by Highfield Communication, Oxford, UK with funding from Bayer AG, Berlin, Germany.
Disclosure statement
A-KF, CG, CA and VB are employees of Bayer AG, Germany. TF has received fees for consulting services from Bayer outside this project.
Data availability
The datasets generated and/or analysed during the current study are available in the Clinical Study Data Request (CSDR) repository, https://clinicalstudydatarequest.com
Additional information
Funding
References
- Committee on Gynecologic Practice Long-Acting Reversible Contraception Working Group. Committee opinion No. 642: increasing access to contraceptive implants and intrauterine devices to reduce unintended pregnancy. Obstet Gynecol. 2015;126:e44.
- Winner B, Peipert JF, Zhao Q, et al. Effectiveness of long-acting reversible contraception. N Engl J Med. 2012;366(21):1998–2007.
- Trussell J. Contraceptive failure in the United States. Contraception. 2011;83(5):397–404.
- Polis CB, Hussain R, Berry A. There might be blood: a scoping review on women's responses to contraceptive-induced menstrual bleeding changes. Reprod Health. 2018;15(1):114.
- Tolley E, Loza S, Kafafi L, et al. The impact of menstrual side effects on contraceptive discontinuation: findings from a longitudinal study in Cairo, Egypt. Int Fam Plan Perspect. 2005;31(1):15–23.
- Mansour D, Korver T, Marintcheva-Petrova M, et al. The effects of Implanon on menstrual bleeding patterns. Eur J Contracept Reprod Health Care. 2008;13(sup1):13–28.
- Diedrich JT, Desai S, Zhao Q, et al. Association of short-term bleeding and cramping patterns with long-acting reversible contraceptive method satisfaction. Am J Obstet Gynecol. 2015;212(1):50.e1.
- Foran T. The management of irregular bleeding in women using contraception. Aust Fam Physician. 2017;46(10):717–720.
- Godfrey EM, Folger SG, Jeng G, et al. Treatment of bleeding irregularities in women with copper-containing IUDs: a systematic review. Contraception. 2013;87(5):549–566.
- Krishnamoorthy K, Verma U. Chapter 1. Intrauterine devices (IUD): clinical aspects, side effects and potential complications. In: Berhardt LV, editor. Advances in medicine and biology. Vol. 120. Hauppauge (NY): Nova Biomedical; 2017. p. 1–23.
- Andersson K, Odlind V, Rybo G. Levonorgestrel-releasing and copper-releasing (Nova T) IUDs during five years of use: a randomized comparative trial. Contraception. 1994;49(1):56–72.
- Bednarek PH, Jensen JT. Safety, efficacy and patient acceptability of the contraceptive and non-contraceptive uses of the LNG-IUS. Int J Womens Health. 2010;1:45–58.
- Gemzell-Danielsson K, Schellschmidt I, Apter D. A randomized, phase II study describing the efficacy, bleeding profile, and safety of two low-dose levonorgestrel-releasing intrauterine contraceptive systems and Mirena. Fertil Steril. 2012;97(3):616.e3–622.e3.
- Gemzell-Danielsson K, Apter D, Dermout S, et al. Evaluation of a new, low-dose levonorgestrel intrauterine contraceptive system over 5 years of use. Eur J Obstet Gynecol Reprod Biol. 2017;210:22–28.
- Nelson AL. LNG-IUS 12: a 19.5 levonorgestrel-releasing intrauterine system for prevention of pregnancy for up to five years. Expert Opin Drug Deliv. 2017;14(9):1131–1140.
- Jensen J, Mansour D, Lukkari-Lax E, et al. Bleeding patterns with the levonorgestrel-releasing intrauterine system when used for heavy menstrual bleeding in women without structural pelvic pathology: a pooled analysis of randomized controlled studies. Contraception. 2013;87(1):107–112.
- Beckert V, et al. Bleeding patterns with the 19.5 mg LNG-IUS, with special focus on the first year of use: implications for counselling. Eur J Contracept Reprod Health Care. 2019;24(4):251–259.
- Merki-Feld GS, Caetano C, Porz TC, et al. Are there unmet needs in contraceptive counselling and choice? Findings of the European TANCO Study. Eur J Contracept Reprod Health Care. 2018;23(3):183–193.
- Borgatta L, Buhling KJ, Rybowski S, et al. A multicentre, open-label, randomised phase III study comparing a new levonorgestrel intrauterine contraceptive system (LNG-IUS 8) with combined oral contraception in young women of reproductive age. Eur J Contracept Reprod Health Care. 2016;21(5):372–379.
- Weisberg E, Bateson D, McGeechan K, et al. A three-year comparative study of continuation rates, bleeding patterns and satisfaction in Australian women using a subdermal contraceptive implant or progestogen releasing-intrauterine system. Eur J Contracept Reprod Health Care. 2014;19(1):5–14.
- Carvalho NM, Chou V, Modesto W, et al. Relationship between user satisfaction with the levonorgestrel-releasing intrauterine system and bleeding patterns. J Obstet Gynaecol Res. 2017;43(11):1732–1737.
- Clark LR, Barnes-Harper KT, Ginsburg KR, et al. Menstrual irregularity from hormonal contraception: a cause of reproductive health concerns in minority adolescent young women. Contraception. 2006;74(3):214–219.
- Dehlendorf C, Levy K, Kelley A, et al. Women's preferences for contraceptive counseling and decision making. Contraception. 2013;88(2):250–256.
- Dehlendorf C, Krajewski C, Borrero S. Contraceptive counseling: best practices to ensure quality communication and enable effective contraceptive use. Clin Obstet Gynecol. 2014;57(4):659–673.
- Diamond-Smith N, Campbell M, Madan S. Misinformation and fear of side-effects of family planning. Cult Health Sex. 2012;14(4):421–433.
- Gerlinger C, Wessel J, Kallischnigg G, et al. Pattern recognition in menstrual bleeding diaries by statistical cluster analysis. BMC Womens Health. 2009;9:21.
- Schumacher U, Schumacher J, Mellinger U, et al. Estimation of menstrual blood loss volume based on menstrual diary and laboratory data. BMC Womens Health. 2012;12:24.
- Li S, Lee H. Learning daily activity patterns with probabilistic grammars. Transportation. 2017;44(1):49–68.
- Hafezi MH, Liu L, Millward H. Identification of representative patterns of time use activity through fuzzy C-means clustering. Transp Res Rec. 2017;2668(1):38–50.
- Hafezi MH, Liu L, Millward H. A time-use activity-pattern recognition model for activity-based travel demand modeling. Transportation. 2019;46(4):1369–1349.
- Allahviranloo M, Recker W. Daily activity pattern recognition by using support vector machines with multiple classes. Transp Res Part B. 2013;58:16–43.
- Nelson A, Apter D, Hauck B, et al. Two low-dose levonorgestrel intrauterine contraceptive systems: a randomized controlled trial. Obstet Gynecol. 2013;122(6):1205–1213.
- Gerlinger C, Endrikat J, Kallischnigg G, et al. Evaluation of menstrual bleeding patterns: a new proposal for a universal guideline based on the analysis of more than 4500 bleeding diaries. Eur J Contracept Reprod Health Care. 2007;12(3):203–211.
- Belsey EM, Machin D, d'Arcangues C. The analysis of vaginal bleeding patterns induced by fertility regulating methods. World Health Organization Special Programme of Research, Development and Research Training in Human Reproduction. Contraception. 1986;34(3):253–260.
- Fraser IS, Critchley HO, Broder M, et al. The FIGO recommendations on terminologies and definitions for normal and abnormal uterine bleeding. Semin Reprod Med. 2011;29.(5):383–390.
- Breiman L. Random forests. Mach Learn. 2001;45(1):5–32.
- Abraham GE. The normal menstrual cycle. In: Givens JR, editor. Endocrine causes of menstrual disorders. Chicago (IL): Year Book Medical Publishers, Inc.; 1978. p. 15–44.
- Rokach L, Maimon O. Data mining with decision trees: theory and applications. 2nd ed. Vol. 69. London: World Scientific; 2008.
- Hastie TJ, Tibshirani RJ, Friedman JH. The elements of statistical learning: data mining, inference, and prediction. 2nd ed. New York: Springer-Verlag; 2009.
- Villavicencio J, Allen RH. Unscheduled bleeding and contraceptive choice: increasing satisfaction and continuation rates. Open Access J Contracept. 2016;7:43–52.
- Dehlendorf C, Fitzpatrick J, Steinauer J, et al. Development and field testing of a decision support tool to facilitate shared decision making in contraceptive counseling. Patient Educ Couns. 2017;100(7):1374–1381.