?Mathematical formulae have been encoded as MathML and are displayed in this HTML version using MathJax in order to improve their display. Uncheck the box to turn MathJax off. This feature requires Javascript. Click on a formula to zoom.
ABSTRACT
Strengthening of flat slab-column connections to resist imposed lateral drifts is often required for older reinforced concrete structures in which the flat slabs were typically designed to resist gravity load only or have been designed for less stringent requirements. The complex stress state around the columns means that strong experimental evidence is required for the repair and strengthening techniques to be adopted with confidence in practice. Although a significant amount of research has been devoted to strengthening of slab-column connections, a series of limitations still remain. A thorough literature review revealed that only relatively thin and isolated specimens have been tested under seismic-type loading and realistic strengthening scenarios. To overcome these limitations, a full-scale two-story flat slab building specimen was tested at the European Commission’s Joint Research Centre – ELSA Laboratory in Ispra, Italy. This paper describes and analyzes the results obtained from the last of a series of phases, on repaired and strengthened internal and external slab-column connections using post-installed bolts. Compared with previous tests, the full-scale building specimen has a thicker slab (200 mm), realistic slab continuity conditions and the connections were strengthened after they suffered damage from gravity loading and previous lateral loading phases. The results show that post-installed bolts are efficient even under the described conditions (i.e. damaged and repaired specimens with realistic thickness), and punching shear failure was prevented in the strengthened connections.
1. Introduction
Although economical and convenient in terms of architectural design and construction, flat slabs are characterized by a high risk of punching shear failures and uncertainty under seismic loading, due to the complex stress state in the vicinity of the supports. As new knowledge is gained and seismic design codes are improved, more and more structures require strengthening and retrofitting to ensure an adequate level of safety. In preparation of the experimental campaign presented in this paper, a detailed review has been carried out on the behavior of unstrengthen connection as well as on new connections with shear reinforcement, more details can be found in Coronelli et al. (Citation2020).
Several techniques have been proposed and tested in the past with the purpose of enhancing the performance of slab-column connections under gravity loading. A summary and review of these techniques can be found in (Lapi, Pinho Ramos, and Orlando Citation2019; Ruiz, Muttoni, and Kunz Citation2010). Among them, post-installed bolts have been shown to be one of the most practical and efficient methods. Punching loading tests (with or without unbalanced moment) on flat slabs with post-installed bolts have been reported in the literature (Einpaul et al. Citation2016; El-Salakawy, Anna Polak, and Soudki Citation2003; Inácio, Pinho Ramos, and Faria Citation2012; Ricardo et al. Citation2013; Ruiz, Muttoni, and Kunz Citation2010). Fiber-reinforced polymer (FRP) bolts have also been tested as a substitute to steel bolts (Lawler and Anna Polak Citation2011). However, fewer tests can be found in the literature for seismic-type loading, although strengthening with post-installed bolts has been found to be among the most practical and efficient techniques for lateral loading, as well. Seismic-type loading tests with this strengthening technique include Wensheng and Anna Polak (Citation2009), Topuzi, Anna Polak, and Narasimhan (Citation2017) and Almeida et al. (Citation2020). These studies show that the inclusion of bolts enhances the deformation capacity of the slab-column connections and significantly postpones punching shear failure compared to reference specimens without strengthening. Topuzi, Anna Polak, and Narasimhan (Citation2017) showed that post-installed bolts with flexible washers that permit but limit the shear crack opening can be a promising alternative for seismic loading conditions.
The aforementioned tests on slab-column connections strengthened with post-installed bolts were conducted on isolated specimens (representing either the hogging moments region or the entire span in case of Almeida et al. (Citation2020)) with relatively small thickness (not more than 150 mm). Furthermore, these tests have been generally conducted on undamaged specimens, i.e. representing strengthening implemented before a seismic event. Currently, there is a lack of studies on repair and strengthening of damaged slab-column connections with post-installed bolts under seismic-type loading. Damaged specimens have been repaired and tested using other techniques with some success in Pan and Moehle (Citation1992) (using epoxy grout), in Farhey, Adin, and Yankelevsky (Citation1995) (using external steel plates), Robertson and Johnson (Citation2004) (using carbon FRP) and Widianto, Jirsa, and Tian (Citation2010) (using carbon FRP in different configurations and column steel collars in another specimen).
With the purpose of investigating the efficiency of post-installed bolts as a repair and strengthening technique under more realistic conditions compared to past research, a full-scale two-story flat slab building was tested under combined gravity loading and reversed horizontal cyclic loading in the framework of the research project SlabSTRESS (see Coronelli et al. (Citation2021)). The test on the full-scale specimen was conducted over a series of stages and strengthening was applied to connections damaged by gravity loading and previous lateral loading stages. This testing and strengthening sequence represents a realistic scenario, since slabs are often retrofitted after cracking or even damage. The tested slab is continuous and is supported on 12 columns (two internal, six edge and four corner columns), in contrast to previous tests with post-installed bolts which have been limited to isolated specimens. Finally, the slab thickness is equal to 200 mm, which is closer to thicknesses encountered in practice compared to previous tests.
2. The Full-Scale Specimen and Previous Test Phases
2.1. Description of the Full-Scale Building
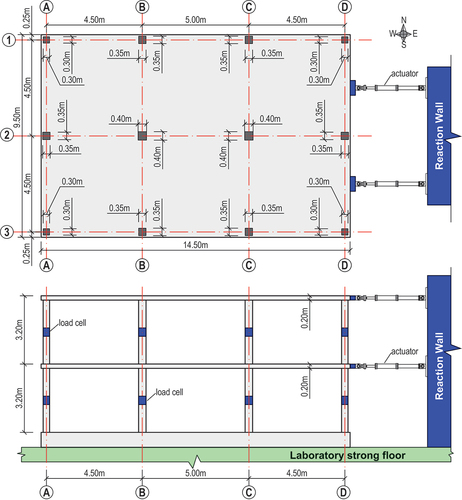
The experimental campaign was carried out at the ELSA laboratory of the European Commission – Joint Research Centre, in Ispra (Italy). A photo of the two-story full-scale building is given in and details are given in . Flat slabs of uniform thickness equal to 200 mm were used on both stories. The columns were square, with side dimension equal to 300 mm, 350 mm and 400 mm for corner, edge and internal columns, respectively (see ). The column size was uniform from base to top, except for the regions near mid-height of the columns in each story, where custom-made steel load cells were installed as an integral part of the column. Span lengths were 4.5 m, except for the central span in the direction of lateral load application, which was 5.0 m ().
Figure 1. Photo of the full-scale two-story building.
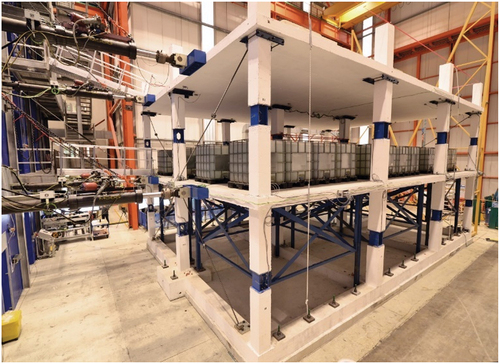
Figure 2. Plan and elevation view of the full-scale building.
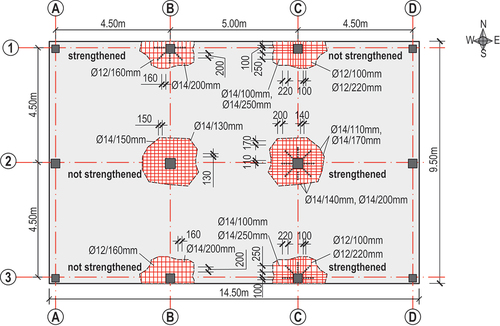
Two patterns of the top flexural reinforcement were applied: “smeared” (axes A and B) and “concentrated” (axes C and D). The concentrated pattern was obtained with half of the total reinforcement for the support section in one quarter of the strip width, as recommended in EN 1992-1-1:2004 (Eurocode2, (CEN Citation2004a)). Two bottom bars passing through the column in each direction were placed in each connection, following another detailing rule in current Eurocode 2 to avoid progressive collapse. Since punching shear failures in different slab-column connections are not expected to occur simultaneously during the test, the ability of this bottom reinforcement (often called “integrity reinforcement”) to carry gravity load after failure of the connection will be put to test. The anchorage at the slab free edge was a L shaped bend, as commonly used in practice in Europe. Additional details about the flexural reinforcement are provided later on in this manuscript in Fig. 5 and in Coronelli et al. (Citation2021).
It was found that punching shear reinforcement is not required according to current Eurocodes in the slab-column connections for the design loads. The connections at the first floor were therefore built without any punching shear reinforcement to study their displacement capacity, reflecting also older flat slab structures in which punching shear reinforcement is often absent. The connections of the second floor were reinforced against punching shear with headed studs to investigate the efficiency of the system. The second story is outside the scope of the current paper (further details can be found elsewhere (Coronelli et al. Citation2021)).
Gravity loading was applied directly on the slab, whereas lateral loading was applied through four actuators connected to the ELSA reaction wall (), two per floor. The specimen was fixed to the laboratory strong floor at the foundation level. The instrumentation included load cells at mid-height of the columns (as previously discussed), as well as load cells and displacement transducers at each actuator, inclinometers installed in the vicinity of slab-column connections and displacement transducers measuring slab thickness changes. All measurements were digitally converted and grouped in clusters and the data was routed through the local network to the data acquisition server. A more detailed description of the specimen instrumentation is provided in other publications (Coronelli et al. Citation2021).
Concrete compressive strength measured on cubes was 27.9 MPa for the upper part of the first floor columns and 38.0 MPa for the second floor columns. For the first and second floor slab, concrete cube compressive strength was 33.0 MPa and 35.6 MPa, respectively (Coronelli et al. Citation2021). B500 reinforcing steel (specified characteristic yield strength fyk = 500 MPa) was used (mean yield strength of 513 MPa and ultimate strain 11.5% for the reinforcement used in the slabs).
2.2. Previous Test Phases on the Full-Scale Specimen
Before strengthening and repairing the slab-column connections that are described in this paper, the full-scale building was subjected to several loading phases (called in the following “tests”). These tests are described in detail elsewhere (Coronelli et al. Citation2021), but an overview is presented in this section.
The first tests were conducted under pseudo-dynamic loading conditions, with the full-scale building being considered as a secondary seismic structure in a building with shear walls. The shear walls were numerically simulated in real time during the test following the procedure outlined in Pegon, Molina, and Magonette (Citation2008). The two pseudo-dynamic tests were named SEIS-SLS (for the serviceability limit state accelerogram) and SEIS-ULS (for the Ultimate Limit State seismic loading).
Quasi-static cyclic tests were subsequently performed on the specimen – without the numerical shear walls – subjected to cyclic loading with increasing displacements. The test sequence was planned to achieve a progressive and controlled damage to the slab-column connections. Test CYC-1 aimed to study the cyclic response of the flat slab frame until punching shear failure was observed on the first floor. Test CYC-2 was performed after a set of the slab-column connections of the first floor were strengthened. The main focus of the current paper is on Test CYC-2.
For the pseudo-dynamic test phases, the loading history was represented by the Y component of signal 00712ya recorded during the MW 6.4 Bingöl earthquake on May 1, 2003. The original peak ground acceleration of 2.92 m/s2 was scaled at 31% and 87% for tests SEIS-SLS and SEIS-ULS respectively to match the Eurocode 8 (CEN Citation2004b) elastic spectra, corresponding to a zone with moderate high seismicity (assumed to be located in the city of Gemona, region of Friuli-Venezia Giulia in north-western Italy).
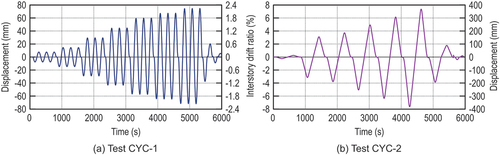
For test CYC-1, the displacement history on the second floor was made up of sets of three cycles with increasing values of global drift ratio (top floor displacement/building height): 0.25%, 0.50%, 1.0%, 1.5%, 2.0%, 2.25% and 2.5% (). The load imposed on the first floor was calculated as half of the load measured on the second floor. This calculation was conducted in real time during the test, ensuring a triangular distribution of lateral loads at all times.
Figure 3. Loading history for tests CYC-1 (a) and CYC-2 (b).
In the tests prior to CYC-2, the gravity load was applied through water tanks (first floor) and concrete blocks (second floor) spread almost uniformly over the slab, as described in more detail in Coronelli et al. (Citation2021). The resulting imposed loads for the first floor were 3.5 kN/m2 for test SEIS-SLS and SEIS-ULS; for test CYC-1 the load was 1.5 kN/m2 for half of the floor on the side of axes C and D () and 3.5 kN/m2 for the rest of the slab. For the second floor, all test phases were conducted with a uniform imposed load equal to 4.3 kN/m2.
2.3. Main Observations from Previous Tests
The behavior of the full-scale building under the two pseudo-dynamic tests (SEIS-SLS and SEIS-ULS) was almost linear elastic, with very limited cracking and without any other damage. Maximum slab thickness increase, which can be assumed to be related to shear crack opening, was detected during the test SEIS-ULS, reaching up to 0.2 mm for the side of the floor area with higher gravity load. Overall, the structure exhibited very low damping during the SEIS test phases: the hysteretic damping in the cycle with maximum amplitude led to a damping factor value of 2.43%, with respect to the critical one (Coronelli et al. Citation2021).
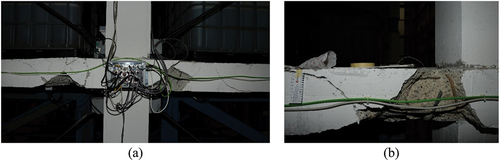
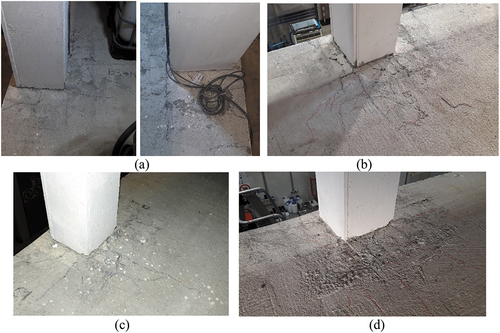
Test CYC-1 caused significant damage to the slab-column connections at the first floor, where no shear reinforcement was present. Edge and corner connections at axes A and D () of the first floor were the most damaged. Excessive torsional and shear cracking occurred in these connections (see ), starting from around 1.5% drift ratio. At the end of test CYC-1, cracking developed further and spalling of concrete occurred (these connections failed by a combination of punching shear and torsion). In fact, damage was judged to be beyond practical repair for the connections at axes A and D, and these connections were not repaired nor strengthened for the subsequent test CYC-2. The integrity reinforcement consisting of longitudinal bars in the compression (bottom) zone of the slab-column connections proved to be efficient to avoid total collapse after punching. The gravity load could be carried and the cyclic tests could be continued after the described failures. The other connections (axes B and C) and all connections of the second floor were less damaged, with flexural cracking but without apparent failure. Column bases were also damaged, with flexural cracking and concrete spalling, whereas the upper parts of the columns were not damaged. Additional information regarding the state of the connections before strengthening (i.e. at the end of phase CYC-1) is given in Section 4.1 and detailed results from SEIS-SLS, SEIS-ULS and CYC-1 are presented in Coronelli et al. (Citation2021).
Figure 4. State of the connections at the end of test phase CYC-1: (a) connection D2; (b) connection D1.
3. Description of Strengthening
3.1. Strengthened Connections and Modified Test Setup
At the end of the test phases described in Section 2.2, three slab-column connections of the first floor were strengthened against punching using post-installed steel bolts. The strengthened connections were those at the intersection of axes B1, C2 and C3, as indicated in . A comparison of two floors, one strengthened and one not, would have been preferable; nevertheless, this was not possible due to the cost and other practical constraints. The purpose of strengthening only a few connections is to allow for a comparison of the response of strengthened and un-strengthened connections. Connection C2 can be compared to B2, B1 to C1 and C3 to B3. Note that the connections at axis B and those at axis C had the same amount but a different distribution of the flexural reinforcement: uniformly distributed and concentrated near the column, respectively. They also had differences in the applied gravity load in the loading phases before strengthening (refer to Coronelli et al. (Citation2021)).
Figure 5. Strengthened slab-column connections and layout of top flexural reinforcement (units: mm unless noted otherwise).
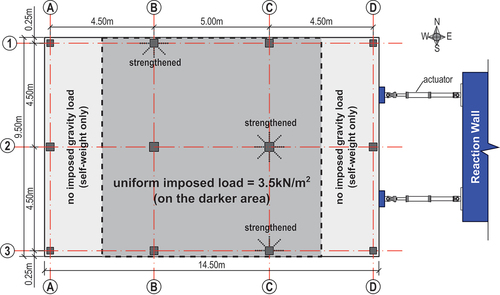
Since the connections at axis A and D were severely damaged from the previous loading phases (refer to Coronelli et al. (Citation2021) for details), the imposed gravity load was removed from these zones (see ). Furthermore, the load at axis C was increased such that the load was equal at both axis B and C to allow for a better comparison. As a result, the imposed gravity load on the hatched area in of the first floor was 3.5 kN/m2 and zero elsewhere. The gravity load was unchanged on the second floor (i.e. it remained equal to 4.3 kN/m2), where all connections bore headed studs as punching shear reinforcement (Coronelli et al. Citation2021).
Figure 6. Modified test setup for the purpose of testing strengthened slab-column connections.
In the test CYC-1 before strengthening, the gravity load at axes B and C represented roughly 40% and 30% of the punching shear capacity of the internal connections, according to EN 1992-1-1:2004 for gravity loading without unbalanced moments (i.e. a Gravity Shear Ratio GSR ≈ 30–40%). Whereas in CYC-2 the gravity load corresponds to a GSR approximately 40% for both internal connections B2 and C2. The lower load in the previous loading phases as well as the differences in the flexural reinforcement layout might have contributed to different damage levels in connections B2 and C2. Close visual inspection of the connections showed that cracking patterns were generally similar. Some differences detected from measurements of the change in slab thickness are discussed in Section 4.1.
3.2. Post-Installed Bolts
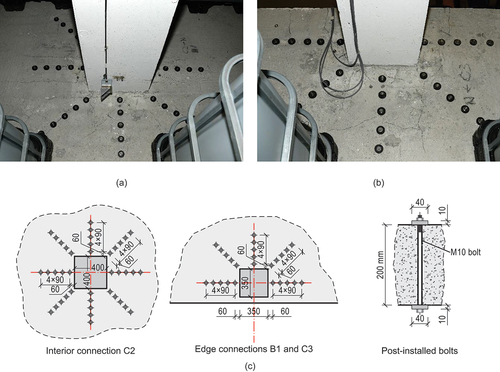
The bolts used to strengthen the connections against punching had a diameter of 10 mm, steel grade 8.8 (specified yield strength of 640 MPa and tensile strength of 800 MPa) and were equipped with 10 mm thick circular washers with a diameter of 40 mm, fulfilling the requirements of fib Model Code 2010 (Citation2013) for adequate anchorage of headed shear reinforcement units.
show the bolts installed in the internal connection and one external connection, respectively. The same layout of the headed studs on the second floor was used to strengthen the connections of the first floor as shown in . As explained in Coronelli et al. (Citation2021), the layout of the shear reinforcement units for the second floor was on the base of calculations that aimed at providing a higher capacity against punching outside the shear-reinforced zone compared to punching within it.
Figure 7. Post-installed bolts (a) the internal connection; (b) exterior (edge) connections; (c) layout and detail.
3.3. Installation of the Bolts
To facilitate the execution of the strengthening operation and to avoid damage to the specimen that would increase uncertainties in the interpretation of the results, small diameter (4 mm) plastic tubes were placed at the predetermined locations according to before casting. The plastic tubes enabled the correct positioning and verticality of the bolts and avoided interference with the installed instruments while causing minimal disturbance to the previous test phases. In practice, a rebar scan is normally needed to ensure that holes can be drilled without interference with the flexural reinforcement.
At the end of test CYC-1, the water tanks on the first floor were emptied and only self-weight remained on the slab during strengthening operations. In a real building, the removal of gravity load (as much as possible) is recommended to ensure that post-installed strengthening is activated once loads are re-imposed. The slabs were then drilled, following the pre-holes. Epoxy resin was used to make minor repairs before installing the bolts and to ensure a planar bearing surface for the washers. The bolts were installed and tightened with a torque wrench to apply a preload of 10 kN. After the installation of the bolts, the loads were re-imposed and measuring instruments were re-installed.
3.4. Loading History
Test CYC-2 was performed for single cycles of global drift ratios 2.5%, 3.0%, 4.0%, 5.0% and 6.0% ( – Loading history for tests CYC-1 (a) and CYC-2 (b) ). The displacement history was imposed with the same procedure as in test CYC-1 (displacement imposed on the second floor and half of the measured horizontal force applied on the first one).
4. Results
4.1. Cracking and Failure
Before the test of the strengthened connections (i.e. at the end of the test CYC-1 (Coronelli et al. Citation2021)), the damage at the internal connections C2 and B2 was comparable, as seen in respectively. Flexural radial cracks were present in both connections, with crack widths measured on the top surface approximately 0.4–0.6 mm. The internal connection that was not strengthened (B2) failed in a combined flexure and punching shear failure mode, as shown in . Gradual development of flexural cracking was observed at the strengthened connection C2 during the test CYC-2, but it did not suffer a visible failure at the end of the test, as shown in .
Figure 8. Internal strengthened connection C2: (a) before strengthening (end of test CYC-1); (b) at the end of the test CYC-2.
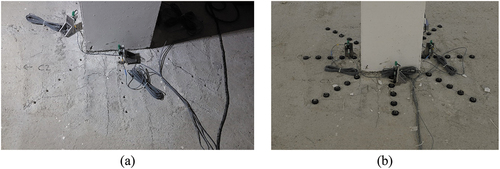
Figure 9. Internal un-strengthened connection B2: (a) at the end of test CYC-1; (b) at the end of the test CYC-2.
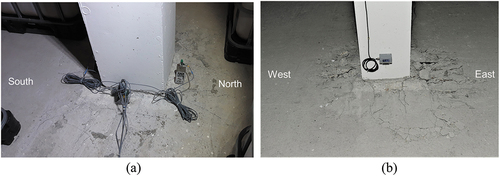
show photos of the external strengthened and un-strengthened connections, respectively, at the beginning and at the end of the test phase CYC-2. The level of flexural cracking was similar for all the connections at the beginning of the test (). The cracks were aligned along the axes B and C (refer to ), but radial cracking was also present. None of the edge connections at axes B and C failed during the test, including the un-strengthened ones, but connection B1 showed signs of a punching crack development (). To gain a better insight of the internal cracking and the state of the connections, the slab thickness increase was measured throughout the test for internal connections B2 and C2 as well as for edge connections B1 and C3. The measurement was conducted by installing displacement transducers inside predrilled holes. One instrument per cardinal point (N and/or S, E and/or W, see orientation in ) was installed at a distance approximately 0.5d from the face of the column (d being the effective depth of the slab).
Figure 10. External strengthened connections: (a) connection B1 before strengthening; (b) connection B1 at the end of the test; (c) connection C3 before strengthening; (d) connection C3 at the end of the test.
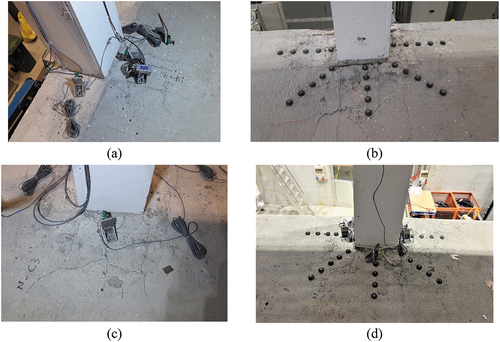
Figure 11. External un-strengthened connections: (a) connection B3 before strengthening phase (views from East and West); (b) connection B3 at the end of the test; (c) connection C1 before strengthening phase; (d) connection C1 at the end of the test.
Results are shown in for both loading phases, CYC-1 and CYC-2. The thickness increase presented in can be considered as related to shear cracking or, if present, also to delamination along the flexural reinforcement.
Figure 12. Slab thickness increase during the test in strengthened edge-connections B1 (a) and B3 (b), internal connection strengthened C2 (c) and un-strengthened B2 (d); slab thickness increase as a function of drift ratio for internal strengthened connection C2 only (e) and compared with un-strengthened connection B2 (f).
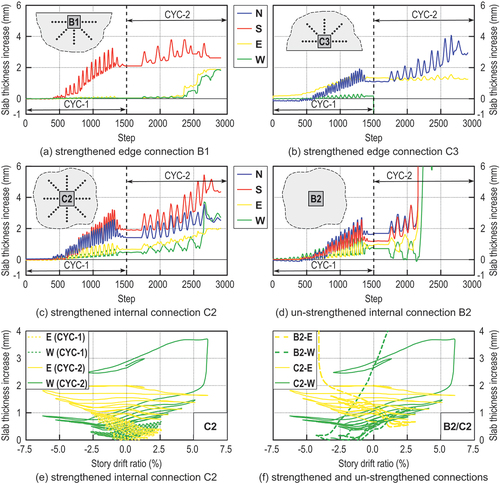
The results for the two strengthened edge connections B1 and C3 (, respectively) show that the response of these two connections was different in terms of internal cracking. The higher gravity load during phase CYC-1 was associated with higher thickness increase in B1 towards the span (i.e. in the South direction). The thickness increase in the direction of lateral loading, however, was very low in B1 until the last cycles of CYC-2, where a progressive increase was observed. In C3, the thickness increase was also higher in the direction of the span (i.e. North), but damage appears to be present on the East side during CYC-1. After strengthening, damage on the East side was kept under control during test phase CYC-2, indicating the effectiveness of the strengthening system for this connection.
confirm that cracking was comparable for the internal connections B2 and C2 during the phase CYC-1. It can be noted, however that thickness change along the longitudinal direction (E-W) was smaller in connection C2 whereas the change of thickness along the transversal direction was smaller in connection B2 during phase CYC-1. During CYC-2, the thickness increase remained similar in B2 and C2 until punching failure of connection B2, which can be detected in by an abrupt increase of the measured values. Although no significant signs were observed from the outside, shows that there was a rapid increase of the slab thickness for connection C2 during the last cycle measured by the instrument on the West side. provides a closer look into the response of the strengthened connection C2 by plotting the thickness increase as a function of the lateral story drifts. indicates that the rapid increase of slab thickness in connection C2 near the end of the test is likely due to the development of a shear crack that was effectively controlled by the post-installed bolts (note the rapid increase and plateauing of C2-W-CYC-2 in ). Significant differences between the strengthened (C2) and un-strengthened (B2) connection can also be observed in , where the thickness increase is plotted as a function of the story drift ratio for test phase CYC-2. For connection B2 and at around 4% drift ratio a steep increase of slab thickness was observed, indicating the occurrence of a punching failure. Comparison of shows that connection B2, without reinforcement, has a rapid and progressive increase in cracking which originates on the east side at 4% and then propagates to the west side. While in the strengthened C2 connection the cracking starts at 6%, on the west side, with a less steep evolution which does not propagate to the other sides and which, once the test is completed, returns to a stable state.
4.2. Global Response
shows the global base shear versus global drift ratio relationship (the base shear represents the sum of readings from the four actuator load cells). The figure shows that the structure had already entered a phase of plastic deformations at the beginning of the test with strengthened connections (CYC-2), with a slight increase of the base shear thereafter. After reaching the maximum base shear, a global degradation began and continued steadily until the end of the test. The maximum base shear forces, Hbase,max, and corresponding global drift ratios, DRHmax, are summarized in for tests CYC-1 and CYC-2. One can observe that the peak base shear was reached at approximately the same value of the global drift ratio for both directions of loading, but with slightly different maximum forces. Compared to the maximum forces, the base shear at the end of the test dropped by nearly 12% and 15% for positive and negative cycles, respectively. This load drop was likely the result of slab-column connections degradation combined with second-order effects, which cannot be neglected for such large horizontal displacements.
Figure 13. Base shear – global drift ratio relationship.
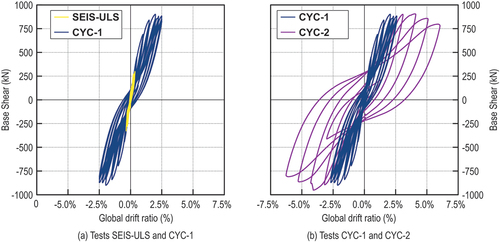
Table 1. Global response results.
4.3. Response of Slab-Column Connections
Using the shear force (V) and moment (M) values from the load cells installed at mid-story height of the columns, it is possible to calculate the unbalanced moment acting on each individual slab-column connection based on EquationEquation (1)(1)
(1) :
where index “1” indicates the load cell below the floor and “2” the load cell above the floor and H is the distance between the load cells, equal to story height.
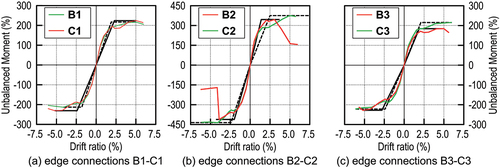
The unbalanced moments for the first story connections are plotted in for all twelve connections. As a reminder, the connections B1, C2 and C3 have been strengthened.
Figure 14. Unbalanced moment – story drift relationships.
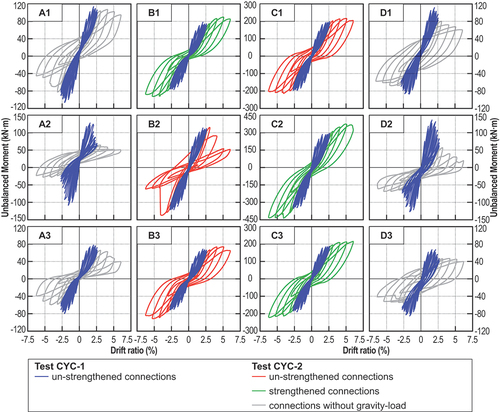
shows that the behavior of the strengthened internal connection C2 was significantly improved compared to the similar but unstrengthened connection B2 which started to degrade rapidly after the first cycles at 2.5% and 3%, whereas the strengthened connection C2 showed an increase in the unbalanced moment transfer capacity. Furthermore, the strengthened connection C2 was able to resist to the end of the test CYC-2, for nearly 6% inter-story drift, without a significant loss of the unbalanced moment capacity and no apparent failure, whereas connection B2 punched for a 4% inter-story drift ratio.
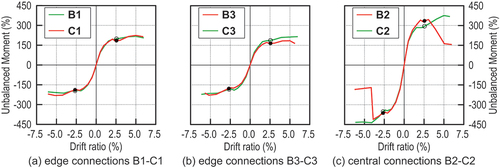
To compare the contribution of each connection towards the lateral seismic response, the unbalanced moment backbone curves for the connections at axes B and C are plotted on the same scale in . As expected, the unbalanced moments are higher at the internal connections than at the external connections. Comparing the strengthened C2 and un-strengthened B2 internal connections in , it can be observed that the initial stiffness and the behavior until punching of B2 at around 4% drift were similar. At failure of connection B2, the unbalanced moment dropped significantly while the moment in C2 slightly increased with no sign of damage. For the edge connections B1, C1, B3 and C3, the behavior with and without post-installed shear reinforcement was very similar, probably related to the fact that the un-strengthened connections did not punch, and the post-installed bolts are expected to be activated only after opening of the shear cracks. Sections 4.4 to 4.6 provide a more detailed analysis of the connections and a more thorough comparison between the strengthened connections and those that were not strengthened. Additional data regarding the deformation capacity of different connection types are reported in Muttoni et al. (Citation2022).
Figure 15. Unbalanced moment-story drift envelope curves; un-strengthened connection in red and strengthened connection in green, black dots separate test CYC-1 and CYC-2.
4.4. Ductility Analysis
Looking back at , it is observed that significantly nonlinear behavior with an almost plastic plateau started to occur for all the connections at about 1.5% drift. summarizes the maximum unbalance moments, the attained drift ratios and the estimated displacement ductility factors, µ. The latter is defined herein as the ratio between the displacement corresponding to the failure point, du, and the displacement at yielding dy, as follows:
Table 2. Maximum unbalanced moments, drift ratios and ductility ratios.
Displacements du and dy are determined from the envelope curve of the hysteresis loops (see ANNEX I). From and it can be concluded that the yield drift values are relatively high for the investigated slab-column connections (between 1.4% and 2.8%). The ductility ratio of connection B2 where punching occurred can be estimated between 2.17 and 2.64. For some edge connections with the edge parallel to the imposed displacement, significant drift ratios have been reached without failure (up to about 6%, which corresponds, compared to the nominal yield story drift of 2.1–2.4%, to ductility ratios larger than 2.5–2.9). Nonetheless, it is important to note that these relatively low values of the ductility ratio are calculated for a very high ultimate inter-story drift for the connections that did not fail (up to 6%, which is a value beyond practical limits for actual reinforced concrete buildings). For this reason, the ductility ratios discussed above are to be relativized since the expected energy dissipation during an actual earthquake is expected to be low.
No major and systematic changes in terms of ductility and yield drifts are observed by comparing connections where strengthening was applied with connections without strengthening, except for connection B2 where a punching shear failure was observed.
4.5. Evolution of Stiffness
The evolution of the secant stiffness calculated for each cycle is shown in for all the connections on axes B and C (strengthened and un-strengthened connections) relative to the initial stiffness. The initial stiffness was derived from the first cycle of phase CYC-1 for simplicity and greater reliability. Although the building was subjected to a pseudo-dynamic test before phase CYC-1, damage was quite limited at the beginning of CYC-1 (refer to Coronelli et al. (Citation2021)). For each cycle, the average secant stiffness for positive and negative drifts was considered.
Figure 16. Secant stiffness evolution: (a) internal connections; (b) edge connections.
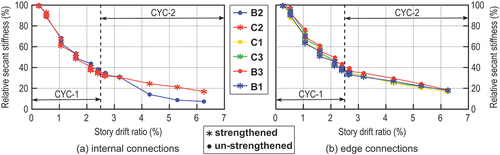
For phase CYC-1, the vertical steps in correspond to cycle repetitions (see ). Degradation occurred both during repetition of the drift cycles and excursion into greater drifts. An initial very steep stiffness decrease can be observed for small drifts. This evolution, related to the degradation of the slab-columns connections, is very similar to what has been previously observed on isolated slab-column connection tests (for example, refer to Isufi, Pinho Ramos, and Lúcio (Citation2020)). The degradation of all edge connections (B1 – B3 and C1 – C3) is similar (), whereas for the internal connection (see comparison B2 – C2, ), the relative stiffness differs after the failure of the un-strengthened connection (B2), but the initial phase was comparable.
4.6. Equivalent Viscous Damping
The equivalent viscous damping coefficient ξeq can be calculated for each cycle based on Hose and Seible (Citation1999), as follows:
where Ed1 and Ed2 are the areas enclosed by the curve for positive and negative displacements, whereas ES1 and ES2 are the elastic strain energies for positive and negative displacement, respectively. EquationEquation (3)(3)
(3) was applied to the base shear – global drift relationship () and the unbalanced moment – drift ratio loops () for internal connections and the results are presented in .
Figure 17. Equivalent viscous damping ratio for entire building, internal connections B2 and C2.
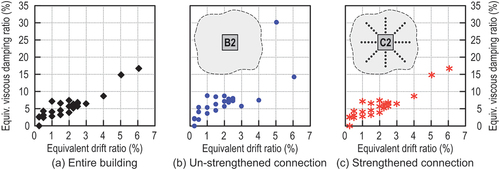
The results presented in are quite similar to results obtained in the past based on isolated specimens (for example, in Almeida et al. (Citation2020) for specimens with post-installed Isufi, Pinho Ramos, and Lúcio (Citation2019, Citation2020) for similar specimens but with headed studs). In similarity with the aforementioned studies, there is a decrease of the equivalent viscous damping ratio for repeated loading at the same drift level. The damping ratio is below 10% until the specimen reaches yielding, corresponding to the end of test CYC-1. The damping ratio is much higher during test CYC-2, for drifts above 2.5%, owing to the inelastic excursions and high level of damage in this phase. Although represents the entire building and represents only the internal connections, the trend in both figures is similar. Comparing the un-strengthened connection B2 with the strengthened connection C2 in , it can be noted that the damping ratios are comparable until 3% drift where connection B2 started degrading rapidly until it failed at 4% drift.
5. Conclusions
The performance of slab-column connections strengthened with bolts and the results of tests on a full-scale frame consisting of two flat slabs with cyclic loading are presented. The testing program included a cyclic test up to 2.5% drift ratio (tests CYC-1) carried out on the structure prior to strengthening and a cyclic test up to 6% drift ratio after strengthening (test CYC-2). This paper focuses on test CYC-2 and on the behavior of first floor internal slab-column connections and edge connections along the edges parallel to the direction of the imposed horizontal load since the remaining connections failed due to punching occurring already during tests CYC-1 and could not be repaired (the gravity load at these connections could still be carried). Strengthened and un-strengthened connections were compared.
The main conclusions are listed below.
The reported tests confirm that post-installed bolts are an effective solution for the strengthening of slab-column connections against punching when subjected to combined vertical and cyclic lateral loading. The strengthened internal connection C2 was able to reach a drift ratio of 6% (end of the test CYC-2) without a punching failure and without loss of unbalanced moment transfer capacity, whereas the comparable un-strengthened connection B2 failed at about 4% drift ratio. Measurements of the slab thickness increase indicate that diagonal cracking occurred in the strengthened connection but was effectively controlled by the post-installed reinforcement.
Integrity reinforcement consisting of longitudinal bars in the compression zone of the slab-column connections proved to be efficient in avoiding total collapse after punching. The gravity load could be sustained and the cyclic tests could be continued after failure of several edge, corner and internal columns.
Although the test phases before the cyclic loading tests CYC-2 had left the building significantly damaged, strengthening was successful in allowing the building to reach very high drifts (6%) without a global collapse and with a loss of the base shear less than 15% at the end of the test. The global lateral load capacity of the building was not significantly affected by punching in the un-strengthened internal connection since its load was redistributed on the adjacent columns.
The displacement ductility factors calculated for the connections of the first story for drift ratios up to 6% were below 3. Although not all the connections failed at 6% drift, the relatively low ductility factor up to this high drift ratio is the result of high yielding drift ratios (above 1.5%, related to the low stiffness of the slab-column frame).
It was shown that stiffness deterioration is similar for external (edge parallel to the horizontal loading direction) and internal connections as long as punching shear failure does not occur, with a rapid initial decrease and a slower rate of decrease for larger drifts. Internal connections are significantly stiffer than edge connections.
The use of post-installed bolts as strengthening technique is particularly attractive for the retrofitting of existing slabs with detailing much as that investigated. The effectiveness of the bolted reinforcement was demonstrated for the internal connections, while the results for the edge connections are not equally conclusive (the connections along the edges perpendicular to the horizontal load were not strengthened and the un-strengthened connections along the edges parallel to the horizontal load didn’t suffer severe damage). In an actual structure, the seismic action could include components parallel and perpendicular to all edges. Therefore, further investigation is required for edge connections, especially to avoid early damage. The system used in the presented tests could be effective for this purpose.
Acknowledgments
The SlabSTRESS (Slab Structural RESponse for Seismic European Design) experimental campaign is part of the Transnational Access activities of the SERA (Seismology and Earthquake Engineering Research Infrastructure Alliance for Europe) project. This project has received funding from the European Union’s Horizon 2020 research and innovation program under grant agreement No. 730900.
Disclosure Statement
No potential conflict of interest was reported by the author(s).
References
- Almeida, A. F. O., A. Pinho Ramos, V. Lúcio, and R. Marreiros. 2020. Behavior of RC flat slabs with shear bolts under reversed horizontal cyclic loading. Structural Concrete 21 (2): 501–16. doi:10.1002/suco.201900128.
- CEN. 2004a. EN 1992-1-1. Eurocode 2 — Design of concrete structures. Part 1-1: General rules and rules for buildings.
- CEN. 2004b. EN 1998-1. Eurocode 8: Design of structures for earthquake resistance - Part 1: General rules, seismic actions and rules for buildings.
- Coronelli, D., M. Lamperti Tornaghi, L. Martinelli, F.-J. Molina, A. Muttoni, I. Radu Pascu, P. Pegon, M. Peroni, A. P. Ramos, G. Tsionis, et al. 2021. Testing of a full-scale flat slab building for gravity and lateral loads. Engineering Structures 243 (May): 112551. doi:10.1016/j.engstruct.2021.112551.
- Coronelli, D., A. Muttoni, I. R. Pascu, A. P. Ramos, and T. Netti. 2020. A state of the art of flat‐slab frame tests for gravity and lateral loading. Structural Concrete 21 (6): 2764–81. doi:10.1002/suco.202000305.
- Einpaul, J., F. Brantschen, M. Fernández Ruiz, and A. Muttoni. 2016. Performance of punching shear reinforcement under gravity loading: Influence of type and detailing. ACI Structural Journal 113 (4): 827–38. doi:10.14359/51688630.
- El-Salakawy, E. F., M. A. Polak, and K. A. Soudki. 2003. New shear strengthening technique for concrete slab-column connections. ACI Structural Journal 100 (3): 297–304.
- Farhey, D. N., M. A. Adin, and D. Z. Yankelevsky. 1995. Repaired RC flat-slab-column subassemblages under lateral loading. Journal of Structural Engineering 121 (11): 1710–20. doi:10.1061/(ASCE)0733-9445(1995)121:11(1710).
- fib. 2013. Fib model code for concrete structures 2010. Fib Model code for concrete structures 2010. Weinheim, Germany: Wiley-VCH Verlag GmbH & Co. KGaA. doi:10.1002/9783433604090.
- Hose, Y. D., and F. Seible. 1999. Performance evaluation database for concrete bridge components and systems under simulated seismic loading. PEER report no. 1999/11. San Diego, California.
- Inácio, M. M. G., A. Pinho Ramos, and D. M. V. Faria. 2012. Strengthening of flat slabs with transverse reinforcement by introduction of steel bolts using different anchorage approaches. Engineering Structures 44: 63–77. doi:10.1016/j.engstruct.2012.05.043.
- Isufi, B., A. Pinho Ramos, and V. Lúcio. 2019. Reversed horizontal cyclic loading tests of flat slab specimens with studs as shear reinforcement. Structural Concrete 20 (1): 330–47. doi:10.1002/suco.201800128.
- Isufi, B., A. Pinho Ramos, and V. Lúcio. 2020. Post-earthquake performance of a slab-column connection with punching shear reinforcement. Journal of Earthquake Engineering (in Press) 00: 1–23. doi:10.1080/13632469.2020.1713924.
- Lapi, M., A. Pinho Ramos, and M. Orlando. 2019. Flat slab strengthening techniques against punching-shear. Engineering Structures 180: 160–80. doi:10.1016/j.engstruct.2018.11.033.
- Lawler, N., and M. A. Polak. 2011. Development of FRP shear bolts for punching shear retrofit of reinforced concrete slabs. Journal of Composites for Construction 15 (4): 591–601. doi:10.1061/(ASCE)CC.1943-5614.0000188.
- Muttoni, A., D. Coronelli, M. Lamperti Tornaghi, L. Martinelli, I. R. Pascu, A. Pinho Ramos, G. Tsionis, P. Bamonte, B. Isufi, and A. Setiawan. 2022. Deformation capacity evaluation for flat slab seismic design. Bulletin of earthquake engineering 20: 1619–1654. doi:10.1007/s10518-021-01302-x.
- Pan, A. D., and J. P. Moehle. 1992. An experimental study of slab-column connections. ACI Structural Journal 89 (6): 626–38. doi:10.14359/4133.
- Pegon, P., F. J. Molina, and G. Magonette. 2008. Continuous pseudo-dynamic testing at ELSA. In Hybrid simulation; theory, implementation and applications, ed. V. Saouma and M. Sivaselvan, 79–89. London: Taylor & Francis/Balkema.
- Ricardo, S., M. V. F. Duarte, A. Pinho Ramos, and M. Inácio. 2013. A physical approach for considering how anchorage head size influences the punching capacity of slabs strengthened with vertical steel bolts. Structural Concrete 14 (4): 389–400. doi:10.1002/suco.201200051.
- Robertson, I. N., and G. Johnson. 2004. Repair of slab-column connections using epoxy and carbon fiber reinforced polymer. Journal of Composites for Construction 8 (5): 376–83. doi:10.1061/(ASCE)1090-0268(2004)8:5(376).
- Ruiz, M. F., A. Muttoni, and J. Kunz. 2010. Strengthening of flat slabs against punching shear using post installed shear reinforcement. ACI Structural Journal 107 (4): 434–42.
- Topuzi, D., M.A. Polak, and S. Narasimhan. 2017. A new technique for the seismic retrofit of slab-column connections. ACI Structural Journal 114 (6): 1471–81. doi:10.14359/51689500.
- Wensheng, B., and M.A. Polak. 2009. Seismic retrofit of reinforced concrete slab-column connections using shear bolts. ACI Structural Journal 106 (4): 514–22. doi:10.14359/56617.
- Widianto, O. B., J. O. Jirsa, and Y. Tian. 2010. Seismic rehabilitation of slab-column connections. ACI Structural Journal 107 (2): 237–47. doi:10.14359/51663540.
Appendix A
The displacement corresponding to the failure point, du, is conventionally defined as the displacement corresponding to 15% drop in the capacity. If such a drop does not occur, du is taken herein equal to the maximum attained drift during the test. The yielding displacement is determined based on a bilinear elastic-perfectly plastic approximation of the experimental curves on the basis of equal areas under the curve, in similarity with Annex B.3 of EN 1998–1:2004 (CEN Citation2004b).
shows the ductility analysis for the strengthened (B1, C2, C3) and the un-strengthened (B3, B2, C1) connections. The idealized elasto-perfectly plastic force–displacement relationship is reported for each connection and if the failure condition is met, a red dotted line is plotted to indicate the failure force and the corresponding displacement.
Figure A1. Ductility analysis for strengthened and un-strengthened connections.