
ABSTRACT
This article explores and presents various statistics regarding permanent school exclusions in England. Publically available national data, e.g. Permanent and fixed-period exclusions in England (Department for Education, 2021a), are used to identify patterns and thus provide an overview of the number, profile and characteristics (considering variables such as gender, ethnicity) of the population of children and young people permanently excluded in England. The article does not seek to explain the trends, rather it presents them as a ‘where are we’ picture of permanent exclusions in England. It is important to have such an overview in order to contextualise the English education system and view the implications of policy for practice relating to exclusions as demonstrated through pupil numbers and proportionality. The analysis highlights issues of disproportionality and the characteristics of students permanently excluded as well as revealing the ‘under counting’ of those who are excluded. The discussion explores issues around disproportionality, relating these to broader educational issues. Suggestions are made as to how to accurately account for all children and young people who are permanently excluded or ‘off-rolled’.
Introduction
In this article, I explore and present various statistics relating to permanent exclusions in England, including both trends (patterns over time, 2013–2020) and snapshots (what the situation was in 2019 and 2021, accounting for pre and during pandemic statistics). The objective is to achieve an overview of the type of children and young people (CYP) being permanently excluded at the time of writing, as well as historic patterns. I do not seek to explain the trends but, rather, presents them as a ‘where are we’ picture of permanent exclusions in England. It presents the data in one place, beyond the Department for Education (DfE) collated data (e.g. DfE Citation2020, Citation2021a) which do not contain the level of data provided here. Publically available national data (aggregates of school and pupil level data) collated by the DfE help to explore patterns and reporting these data provides an overview of the number, profile and characteristics of CYP permanently excluded, highlighting issues of disproportionality. The article is designed to support other explorations of exclusion in England by providing data and rates.
The key terms here are used in English educational policy and are defined with reference to policy but also compared to similar terms in international settings. The article focuses on data related to permanent exclusions; ‘exclusion’ here is a disciplinary term (Hatton Citation2013), rather than an antonym of inclusion, and describes the formal and legislated process whereby a CYP is officially removed from education on school premises permanently. The CYP is ‘expelled’ (rather than suspended for a fixed period of time), termed ‘temporary/fixed term exclusion’ (UK Government, Citation2011)n.d.a.). A CYP cannot return to the school from which they are excluded. Whilst legislation and terms differ (excluded, expelled, suspended, expulsion), removal of a CYP from the school premises is a common disciplinary practice in many countries (Spink Citation2011). Statutory guidance from the Department for Education (the body responsible for education in England) states:
Permanent exclusion should only be used as a last resort, in response to a serious breach or persistent breaches of the school’s behaviour policy; and where allowing the pupil to remain in school would seriously harm the education or welfare of the pupil or others in the school. The decision to exclude a pupil must be lawful, reasonable and fair (DfE Citation2017, 6).
To set the scene, here are some recently reported figures on exclusion in England. ‘While permanent exclusion is a rare event – 0.1% (1 in 1,000) of the 8 million children in schools in England were permanently excluded in 2016/17 – this still means an average of 40 every day’ (DfE Citation2019, 5). McCluskey et al. (Citation2019) note that rates in England are higher than those of other nations within the UK. (Education policy is a devolved matter in Scotland, Wales and Northern Ireland, Black Citation2019).
In Scotland, […] official permanent exclusion reduced to an all-time low of just five cases in 2014/15. This is much lower than in Northern Ireland and Wales and in stark contrast to England, where exclusions have increased substantially since 2012 (McCluskey et al. Citation2019, 1140).
In this article, I present the data for exclusions in England, noting evidence of disproportionality (over or under representation of groups of particular characteristics, Dyson and Gallannaugh Citation2008). The characteristics explored occur at pupil-level (ethnicity, gender, special educational needs, socio-economic status) in addition to school-level category of school type.
Disproportionality related to the characteristics of CYP facing permanent exclusions has been evident in England and other international contexts, as shown in .
Table 1. ‘Risk factors’ for permanent exclusion.
In England, the Timpson Review of School Exclusion (DfE Citation2019) showed that, while the overall rate of exclusion in 2016/17 was 0.1% (1 in every 1,000), it varies by gender (0.35% of males compared to 0.04% of females), ethnicity, those from disadvantaged backgrounds (as measured by Free School Meals – 0.28%), CYP ‘in need’ (0.23%) and CYP with identified SEN at highest level of support (0.16%) and with lower levels of need/support (0.35%). categorises the characteristics into those below the national rate (less chance of being permanently excluded); around the national rate; and above the national rate (more chance of being permanently excluded) of 0.10%.
Table 2. Rates of exclusion by differing characteristics as reported by Timpson (DfE Citation2019).
In this article, these disparities are explored to establish whether they are evidenced in the most recent population data from the DfE in England. The aims of the article are:
To explore what government/DfE statistics are available on permanent exclusions from schools in England.
To describe patterns and rates of permanent exclusions over time.
To identify and present patterns and rates of permanent exclusions by key variables, such as age, gender, ethnicity.
Methods
As Black (Citation2019) reports, the Department for Education in England has legal powers to collect pupil, child and workforce data that schools and local authorities (LAs) hold. These data are used to assess school performance; publish Statistical First Releases; evaluate and inform educational policy; and assess funding to local authorities and schools (DfE Citation2018). The DfE collates these data on CYP on a range of variables and measures, and some are analysed and findings shared publically through documents entitled ‘Statistical First Release’ (e.g. DfE Citation2020) or ‘National Statistics Overviews’ (e.g. DfE Citation2021a). However, much of the data are held in files entitled ‘National Tables’ -Excel spreadsheets, or, since 2019, open-source data with the opportunity to produce customised tables with little analysis or qualitative description. This article collates, analyses and describes patterns in the data of interest regarding permanent exclusions. The data sets in some instances include data from previous years; hence, time series can be plotted. I use tables, graphs and descriptive summaries based on data collated by the DfE (Citation2020, Citation2021a) and UK Government (Citation2021) to create a descriptive picture of who permanent exclusion has effected in 2019, 2020 and over time (from the 2013/14 academic year). The data are at population level so no inferential statistical analysis is required to calculate significance; however, I use an odds ratio like Dyson and Gallannaugh (Citation2008), as well as presenting the raw data to meet the study aims. Time-series data are from the 2013/14 academic year (where available) to the 2019/20 academic year. It should be noted that the 2019/20 academic year was disrupted by the nationwide lockdown commencing in March 2020 during which schools remained open to vulnerable and disabled CYP or children of key-workers. In calculating odds ratios, I use the data for the last academic year without interruption (2019/20).
In order to illustrate disproportionality, beyond presenting proportions of CYP in different categories, I calculate an odds ratio, explore how much more (or less) likely an outcome (permanent exclusion) is for one group relative to a comparator group (Lindsay, Pather, and Strand Citation2006; DfE Citation2019). This approach is advocated by the UK Government’s Race Disparity group, explaining that calculation of odds ratios is a ‘technique of comparing two groups’ experiences of an outcome’ (UK Government Citation2020, section 4.6). In the case of permanent exclusion, the odds of exclusion for a given CYP are calculated by dividing their probability of being excluded by their probability of not being excluded, and the odds ratio is calculated by dividing the odds of exclusion for one group by the odds of exclusion with the comparator group. In a worked example given in the Timpson report:
[If] 20% of students in group X were excluded, 80% of students were not excluded so the odds of exclusion for group X would be 20% ÷ 80% = 0.25. If the odds of exclusion in group Y, a comparator group, were 0.1, then the odds ratio for group X compared to group Y would be 2.5 (because 0.25 ÷ 0.1 = 2.5). This shows that students in group X are more likely to be excluded than students in the comparison group (DfE Citation2019, 118).
An odds ratio greater than 1 means that members of the group are more likely to be excluded than the comparator group; a ratio less than 1 indicates group members are less likely to be excluded than the comparator group. As previously mentioned, this is population-level data and involves categorical variables (e.g. gender and excluded or not); thus, it is unnecessary to calculate significance. However, exploration of whether the odds ratio is notable in size is required; the Race Disparity Unit (UK Government Citation2020) suggests the application of the four-fifths rule, i.e. the odds ratios that are greater than 1.25 or less than 0.80 constitute noteworthy disparities.
Analysis is limited by the categories used by the DfE regarding characteristics of CYP, e.g. the permanent exclusion data do not distinguish other gender categories beyond male and female, and subject to UK government (UK Government,, Citationn.d.b.) categories in the annual school census. On ethnicity, government advice (UK government Citationn.d.b.) is that departments use five overall categories, subdivided into further sub-categories (see ). The DfE disaggregates two further ethnic categories from these in the school census; ‘there are separate categories for Traveller of Irish Heritage, and Gypsy and Roma pupils; the Chinese ethnic group has its own category, rather than being part of the Asian ethnic group’ (UK Government Citation2021). (This approach is later critiqued.)
Table 3. Ethnicity categories as used by DfE (UK Government Citation2021).
In English policy, the term ‘Special Educational Needs’ (SEN) is qualified as a characteristic that differs by degree (Liu et al. Citation2020). From 2015, all CYP with documented SEN have been placed into two categories: SEN Support, and Education, Health and Care plans (EHCPs):
Schools now identify the larger number of pupils as having SEN at what is called the SEN Support level for those with less severe difficulties, while local authorities identify the smaller number of pupils with more severe difficulties at what is called the EHCP level (Liu et al., p.537).
The latter is a legally based record of provision identified by a multi-professional team taking into account parental and CYP views. Prior to 2015, CYP with higher-level needs had a legally based record of provision or ‘statement’ and those with lower-level needs fell into two categories: School Action or School Action Plus. According to Lamb (Citation2019), this was intended in part to stop the conflation of SEN with CYP who had ‘simply fallen behind through poor teaching, […], and improve identification of SEN’ (p.8). The designated level of SEN used in DfE (Citation2021a) data and reported by schools in the annual census should be treated with caution; e.g. there is no record if a process of assessment required for an EHCP is underway; hence, a CYP on SEN support may have a similar level of needs to those with an EHCP, and even be on their way to achieving one, but are still recorded as SEN support.
The first research aim was not a quantitative study, rather it used the search facility on gov.uk (a repository of government-collected data) for the term ‘permanent exclusion’. Eighty-one matches were then filtered by selecting ‘research and statistics’, ‘policy papers and consultations’ and ‘transparency and freedom of information requests’ (thus omitting ‘services’, ‘guidance and regulation’, ‘news and communication’). This filtering produced 26 hits which were assessed for relevance, leaving 5 documents (recorded in and grouped by themes). Omitted documents or links were legislation (e.g. The School Discipline (Pupil Exclusions and Reviews) (England) Regulations Citation2012); statutory guidance (e.g. Changes to the school suspension and permanent exclusion process during the coronavirus (COVID-19) outbreak, DfE Citation2021c) and guidance to parents (School discipline and exclusions, UK Government Citationn.d.a.). Three English governmental reports, discovered through the general literature review when researching this article, are included.
Table 4. Government/DfE statistics publically available on permanent exclusions from schools in England (*An example is given of the data contained in one of the downloadable spreadsheets in ).
Table 5. Exploration of one underlying data file from permanent exclusions and suspensions in England: 2019 to 2020 (DfE Citation2021a).
Many of the items listed in that contain data present them as summaries. Only two (DfE Citation2021a; UK Government Citation2021) contain underlying data, as well as being the most up-to-date. It is for this reason that I use the data therein to meet the remaining aims of the article. I refer to several of the other documents in the introduction and discussion sections. Some were used when undertaking validity checks, ensuring that findings appeared reasonable in comparison to other reports.
In terms of ethics, this article is based on the secondary analysis of publically accessible data. ‘When working with secondary or documentary data, the sensitivity of the data, who created it, the intended audience of its creators, its original purpose and its intended uses in the research are all important considerations’ (BERA Citation2018, 11). The DfE (Citation2018) recognises that researchers may use the data, but that it aggregates data, with no personal identifiers. In places, I reproduce figures used by the DfE in their reporting of the statistics. Where these are reproduced they are cited appropriately.
Presentation of findings
Aim 1: To explore what government/DfE statistics are available on permanent exclusions from schools in England
shows results from the gov.uk website search. The table is ordered by themes: national statistics; reports (divided into specific/non-specific and distinguishing those with a specific focus on school exclusion and those with a broader focus); consultation documents. It gives the document title, dates covered by the analysis, brief description of sources and contents, and consideration of whether it contains statistical data, in addition to reporting what data is contained in the document/or webpage.
shows a snapshot of the data contained in one of the eight downloadable spreadsheets accessible from DfE (Citation2021a) to demonstrate how the data are presented.
Aim 2: To describe patterns and rates of permanent exclusions over time.
derives from the most recent iteration of the DfE (Citation2021a) annual reporting of exclusion data. The line marked by the circle () shows overall rates of permanent exclusion in England. It demonstrates that, following a slight rise in the proportion of CYP excluded overall in England between 2015/16 and 2016/17 (from 0.08% to 0.10%), the figures remained the same between 2016/17 and 2018/19 and then fell in 2019/20, most likely due to the effect of the national lockdown in England that started halfway through the academic year in March 2020.
Figure 1. Time series showing the percentage of CYP permanently excluded. Source: DfE (Citation2021a).
A noteworthy difference is between the three school types (primary, secondary and special); primary schools appear to exclude a smaller proportion of CYP (0.02% in 2015/16, 2018/19, and 2019/20; 0.03% in 2016/17 and 2017/18 with no fall in rates caused by the pandemic), whereas secondary schools, while following the national trend, have a much higher proportion of CYP excluded (0.17% in 2015/16, rising to 0.20% in the following 3 years, falling to 0.13% in 2019/20). What this DfE data does not show is patterns over a longer period. When data from two previous years’ () are considered, the rates of increase in exclusions in secondary schools are quite stark, from 0.13% in 2013/14 to a high of 0.20% in 18/19 ().
Figure 2. Extended time-series, shown proportion of exclusions from 2013/14 academic year to 2019/20 academic year.
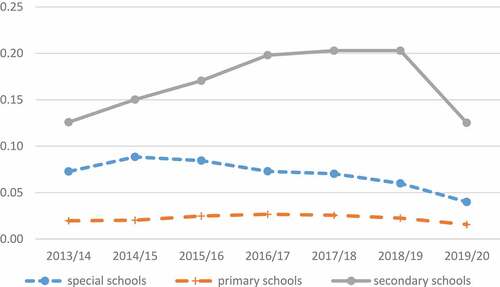
Permanent exclusions in special schools are closer to the national average, but show a downward trend from 2014/15 to 2019/20 (), from a proportion of 0.09% in 2014/15, 0.08% in 2015/16 to 0.07% in 2016/17 and 2017/18, 0.06% in 2018/19 and 0.04% in 2019/20. This is still higher than the proportion of excluded CYP in primary schools, demonstrating that the chances of being excluded from a special school are higher than from a primary school.
Figure 3. Time-series, shown proportion of exclusions from 2013/14 academic year to 2019/20 academic year in special and mainstream schools.
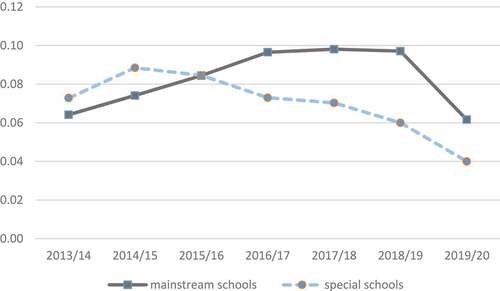
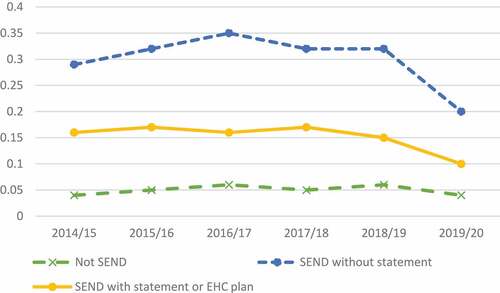
Figure 4. Time-series, showing proportion of exclusions from 2014/15 academic year to 2019/20 academic year by SEN status.
The data for primary and secondary school exclusions as shown in also act as a proxy for age. Whereas the levels of exclusion for primary aged CYP have remained relatively stable over time (although they have grown in terms of actual number of exclusions, this is mediated by population growth) the rates have risen from 0.13% of all secondary CYP excluded to 0.20% of all excluded (13 of 1,000, to 20 of 1,000). (It should be noted that CYP in special schools include both primary and secondary school aged CYP.)
Next, I explore the influence of SEN status on the proportion of CYP permanently excluded over time. One measure of the impact of SEN on exclusion data over time is comparing rates of exclusions in special schools compared to rates of exclusions in mainstream schools (primary and secondary schools together). shows that, while in 2013/14 and 14/15 the proportion of CYP excluded from special schools was higher than that of those excluded from mainstream schools, this switched in the 2016/17 academic year.
Attendance of a special school is not the only measure of SEN in England. demonstrates the influence of SEN status on the proportion of CYP permanently excluded and that the proportion of CYP excluded is higher for those with a category of SEN Support (School Action/School Action plus prior to 2015). The rate of CYP permanently excluded who had SEN support rose from 0.29% in 2013/14 to 0.35% in 2016/17. It then fell. However, the rate of permanent exclusions for this group of CYP during the national lockdown of 2019/20 (0.2%) still exceeded the previous rates of exclusion for the other groups.
Figure 5. Time-series, showing proportion of exclusions from 2014/15 academic year to 2019/20 academic year by gender.
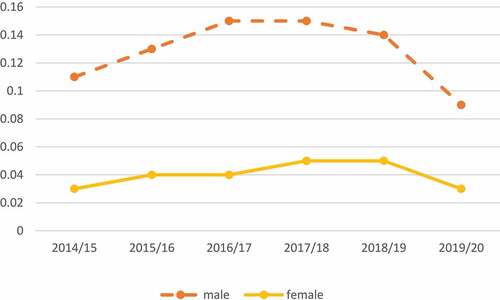
In terms of gender, rates of permanent exclusion for male CYP increased from 0.11% in 2014/15 until peaking at 0.15% in 2016/17 and 2017/18 and then gradually falling to 0.14% in 2018, with a large fall to 0.09% in 2019/20 (national lockdown). The rates for female CYP, while substantially lower, increased consistently from 0.03% in 2014/15 to 0.05% in 2017/18, 2019/19 and then fell to 0.03% in 2019/20.
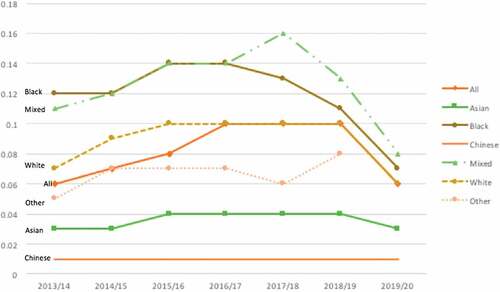
demonstrates variation in rates of permanent exclusion over time by ethnicity using broad categories, e.g. white/mixed. (No data is provided by the DfE (Citation2021a) for the ‘other’ category of ethnicity for 2019/20 so this has been left blank.) It shows that CYP with mixed heritage or from a black background consistently have higher rates of permanent exclusion than other groups, but there is also evidence of rates falling, even prior to the impact of Covid-19. Chinese and Asian CYP have the lowest rates of exclusion over time and are less prone to variation than other ethnic groups.
Figure 6. Time-series, showing proportion of exclusions from 2013/14 academic year to 2019/20 academic year by ethnicity.
Aim 3: present key variables, such as age, gender, ethnicity, in rates of exclusion
The article thus far has shown the influence of time on a range of variables. Moving on to the most recent data for selected characteristics of CYP in the latest academic year that was unaffected by the pandemic (2018/19) and reporting the odds ratio as a measure of comparison, the total number of exclusions in 2018/2019 was 7894 of a school aged population of 8,179,491 (8.18 million). In the 2019/20 academic year, this fell to 5,057 despite a population rise to of 8,255,046 (8.26 million). The overall rate of exclusion as a proportion of whole-school population was 0.10% (1 in 1,000) in 2018/19, falling to 0.06% (6 in 10,000) in 2020/21.
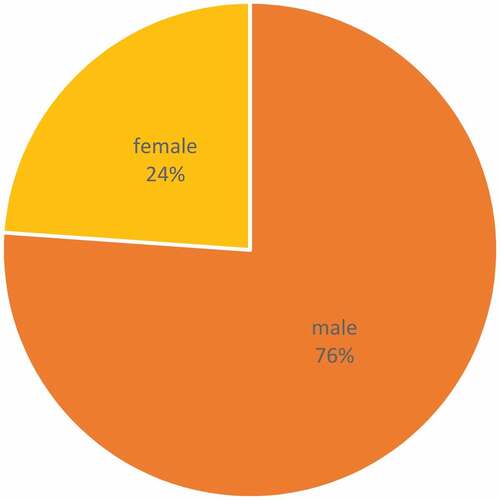
shows the influence of gender on rates of permanent exclusion. In 2018/19, of the 7894 CYP excluded, 76% were male, at a rate of 0.14% of the total male population, compared to 0.05% of girls. As an odds ratio, with girls as a comparator group, boys were 2.8 times more likely than girls to be excluded in the 2018/19 academic year. Despite the rates of permanent exclusion for both genders falling in 2019/20 (0.09% of all males and 0.03% of all females), the proportion of permanent exclusions broken down by gender fell slightly for girls (from 24% to 23%) with a corresponding increase in the proportion of those permanently excluded being male.
Figure 7. Rates of permanent exclusion by gender, 2018/19.
) show the SEN status of all CYP (8a) and the proportion of those permanently excluded (8b). A noteworthy difference is between the proportion of CYP with a lower level of SEN (no statement or EHCP) of all CYP (12%) and the proportion of that same group of CYP of those permanently excluded (39%). In 2018/19, the odds of exclusion for a CYP with SEN but not a statement or EHCP is 5.3 times more likely than a CYP with no SEN. This has fallen from a likelihood of 7.3 in 2014. A CYP with a statement or EHCP is 2.5 times as likely than a CYP with no SEN to be excluded.
Figures 8. 8a: SEN status of all CYP; 8b SEN status of CYP permanently excluded.
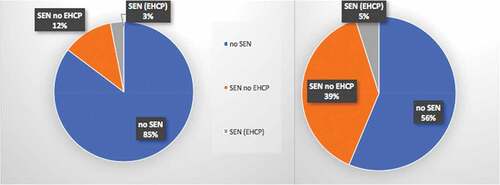
In the 2019/20 academic year, while the rates of exclusion fell from the previous year for all groups, the proportion in each category permanently excluded increased slightly in the SEN without statement or EHCP group (from 39% to 40%), with a corresponding fall in the no SEN category.
In terms of ethnicity, gives the odds ratio of the different ethnic groups, as compared to a comparison group which in this case was the White British group. Only two did not meet the four-fifths rule, and thus the disparities between these and the comparator groups are not notable (Mixed: White and Black African; Mixed: any other mixed background). The remaining categories have a noteworthy odds ratio, although also indicates three ethnicities where concern should be taken due to small numbers.
Table 6. Odds ratio of permanent exclusion by ethnicity in 2018/19 academic year (comparison group: White British CYP).
For some groups of CYP, the analysis finds that their likelihood of exclusion remains higher than for White British CYP: Gypsy Roma CYP (3.77x more likely than white British peers); Traveller of Irish heritage (2.59x more likely); Black Caribbean (2.41x more likely); Mixed White and Black Caribbean (2.28x more likely); ‘Unclassified’ CYP (1.59x more likely); and Black: Any other Black background (1.24x more likely).
For other CYP groups, the analysis finds their likelihood of permanent exclusion is less than that for White British CYP: Chinese CYP are least likely to be excluded when compared to other groups (caution needed due to small numbers permanently excluded); followed by Indian; Any Other Asian background; Bangladeshi; any other White background; Pakistani; Irish; Black African; any other ethnic group and Mixed: White and Asian.
As a proxy for age, in 2018/19, 0.023% of primary school CYP were permanently excluded (2 of 10,000) and 0.20% of secondary CYP were permanently excluded (20 of 10,000 or 2 of 1,000). In the 2019/20 academic year, this remained at the same rate for primary school CYP, falling to a rate of 0.13% for secondary school CYP.
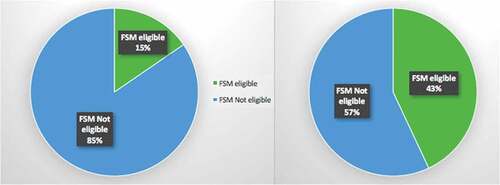
The final exploration is of Free School Meals (FSM) that acts as a proxy for Socio-Economic Status. ) show that, while CYP entitled to FSM in 2018/19 accounted for 15% of overall school population (9a), they accounted for 43% of all permanent exclusions (9b). The odds of being permanently excluded for a CYP eligible for FSM was 4.5 times more likely that of a CYP not eligible for FSMs. In 2018/19, the rate of permanent exclusion for CYP eligible for FSM and not eligible for FSM was 0.27% and 0.06%, respectively. These both dropped in the 2019/20 academic year, CYP on FSM to 0.16% and those not to 0.04%.
Figure 9. 9a: FSM status of all CYP; 9b FSM status of CYP permanently excluded.
Discussion and conclusion
Results shown here reinforce concerns around disproportional permanent exclusion in England, showing a range of disproportionality regarding characteristics of CYP and permanent exclusions and matching those found in the literature (); gender, age, FSM eligibility, school type, SEN and ethnicity all influence the chances of permanent exclusion. The discussion below relates these findings to the broader literature and suggests that a broader lens is required when exploring exclusions, both in terms of interactive effects of ‘vulnerabilities’ of CYP that may influence the chance of permanent exclusion, and defining permanent exclusion.
The findings may be unsurprising as disproportionality is purportedly rife in the English education system (Strand and Lindsay Citation2009). In the area of SEN, there are associations between age and school placement (Black Citation2018, Citation2019; Strand and Lindsay Citation2009), ethnicity and SEN (Strand and Lindorff Citation2018; Lindsay, Pather, and Strand Citation2006) and socio-economic status and SEN (Liu et al., Citation2020). Lamb (Citation2019) argues that failure to support schools’ capacity to manage SEN is evidenced in the higher proportion of exclusions of CYP with SEN than any other category of CYP. Permanent exclusion rates for those with EHCPs are approximately half the rate of those on SEN Support (Lamb, Citation2019), possibly as schools are required to avoid permanent exclusion of those with EHCPs. The association between SEN and permanent exclusion could be higher as there may be an unreported association between not having an identification of SEN and chances of permanent exclusion.
Another area of disproportionality by different CYP characteristics is attainment. An attainment gap exists in England related to ethnicity, age, SEN and socio-economic status (Hutchinson, Reader, and Akhal Citation2020), in addition to gender (Leckie and Goldstein Citation2019).
Pupils from Gypsy/Roma, Traveller of Irish Heritage, Black Caribbean, and White and Black Caribbean, Other Black Backgrounds, Pakistani, Any Other White Backgrounds, and Any Other Ethnic Backgrounds score lower on average than their White British peers. The gap is particularly large for Gypsy/Roma pupils, who are nearly three years behind by the end of secondary school, and Traveller of Irish Heritage pupils, who are two years behind (Hutchinson, Reader, and Akhal Citation2020, 18).
As shown earlier, some of the same groups are over-represented in the exclusion data; thus, a link between exclusion and attainment may exist and requires investigation. Strand and Fletcher (Citation2011) found a strong relationship between CYPs’ end of primary school attainment score and average number of fixed term exclusions. The Timpson Review (DfE Citation2019) recommends that ‘schools [should be made] responsible for the children they exclude and accountable for their educational outcomes’ (p.14). In 2021, the UK’s Commission on Race and Ethnic Disparities, while recognising that certain ethnic groups are disproportionately affected by higher rates of exclusion, reported that they ‘believe the causes for ethnic disparities in the rates of exclusions and suspensions are complex and multifaceted, and cannot be reduced to structural racism and individual teacher bias’ (Sewell, Aderin-Pocock, and Chughtai Citation2021, 79). They note that CYP with SEN are more likely to be excluded and make links to ‘the ethnic disproportionality in the identification of SEN’ (p.79). The data in this article show that CYP with SEN appear most likely to be excluded; however, as McCluskey et al. (Citation2019) argue, some CYP with SEN experience a ‘layering of disadvantage’ (p.1156), e.g. being more likely than peers to live in poverty. Rizvi (Citation2017) adds context as another dimension influencing exclusion rates: ‘ethnic-minority experiences [of disability] are contextually different from White British disabled families’ (p.88). This layering of disadvantage highlights an interactive effect between vulnerabilities (Gill, Quilter-Pinner, and Swift Citation2017).
What the data as presented conceal is the potential influence of intersectionality on exclusion rates. I did not set out to run logistic regressions to identify or control for particular variables but an advantage of such an approach is verification of whether differences seen according to CYP characteristics are ‘actually associated with a single characteristic or [whether they might be influenced by] a combination of a number of characteristics’ (Department for Education (DfE) Citation2012, 39). In future studies, beyond isolation of the association between likelihood of exclusion and particular characteristics and controlling for other factors as reported in Timpson (DfE Citation2019), a more complex analysis could identify factors that may act collectively to increase the likelihood of exclusion.
Although I have focused on variation in rates of exclusion by characteristics of CYP, the Timpson report (DfE Citation2019) demonstrated that there was some variance by school type beyond the distinction of special, mainstream primary and mainstream secondary. The DfE has adopted a policy of reforms aimed at increasing school autonomy through the introduction of more autonomous state-funded schools (academies) (Liu et al. Citation2020). When profiling rates of permanent exclusions, the Department for Education (DfE) (Citation2012) noted that ‘the average permanent exclusion rate for Academies was slightly higher than for the comparator schools, with exclusion rates of 0.32% and 0.25% respectively’ (p.48). However, this pre-dated the introduction of two academy types: higher-attaining schools encouraged to convert to academies and self-govern (converter academies), and schools required to become academies (due to poor performance) under the control of external sponsors (sponsored academies) (Liu et al. Citation2020, 536). Timpson (DfE Citation2019) reported that secondary sponsored academies in 2016/17 had an exclusion rate of 0.36% compared with 0.21% in maintained schools and 0.14% in converter academies, while Liu et al. (Citation2020) found effects on the educational trajectories of CYP with SEN when converting English schools to academies. Sponsored academies ‘were more likely to decrease the proportion of pupils with SEN and remove additional support for them’ (p.532). One mechanism for this could be permanent exclusions. It is likely that pupil-level analysis, as used by Liu et al. (construction of longitudinal pupil-level files for each school cohort to track each CYP’s journey through schools and a longitudinal school-level sample of aggregate measures to compare CYPs’ trajectories and school types) would be necessary to explore the influence of academisation on permanent exclusion rates.
Variation may occur at Local Authority (LA) level as demonstrated by the DfE (Citation2021a) table of permanent exclusion rates by LA, but variation also occurs in rates of exclusion by ethnicity (UK Government Citation2021); e.g. the rate of exclusions for CYP in the Black census category by LA ranged from 0.00% to 1.03%. Black and Norwich (Citation2014, Citation2019) have shown variation by LA in rates of segregation into special schools of CYP with EHCPs or statements, reporting that some LAs rely more on mainstream settings while others send high proportions of CYP to special schools. Variation of characteristics of CYP at an LA level and the impact on rates of exclusion demands further examination.
The permanent exclusions discussed here involving formal procedures are only part of the story. McCluskey et al. (Citation2019) distinguish between legal and illegal exclusions, the latter involving ‘off-the-record’, informal or ‘under-the-radar’ exclusions’ (p.1141). Hallett and Hallett (Citation2021) state that there are ‘more informal, practices that contribute to the total number of children and young people who are not in school at some point in their school journey’ (p.1); for example, off-rolling; ‘managed moves’ between schools and into different types of provision or even into the criminal justice system (Gyateng et al. Citation2014). ‘Off-rolling’ is defined by the school inspectorate for England as the removal of a pupil from a school roll ‘without a formal, permanent exclusion or by encouraging a parent to remove their child from the school roll, when the removal is primarily in the interests of the school rather than in the best interests of the pupil’ (OfSTED, Citation2018, p.50). Bradbury (Citation2018) has shown that the proportion of all CYP in Year 10 who do not progress to year 11 in the same state school, or to a different state-funded school, is 2% (approximately 9,500 CYP). While some of the CYP may have moved to an independent school or homeschooling, some may have ‘ended up in a unregistered school or dropped out of education entirely’ (para. 2).
Done and Knowler (Citation2020) critique the focus on ‘off-rolling’ and associated narrow definition, arguing that this ‘serves to obscure the varied nature of exclusionary practices (formal and otherwise) within the neoliberal English educational system and the persistent systemic inequities’ (p.2), thereby sidelining other exclusionary practices. Hence, although permanent exclusion disproportionally affects boys, Boddington (Citation2020) argues that ‘girls are being disproportionately excluded in distinct ways, which are both less formalised and less visible’ and that ‘rates of unofficial school moves and early exits [are] significantly higher for girls than boys’ with girls being ‘almost twice as likely as boys to experience a school change’ (para. 10).
I recommend that the DfE requires schools to record CYP leaving schools outside of normal transition points so analysis of disproportionality by CYP characteristics can occur. As Boddington (Citation2020) maintains, the DfE should improve data collection on ‘unofficial’ forms of exclusion including managed moves; unofficial school moves; home education; off-rolling; persistent absence.
Additionally, a more qualitative approach could be adopted in future research into disproportionality, e.g. engaging with CYP who have left schools outside of normal transition points (and/or their parents or carers) to explore reasons for leaving and destinations. This would not provide a complete understanding of exclusionary practices, but it would ensure more detail than is currently held.
On the limitations of this study and the underlying data, while data on permanent exclusions sorted by a range of characteristics of CYP is available on DfE statistical links and interactivity introduced in the 2018/19 report permits the creation of basic tables, shows the complexity of the underlying data. I have established the validity of my data with comparisons to previous years/other sources, but I would recommend the use of more advanced statistical analysis software to allow for more nuanced analysis. The data are aggregate data, and although this is useful in providing basic description such as that illustrated in this article, pupil-level data would enable the impact of certain characteristics on trajectories towards permanent exclusion as undertaken by Liu et al. (Citation2020) who used pupil-level data to measure the impact of academisation on CYPs’ SEN status.
The data provided by the DfE are limited in several ways. The age of the cohort under investigation is often not provided. Hence, when reporting the total number of exclusions, it is not stated whether it is all CYP of school age who are excluded (school-leaving age for England is 19) or all aged 5–16. CYP aged 19+ still have provision under the SEN Code of Practice (Department for Education/Department of Health Citation2015), so are these part of the aggregate data? In some reports and tables, the underlying denominator is not always reported, i.e. rates and numbers of CYP in particular characteristics are reported but it is not apparent what the total population of CYP for that category is. Prior to 2018/19, the data were published along with pdf summaries and aggregated data sorted by a range of characteristics were provided in spreadsheet summaries. While the ability to create tables with reference to specific variables of reference is useful, I would suggest that similar data or spreadsheet summaries to these be created for 2018/19 and all future iterations to allow better direct comparison with previous years.
Finally, there are concerns regarding some categories used by the DfE in its data collection. An example is gender – data provided by the DfE do not currently report on instances of exclusion by genders other than male or female. Boddington (Citation2020) argues that there must be consideration of experiences of non-binary and transgender pupils. I also recommend data collection and analysis in this area. Similarly, the source of data that schools use to complete their annual census returns should be clarified; is it CYP self-reporting, from school staff or admission records completed by parents. Additionally, what (if any) mechanisms exist for CYP and parents to change the data on their records? Parameshwaran and Engzell (Citation2015) note that census categories in England tend to offer ‘response options mostly connected to the waves of post-war migration [to England]’ (p.403), and that such classifications may be unsuited in cases when national origin and ethnicity do not overlap, or when several generations have passed since immigration occurred. Groupings such as ‘Black African’ or ‘other white’ are heterogeneous and a more detailed understanding of groups within these categories should be considered.
A similar point could be made about grouping by level of SEN. As mentioned above, in English policy SEN is qualified as a characteristic that differs by degree (Liu et al. Citation2020), with CYP with SEN being recorded as falling into one of the two categories: SEN Support; or EHCPs. Use of these two labels could be seen as implying that children with SEN are homogenous, and vary only by degree of severity, which is not the case (Squires et al. Citation2012). Categorical data are also collected from schools, placing the CYP labelled with SEN into one of the four ‘broad areas of need’: communication and interaction; cognition and learning; social and mental health needs (Department for Education/Department of Health Citation2015, 85), some of which are broken down further with varying levels of specificity (e.g. Autistic Spectrum Disorders; Specific Learning Difficulties). However, these are potentially flawed as a measure as a number of them are subjective, applied at a school level, with no cross-coder reliability checks (Demetriou Citation2020; Galloway, Armstrong, and Tomlinson Citation2013), and there is significant movement between these categories of SEN at an individual pupil level (Meschi et al. Citation2012). Examining exclusion patterns for CYP identified with different areas of need could be an area for future research, however this could be presented along with a measure of the reliability of the labels by exploring change over a CYP’s educational journey.
Numeric results like those presented here ‘cannot distinguish between reasons for a difference, they can only be used to argue that one exists’ (Hinton Citation1995, 20). There is a need to go beyond the numbers and examine practice and the enactment of policy at national and local levels to enable fuller interpretation of the data (Florian et al. Citation2004). This article has offered a baseline for further research into rates of permanent exclusions in England, by characteristics, and it provides a check on information that already exists and signposting to underlying datasets. It could also be used as context and data for England in any international comparative studies of permanent exclusions.
Disclosure statement
The author does not have any conflict of interest to disclose.
Additional information
Notes on contributors
Alison Black
Alison Black is a senior lecturer and researcher at the University of Exeter, she has also taught in primary and secondary schools. She is part of the Special Educational Needs and Disabilities Research Centre in the Graduate School of Education. She is proficient in methods that require elements of statistical analysis and measurement/comparison of variables, publishing overviews of national data relating to Special Educational Needs; the impact of academisation on numbers of pupils with SEN; and the influence of age on placement in special schools.
References
- BERA. 2018. Ethical Guidelines for Educational Research 4th Ed. London: British Educational Research Association.
- Black, A., and B. Norwich. 2014. Contrasting Responses to Diversity: School Placement Trends 2007-2013 for All Local Authorities in England. Bristol: CSIE.
- Black, A. 2018. “Future Secondary Schools for Diversity: Where are We Now and Where Could We Be?” Review of Education 7 (1): 36–87. doi:10.1002/rev3.3124.
- Black, A., and B. Norwich. 2019. Contrasting Responses to Diversity: School Placement Trends 2014-2017 for All Local Authorities in England. Bristol: CSIE.
- Black, A. 2019. “A Picture of Special Educational Needs in England–an Overview.” Frontiers in Education 4 (79): 1–10. doi:10.3389/feduc.2019.00079.
- Boddington, L. (2020, July). “Invisible Girls: Why School Exclusions are Not Gender Neutral.” Social Finance. https://medium.com/social-finance-uk/invisible-girls-why-school-exclusions-are-not-gender-neutral-fa732d64c1a9
- Bradbury, J. (2018). “Off-rolling: Using Data to See a Fuller Picture.” Ofsted blog: Schools, early years, further education and skills. https://educationinspection.blog.gov.uk/2018/06/26/off-rolling-using-data-to-see-a-fuller-picture/
- Daniels, H., and T. Cole. 2010. “Exclusion from School: Short‐term Setback or a Long Term of Difficulties?” European Journal of Special Needs Education 25 (2): 115–130. doi:10.1080/08856251003658652.
- Demetriou, K. 2020. “Special Educational Needs Categorisation Systems: To Be Labelled or Not?” International Journal of Disability, Development and Education 1–23.
- Department for Education (DfE). 2012. A Profile of Pupil Exclusions in England. DFE-RR190. London: DfE.
- Department for Education/Department of Health (2015). Special Educational Needs and Disability: Code of Practice. https://assets.publishing.service.gov.uk/government/uploads/system/uploads/attachment_data/file/398815/SEND_Code_of_Practice_January_2015.pdf
- DfE. 2017. Exclusion from Maintained Schools, Academies and Pupil Referral Units in England: A Guide for Those with Legal Responsibilities in Relation to Exclusion. London: DfE.
- DfE. (2018). Data Protection: How We Share Pupil and Workforce Data. https://www.gov.uk/guidance/data-protection-how-we-collect-and-share-research-data
- DfE. 2019. Timpson Review of School Exclusion. London: Department for Education and Race Disparity Unit.
- DfE. (2020). Schools, pupils and their characteristics: January 2020. https://www.gov.uk/government/statistics/schools-pupils-and-their-characteristics-january-2020
- DfE. (2021a). “Permanent Exclusions and Suspensions in England: Academic Year 2019/20.” https://explore-education-statistics.service.gov.uk/find-statistics/permanent-and-fixed-period-exclusions-in-england/2019-20
- DfE. (2021b). Behaviour management strategies, in-school units and managed moves: call for evidence. https://www.gov.uk/government/consultations/behaviour-management-strategies-in-school-units-and-managed-moves-call-for-evidence
- DfE. (2021c). Changes to the school suspension and permanent exclusion process during the coronavirus (COVID-19) outbreak. https://www.gov.uk/government/publications/school-exclusion/changes-to-the-school-exclusion-process-during-the-coronavirus-outbreak
- Done, E. J., and H. Knowler. 2020. “A Tension between Rationalities: “off-rolling” as Gaming and the Implications for Head Teachers and the Inclusion Agenda.” Educational Review 1–20. doi:10.1080/00131911.2020.1806785.
- Dyson, A., and F. Gallannaugh. 2008. “Disproportionality in Special Needs Education in England.” Journal of Special Education 42 (1): 36–46. doi:10.1177/0022466907313607.
- Florian, L., M. Rouse, K. Black-Hawkins, and S. Jull. 2004. “What Can National Data Sets Tell Us about Inclusion and Pupils’ Achievement?” British Journal of Special Education 31 (3): 115–120. doi:10.1111/j.0952-3383.2004.00341.x.
- Galloway, D. M., D. Armstrong, and S. Tomlinson. 2013. The Assessment of Special Educational Needs: Whose Problem? London: Routledge.
- Gill, K., H. Quilter-Pinner, and D. Swift (2017). “Making the Difference: Breaking the Link between School Exclusion and Social Exclusion.” Institute for Public Policy Research. https://www.ippr.org/files/2017-10/making-the-difference-report-october-2017.pdf
- Gyateng, T., A. Moretti, T. May, and P. J. Turnbull (2014). “Young People and the Secure Estate: Needs and Interventions.” Project Report. Youth Justice Board.
- Hallett, F., and G. Hallett. 2021. “Disciplinary Exclusion: Wicked Problems in Wicked Settings.” Journal of Research in Special Educational Needs 21 (SI): 8–16. doi:10.1111/1471-3802.12541.
- Hatton, L. 2013. “Disciplinary Exclusion: The Influence of School Ethos.” Emotional and Behavioural Difficulties 18 (2): 155–178. doi:10.1080/13632752.2012.726323.
- Hinton, P. 1995. Statistics Explained: A Guide for Social Science Students. London: Routledge.
- Hutchinson, J., M. Reader, and A. Akhal (2020). “Education in England: Annual Report 2020.” Education Policy Institute.
- Lamb, B. 2019. “Statutory Assessment for Special Educational Needs and the Warnock Report; the First 40 Years.” Frontiers in Education 4. doi:10.3389/feduc.2019.00051.
- Leckie, G., and H. Goldstein. 2019. “The Importance of Adjusting for Pupil Background in School Value‐added Models: A Study of Progress 8 and School Accountability in England.” British Educational Research Journal 45 (3): 518–537. doi:10.1002/berj.3511.
- Lindsay, G., S. Pather, and S. Strand (2006). “Special Educational Needs and Ethnicity: Issues of Over- and Under-Representations (Research Report RR757).” Department for Education and Skills.
- Liu, Y., A. Bessudnov, A. Black, and B. Norwich. 2020. “School Autonomy and Educational Inclusion of Children with Special Needs: Evidence from England.” British Educational Research Journal 46 (3): 532–552. doi:10.1002/berj.3593.
- McCluskey, G., T. Cole, H. Daniels, I. Thompson, and A. Tawell. 2019. “Exclusion from School in Scotland and across the UK: Contrasts and Questions.” British Educational Research Journal 45 (6): 1140–1159. doi:10.1002/berj.3555.
- Meschi, E., J. Mickelwright, A. Vignoles, and G. Lindsay. 2012. The Transition between Categories of Special Educational Needs of Pupils with Speech, Language and Communication Needs and Autism Spectrum Disorder as They Progress through the Education System. London: DfE.
- OfSTED. (2018). “The Annual Report of Her Majesty’s Chief Inspector of Education.” Children’s Services and Skills 2017/18. https://www.gov.uk/government/publications/ofsted-annual-report-201718-education-childrens-services-and-skills
- OfSTED. (2021). SEND: old issues, new issues, next steps. https://www.gov.uk/government/publications/send-old-issues-new-issues-next-steps/send-old-issues-new-issues-next-steps
- Parameshwaran, M., and P. Engzell. 2015. “Ethnicity in England: What Parents’ Country of Birth Can and Can’t Tell Us about Their Children’s Ethnic Identification.” Journal of Ethnic and Migration Studies 41 (3): 399–424. doi:10.1080/1369183X.2014.920690.
- Rizvi, S. 2017. “Exploring British Pakistani Mothers’ Perception of Their Child with Disability: Insights from a UK Context.” Journal of Research in Special Educational Needs 17 (2): 87–97. doi:10.1111/1471-3802.12111.
- Sewell, T., M. Aderin-Pocock, and A. Chughtai (2021). “Commission on Race and Ethnic Disparities: The Report.” Commission on Race and Ethnic Disparities.
- Spink, L. (2011). Disciplinary exclusion: The impact of intervention and influence of school ethos Doctoral dissertation, Newcastle University).
- Squires, G., N. Humphrey, A. Barlow, and M. Wigelsworth. 2012. “The Identification of Special Educational Needs and the Month of Birth: Differential Effects of Category of Need and Level of Assessment.” European Journal of Special Needs Education 27 (4): 469–481. doi:10.1080/08856257.2012.711961.
- Strand, S., and G. Lindsay. 2009. “Evidence of Ethnic Disproportionality in Special Education in an English Population.” Journal of Special Education 43 (3): 174–190. doi:10.1177/0022466908320461.
- Strand, S., and J. Fletcher. 2011. A Quantitative Longitudinal Analysis of Exclusions from English Secondary Schools. Oxford: University of Oxford.
- Strand, S., and A. Lindorff (2018). “Ethnic Disproportionality in the Identification of Special Educational Needs (SEN) in England: Extent, Causes and Consequences.” http://www.education.ox.ac.uk/wp-content/uploads/2018/12/Combined-Report_2018-12-20.pdf
- The School Discipline (Pupil Exclusions and Reviews) (England) Regulations 2012
- UK Government, (2020, August). Using relative likelihoods to compare ethnic disparities. https://www.gov.uk/government/publications/using-relative-likelihoods-to-compare-ethnic-disparities/using-relative-likelihoods-to-compare-ethnic-disparities
- UK Government, (2021, April). Permanent exclusions. https://www.ethnicity-facts-figures.service.gov.uk/education-skills-and-training/absence-and-exclusions/permanent-exclusions/latest
- UK Government, (n.d.a.). School discipline and exclusions. https://www.gov.uk/school-discipline-exclusions/exclusions
- UK Government, (n.d.b.) List of ethnic groups. https://www.ethnicity-facts-figures.service.gov.uk/style-guide/ethnic-groups
- Valdebenito,S., M. Eisner, D. P. Farrington, M. M. Ttofi, and A. Sutherland. 2019. “What Can We Do to Reduce Disciplinary School Exclusion? A Systematic Review and meta-analysis.” Journal of Experimental Criminology 15 (3): 253–287. doi:10.1007/s11292-018-09351-0.