
 ?Mathematical formulae have been encoded as MathML and are displayed in this HTML version using MathJax in order to improve their display. Uncheck the box to turn MathJax off. This feature requires Javascript. Click on a formula to zoom.
ABSTRACT
The number of young people who are not in education, employment or training (NEET) is a key indicator on the state of youth labour markets and opportunities for young people more generally. However, it is a diverse group as people can be NEET for many reasons, and so understanding the importance of these reasons is crucial for targeting policy responses. This paper looks at data on young people between the age of 16 and 29 in the UK between 1975 and 2015, and highlights which characteristics are associated with a higher chance of being NEET and how the importance of these drivers has changed over time. We show that the overall NEET rate has fallen considerably since the 1980s, but has remained largely the same since 2000. Since the 1980s, the reduction in school leavers leaving with few or no qualifications, fewer young people having children and improvements in the chances for young women to work alongside childcare responsibilities have all put a downward pressure on NEET rates. However, penalties for women with childcare are still large, while an increase in the incidence of mental ill health has recently acted in the opposite direction.
1 Introduction
The number of young people who are not in education, employment or training – NEET, as this group has become widely known as – is a key indicator on the state of youth labour markets and opportunities for young people more generally. The persistence and, in the years following the global financial crisis, growth of this group of young people is a major concern for policy makers in Europe (O’Reilly et al. Citation2015), not least because of fears that periods of unemployment or inactivity early in the working life incur longer term economic and social consequences. These consequences include lower future earnings (Gregg and Tominey Citation2005; Ralston et al. Citation2016), higher chances of being unemployed and dependent on welfare benefits in the future (Kelly and McGuinness Citation2015; Gregg Citation2001; Arulampalam et al., Citation2000; ACEVO Citation2012), and other well-being and health outcomes (Bell and Blanchflower Citation2011; Gutiérrez-García et al. Citation2017).
Interest in the NEET group originated in the UK in 1988, as a way of describing people between the age of 16 and 18 who were not working or studying but were not classified as unemployed due to the withdrawal of their entitlement to unemployment benefits. Today the term captures a wide range of experiences among young people. In recent years, it has come to cover a much wider age range – typically up to 24, and increasingly up to 29 – and covers both those who are unemployed and seeking work, as well as those who are economically inactive and hidden by a focus on unemployment statistics (Furlong Citation2006). This diversity means that making policy that could reduce the size of this group requires an understanding of both the relative importance of the different reasons why someone becomes NEET, and of how these have changed over time.
This paper looks at data on young people between the age of 16 and 29 in the UK and tracks how the incidence or chance of being NEET has changed over the period between 1975 and 2015. It highlights which characteristics are associated with a higher chance of being NEET, and how the importance of these drivers has changed over time. It makes a number of contributions to the literature on tackling NEETs. Firstly, it produces a long-run picture of the size and overall make-up of the NEET population aged 16–29 years in the UK from 1975 onwards, placing the current interest in this part of the youth population in historical context. Our data show that overall NEET rates have fallen considerably since the early 1980s, but that most of this change happened in the 1980s and 1990s, with little progress since then.
The second contribution of this paper is to better understand the different reasons why young people fall into the NEET group. Prior research has described the typical characteristics of the NEET population in order to demonstrate the heterogeneity of the group (Eurofound Citation2016; House of Commons Library Citation2018; Department for Education Citation2018a; Thompson Citation2011), but this does not tell us about risk factors – that is, the size of the effect of those characteristics on the chance of being NEET. Numerous other studies have looked at different risk factors taken one at a time (Social Exclusion Unit Citation1999a; Audit Commission Citation2010; DCSF/ONS, 2009; 2011) but given the correlation between factors such as education, health and family, these are unable to tell us more precisely why some people are more likely to be NEET than others. Our study therefore complements the small number of other studies which look at risk factors in combination (Bynner and Parsons Citation2002; Feng et al. Citation2015; Zuccotti and O’Reilly Citation2019). Our study adds to these contributions in part by using UK Labour Force Survey (LFS) data in order to focus on a wider age range over a longer period of time. These data allow us to analyse jointly the effects of educational attainment, family living arrangements, childcare responsibilities and health outcomes for men and women separately, as well as look at regional variation across the UK.
The third, and main contribution of the paper is to examine why NEET rates have evolved in the way they have over time, and in particular to understand why there has been little change since 2000. We first examine shifts in the individual characteristics of young men and women that predict a greater likelihood of being NEET. We then look at the way the risks associated with these factors have changed over time. As we will show, the key individual factors in reducing NEET rates since the 1980s have been the large fall in the number of men and women with low or no qualifications, the reduction in the number of young people with children (which relates to female economic inactivity) and the greater likelihood of those who do have childcare responsibilities to also work or remain in education than has historically been the case. A striking finding of our study is the recent evolution of the role that young people’s mental health plays in determining the chances of being NEET across the UK. Since 2007, there has been a rapid increase in self-reported mental ill health. Above other reported health or disability issues, mental health has the largest effect on the chance of being NEET; this is especially the case for males. While there have been positive effects of a reduced number of young people with no or low qualifications, there is little evidence that the attainment of degree-level qualifications specifically, which have continued to become more commonplace, has affected the chances of being NEET over the past three decades.
Finally, while much of our analysis focuses on individualistic factors that explain young people’s chances of being NEET (such as their qualifications or their family structure), we recognise that external factors play a key role. Thompson (Citation2011) argues that the focus on individual characteristics can take away from the importance of tackling socio-economic factors outside of an individual’s control, such as class and family background. These are undoubtedly an important part of the overall picture but we lack the data necessary to say anything about this here. However, we are able to draw a few conclusions about the impact of economic conditions. We show that when NEET rates have fallen significantly (for example, during the 1990s), it has been at a time where general labour market conditions were improving, reducing NEET rates for all young people regardless of their personal characteristics. Since 2000, we have seen regional conditions play a key role – we find evidence of significant differing outcomes for those inside London and outside London, although these trends are different for men and women. Finally, in the period following the global financial crisis, those in their teens and early 20s in 2015 are doing better than older cohorts, pointing to a possible scarring effect from entering the labour market during an economic recession.
The paper is set out as follows. Section 2 defines NEET for the purposes of our analysis and presents the headline NEET figures and trends from our dataset. Section 3 discusses our empirical approach to first, estimating the factors that predict differences in the risk of being NEET in the UK, and second, understanding why the NEET rate has changed as it has over time. Section 4 presents the results of these two analyses. Section 5 concludes with some policy implications.
2 Defining the NEET population in the UK
The term NEET (or ‘status zero’ as the group was initially labelled) was first applied in the UK to those between the age of 16 and 18 who were not classified as unemployed due to the withdrawal in 1988 of entitlement to unemployment benefit for young people of that age (Furlong Citation2006). This age group still receives particular attention (see, for example, Department for Education Citation2018b). However, in recent years, the term has come to cover a much wider age range. For instance, the Office for National Statistics’ (ONS) quarterly measure of NEETs covers those between the ages of 16 and 24, using Labour Force Survey data rather than administrative data collected by local government (see Office for National Statistics Citation2019). Outside of the UK, it is common to see discussions cover an even wider age group (Eurofound Citation2012) – the EU provides statistics on NEETs up to the age of 29, and a similar indicator is now reported in the OECD’s Employment Outlook. We follow this practice in our research – as we show later, the problems of non-participation or exclusion do not disappear once someone reaches their mid 20s.
Individuals in this age range in our data are either EET (in education, employment or training) or NEET – the NEET rate figure described in later sections is the number of NEET individuals over the total population. shows the iterative criteria used for determining if someone is NEET or EET. Within the NEET category, we distinguish between active and inactive NEETs, where the former are all NEETs who are currently searching for a job (i.e. they are the ILO definition of an unemployed individual). This distinction is important as previous research has shown that active and inactive NEETs represent two qualitatively different groups (Maguire Citation2014; Eurofound Citation2016; Dorsett and Lucchino Citation2018).
Figure 1. NEET definition flowchart
In order to calculate the number and proportion of individuals who are NEET in the UK, we use data from the UK Labour Force Survey, which was produced annually from 1975 until 1992 and then quarterly thereafter. Table A1 in the Appendix summarises the LFS variables used in each year to operationalise the definition of NEET in . For the quarterly surveys, we use the second quarter (April to June) data as this is closest to the period when the annual survey data fieldwork was conducted, which is important because there is a cyclical element to NEET measurement.
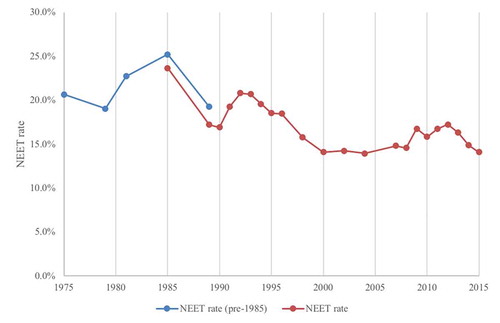
shows the proportion of 16 and 29-year olds that were NEET between 1975 and 2015. The variables available prior to 1985 are less consistent in terms of what questions are asked – we believe we have produced the best possible definition using what was available to us in the LFS, but for clarity we depict this as a different time series. In general, NEET rates have trended downwards since the 1970s and reached a low point in the 2000s before levelling out, with female NEET rates being just 1 percentage point lower in 2015 than in 2000 and male NEET rates being 1 percentage point higher in 2015 than in 2000. Around this trend, the NEET rate has unsurprisingly followed economic cycles, with increases in the early 1980s and early 1990s and then again after the 2008–9 global financial crisis. Putting those cycles to one side, the overall change in NEET rates over forty years seems to be from around 19–20% to approximately 14%.
Figure 2. The NEET rate, 1975–2015
shows the breakdown of the headline figure by gender and into active and inactive NEETs. Over the whole time period, a greater proportion of NEETs are female rather than male, but this gap has narrowed significantly as NEET rates for women have fallen almost continually while the low point for men came in 1990. In the 1980s and early 1990s, male NEETs were almost always searching for work, today male NEETs are almost evenly split between the active and inactive category as the male inactive NEET rate has risen since 1990. What is most striking about this increase in inactive male NEETs is that it has occurred during a time when educational opportunities have been hugely expanded both in terms of further and higher educational programmes, and shorter-term training programmes in the workplace.
Figure 3. Active and inactive NEET rates by gender, 1975–2015 (a) Male (b) Female
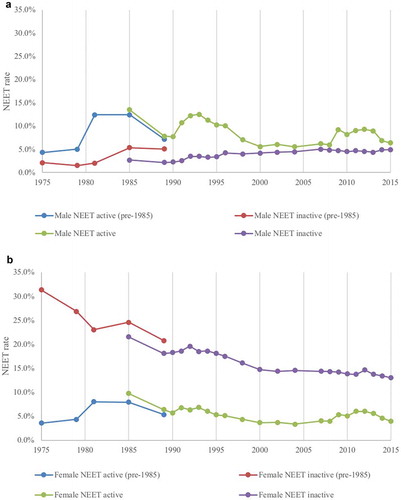
These trends do not vary much by age (not shown in the figures). The current near-even split between active and inactive NEETs for males is observed for teenagers as well as those in their late 20s. The decline in female active and inactive rates can be seen across age groups, although it is far more pronounced, particularly in terms of inactivity for those over the age of 21. For females over 25, inactive NEET rates fell from over 35% in 1985 to 18% in 2015. Later in the paper, we link this to the fall in the proportion of women with child care responsibilities (which were much more common for women in their mid to late 20s), as well as the weakening of the predicted relationship between those responsible for child care and inactivity.
Finally, it is worth noting the plateauing of NEET rates since 2000 is common to all age groups within both genders – that is, it is not masking a large fall in the NEET rate for one group and an accompanying large rise in the NEET rate for another. For women, there is essentially no change in NEET rates for those under 22 between 2000 and 2015, and a decline of only around 2.5 percentage points for those over 21 (as compared to 7 percentage points between 1990 and 2000). For men, all age groups have slightly higher NEET rates in 2015 than in 2000, and this is not just due to the consequences of the 2008 financial crisis – these rates increased between 2000 and 2007 across the board, and most notably for the under 25s.
With this overview in mind, the remainder of this paper looks at two key questions: (1) what factors place people at a higher chance of being in the NEET population, and (2) how can we account for the change in size and composition of this population over time, particularly with regards to the relative lack of progress at reducing NEET rates since 2000.
3 Data and methods
The two questions require two separate empirical approaches, which we explain below. We first conduct a regression analysis on our LFS data (from 1985 onwards) to jointly estimate the key predictors for being NEET – this is set out in section 3.1. The question about changes in the NEET rate over time uses a Blinder-Oaxaca decomposition approach (Jann Citation2008), which is explained in section 3.2. Results follow in section 4.
3.1 Estimating risk factors for being NEET in the UK
While the NEET population is diverse, there are certain characteristics which are more strongly associated with being part of this group. To unpick these factors, we estimate a linear probability model of the form in Equationequation (1)(1)
(1) Footnote1:
where NEETit is an indicator variable that takes the value of one if individual i is NEET at time t and zero otherwise, Xit is the set of explanatory variables which predict NEET status that includes individual characteristics as well as regional dummy variables (for each English region, as well as separate controls for Scotland, Wales and Northern Ireland), Zt, is a set of year dummies to account for year-to-year variation and α, β and γ are the coefficients which relate these variables to the probability of being NEET.
The first two explanatory variables we include are educational attainment and age. We distinguish four categories of qualification – those with a university degree (or higher), those with some form of post-16Footnote2 secondary qualifications (which includes A-Levels, Scottish Highers, level 3 vocational qualifications including apprenticeships, and professional qualifications such as nursing and teaching), GCSEs (including Scottish Standards, and level 2 vocational qualifications), and those with lower level qualifications than that (or no qualifications). These distinctions are broad in order to capture the main trends as people progress through different levels of the education system. The GCSE variable is coded to include only those who have achieved a grade C or above – it has been previously demonstrated that reaching that grade threshold conveys a significant labour market advantage (Machin, McNally, and Ruiz-Valenzuela Citation2018). We also distinguish four age groups – those between 16 and 18 (the original NEET focus age range), those between 19 and 21 (the typical age of higher education students), those between 22 to 25 and those aged 26 to 29. We also estimate the model with age as a continuous variable (including age-squared in case the relationship is not linear) and dummies for each age. The four age group model is preferred as it allows for some degree of non-parametric relationship, without having an unmanageable amount of age variables, which is particularly important in the decomposition analysis.
An additional issue around education that we explore is whether there are differences between those who have followed vocational or academic pathways. There are a variety of variables in the LFS which could be used to look at this – for example, since 1996, the LFS has variables on individual qualifications held, including vocational qualifications such as BTECs, City and Guilds, RSA and NVQs. However, the data on whether an individual reports that they had completed a trade apprenticeship – including advanced and foundation modern apprenticeships – goes all the way back to 1985. This would seem to pick up a large proportion of those following a vocational route, with those reporting completing an apprenticeship far exceeding the number with specific vocational qualifications – on average, approximately 12% of males and 4% of females included in our analysis have completed one, although for males this figure has dropped from 16% in 1985 to 7% today. Moreover, in some cases, (such as the case for City and Guilds qualifications) the two strongly overlap. For these reasons, we include an indicator for having completed an apprenticeship in our estimations in order to look at differences by academic and vocational pathways.
The effect of qualification on NEET status is not likely to be causal. Part of this is due to reverse causality – educational attainment is endogenous to NEET status in the sense that someone who is NEET at the age of (for example) 17 will necessarily have lower qualifications as they have, by definition, left education. That said, the greater issue for endogeneity is that there may be omitted variable bias if there are unobservable characteristics which correlate with both NEET status and educational attainment.
Several studies have previously shown that care responsibilities, specifically having time away from the labour market to have a family, have an impact on the chance of being NEET, particularly for women (e.g. Feng et al. Citation2015; Audit Commission Citation2010; Maguire Citation2018). We use LFS household composition responses (available from 1996 onwards) to examine the impacts of having a child (including step-children) on the incidence of being NEET. Using those same data, we also examine the impact of being over 16 and still living with parents (including step-parents or parents-in-law). There has been significant media coverage of the ‘failure to launch’ phenomenon, where increasing numbers of the most recent generations of young people have remained in their parental home, been unable to find a job and delayed the transition from childhood to adulthood. That said, the theoretical relationship between continuing to live with parents and NEET rates is ambiguous – living in the parental home reduces living costs that might make the need to find an income less pressing; for those with care responsibilities, the presence of grandparents may make it easier to continue to work alongside having a child. Moreover, a correlation between living at home and being NEET might have the causal effect running in both directions, for example if an event such as job loss triggers a return to the family home (Berrington, Stone, and Falkingham Citation2010). Hence, we include living with parents in an analysis to see if it relates to NEET status overall when combined with other variables, but stress that any effects should not be seen as causal.
One factor that has been repeatedly identified as a driver of being NEET is health status, with a particular emphasis on mental ill health (Scott et al. Citation2013; Gutiérrez-García et al. Citation2017). We use LFS responses on self-reported health conditions to examine the differences between those suffering from ill health and those who are not. We categorise conditions into five groups, with each corresponding variable taking a value of one if the respondent mentions suffering from that condition: mental ill healthFootnote3; physical mobility limitationsFootnote4; hearing, sight and speech impediments; learning difficulties and other health conditions (which largely covers diseases and chronic conditions from allergies, respiratory conditions, cardiovascular conditions, digestives conditions, diabetes and others that are not classified elsewhere). Again, the effect of these variables on being NEET is not interpreted causally, although for many physical health issues these would seem to be reasonable. However crucially for our results later in this paper, it would not be reasonable to interpret the correlation between mental ill health and NEET status causally as the effect likely runs in both directions – that is, being out of work could be a driver of poor mental health as well as a consequence.
3.2 Decomposing of changes to NEET rates
In the second part of our analysis, which looks at why NEET rates have fallen since the 1980s, and why they have remained relatively unchanged since around 2000 we consider, and look for evidence of, three potential explanations. Firstly, that until 2000 there were increasing numbers of young people with the sorts of characteristics that are associated with a lower chance of being NEET, but that after 2000 this stopped being the case. Secondly, the relationship between those characteristics and being NEET may have changed in some way over time that has meant that even if more people had those characteristics that used to be associated with lower NEET risks, the risks associated with those characteristics have increased. The third potential explanation is that there have been some changes to factors outside of an individual’s control and/or personal characteristics which have an effect. In order to evaluate these different explanations, we re-estimate Equationequation (1)(1)
(1) for specific years (hence dropping the year dummy variables):
The error term εit is assumed to have a mean of zero. Taking mean averages of the dependent and explanatory variables says that the NEET rate (the mean of the NEET variable at any point in time) can be expressed as a function of the mean average characteristics of the population at that point in time. We are interested in the change in the NEET rate between time t and time t + 1, so by subtracting one from the other and rearranging terms we get that:
We focus on five specific years and hence four time periods: 1985–1993, 1993–2000, 2000–2007 and 2007–2015. The change in the NEET rate in one of these time periods can therefore be broken down into (i) a composition effect (ii) a coefficient effect. The former, captured by the first term in Equationequation (3)(3)
(3) , is given here as the change in the NEET rate that would be expected if the characteristics of the population between the two time periods changed but the way those characteristics related to the chance of being NEET stayed the same. For example, young people today are considerably more educated than in 1985, and as higher qualifications have traditionally been associated with better labour market prospects, we would expect fewer NEETs (holding everything else constant).
The coefficient effect has two parts. The second term in Equationequation (3)(3)
(3) is the change in the intercept, and tells us what is happening to people with all the reference characteristics, as all the variables X are defined relative to a reference characteristic (for example, the effect of having a degree compared to someone with post-compulsory schooling qualifications). The third term in Equationequation (3)
(3)
(3) captures the change in the way each characteristic relates to the chance of being NEET compared to those reference characteristics – for example, if the penalty to having low qualifications (in terms of being more likely to be NEET) compared to having post-compulsory schooling qualifications gets worse. Hence, this term picks up changes in the overall NEET rate due to, for example, some characteristics becoming increasingly demanded in the labour market, or some barriers to participation or source of disadvantage being weakened or strengthened over time.
The change in the intercept term picks up some macroeconomic external effects, such as increases or decreases in the overall demand for labour due to the economic cycle, or systemic changes in the incentives to participate in employment or education through, for example, the welfare system. If these are important, we would see a large proportion of the overall change in NEET rates explained by the reference group, with little effect coming from the third term, implying opportunities are improving or worsening for all young people regardless of individual characteristics. Economic shocks enter the analysis in two other ways. Firstly, if there is a scarring effect from being a new labour market entrant during an economic recession (Raaum and Røed Citation2006; Rothstein Citation2019) we would expect to see increased NEET risk for older individuals in the years after the downturn. Secondly, regional dummy variables will pick up regional variation in terms of the magnitude of economic shocks, as well as other structural changes to the local labour market. The choice of London as reference group is deliberate here, as it relevant to ongoing debates about the extent of London’s economic and political dominance and exceptionalism in the UK, and its divergence from the experience of people in the rest of the country.
The decomposition approach discussed above has two key limitations. Firstly, as noted in section 3.1, the linear probability model that it is based on may give an inappropriate approximation of the probability of being NEET in comparison to a non-linear model (such as the logit model), one concern being that the linear probability model can sometimes predict estimates of probability below zero or above one. However, decomposition techniques are not straightforward with non-linear models, hence our preference for the linear model in this paper. That said, we compare our linear estimates to a non-linear model in two ways. Firstly, we calculate the aggregate composition and coefficient effects using a logit model to compare to the aggregate composition and coefficient effects in our linear model. Secondly, we follow the procedure given by Fairlie (Citation2005) which decomposes the aggregate composition effect into its individual variable components, which we then compare to our linear estimates.
The second issue is that in calculating the coefficient effects for dummy variables, which most of our data are, our individual variable coefficient effect estimates are sensitive to the choice of the reference group because the relationship between NEET status and the reference category is hidden in the intercept term. For example, if A-Levels are the reference category for education level, a positive coefficient effect on degree could mean both that degree holders are more likely to be NEET in one period compared to an earlier period, or it could mean that degree holders are less likely to be NEET in that period, but the risk has fallen for A-Level holders more. Had GCSEs been the reference group instead and the outcomes for this group had worsened more than for all the qualification levels, the estimated coefficient effect for degree could well have been negative instead.
In either case, it would be incorrect to say that the NEET risks associated with having degrees is increasing or reducing NEET rates in absolute terms. We are careful to avoid such claims. We can say something about the relative effects though – in the first example, we could say that NEET rates are higher than expected because the relative advantage of having a degree over having A-Levels has diminished. Such relative effects are particularly relevant if we consider employment outcomes to be the result of the supply and demand of particular skill groups – in that case, a fall in the relative benefit of having a degree can indicate insufficient demand for such individuals relative to their growing supply.
4 Results
4.1 Risk factors
The full estimation results for Equationequation (1)(1)
(1) are given in . Given the large dataset, it is not surprising that almost all coefficients are statistically significant at the 5% level (and, indeed at the 1% level).Footnote5
Table 1. Factors associated with being NEET among men, 1985–2015
Table 2. Factors associated with being NEET among women, 1985–2015
The tables show that the incidence of NEET is far higher for those with few qualifications, especially for females. Those with higher qualifications than GCSEs are less likely to be NEET, but the difference between A-Levels and degree is small. Specifically, for men, holding a degree is never statistically significant for the period from 1992–2015 (which is when we have our full set of explanatory variables). For women there is no reduction in NEET risks for those with A-Levels and those with a degree once health and family variables are included. This suggests that for women any differences in NEET risks by qualification have a lot to do with the differences in the propensity to start a family before the age of 30 by educational level.
Completing a trade apprenticeship was associated with a higher chance of being NEET for females and has no association with the chance of being NEET for males, everything else being equal and once health and family variables are included. This suggests that vocational pathways and academic pathways (at the same level) lead to similar outcomes for males, but females taking vocational pathways typically do less well than those completing academic qualifications at the same level. This could relate to different sorts of vocational qualifications followed by men and women, as well as unobserved differences for those following apprenticeships compared to those that do not.
Moving away from educational differences, NEET risks are higher for males between the age of 19 and 22, and then decrease with age – this is found for each specification on the effect of age (columns 1 to 3 of ). The probability of being NEET increases with age for women. However, once care and living arrangements are included, we see that this age effect almost entirely disappears for those over the age of 21, with the remaining age effect similar to that for men. As an extension, we interact having a child with age group, which shows that conditional on having a child, the NEET risks are much greater for the under 22s – for those age 16–18, NEET risk increases by 58pp, with this effect being on average 8pp, 21pp and 28pp lower for each subsequent age group.
This analysis would seem to suggest that two popular conceptions of the NEET group are not correct – that NEETs are teenage mothers and young people delaying adulthood by remaining in their parental home well into their 20s. Firstly, while being a parent increases NEET risks for women of all ages and particular for younger women, the vast majority of young women who have a child are in their mid to late 20s. Since 1996, the proportion of females under 22 who have a child has fallen from 8.2% to 5.6% in 2015. By comparison, in 2015, the proportion of those between 22 and 25 who had a child was 28.3% and for those between 26 and 29, it is 45.4%. Secondly, while living with parents is associated with higher NEET risks for young men, the opposite is true for young women. Moreover, the effect for men is small – an expected 3.4 percentage points holding everything else constant.
Finally, show the predicted change in the probability of being NEET associated with each of the five categories of health problem. Mental ill health stands out as having a very large effect on the risk of being NEET. It is associated with an increase in NEET rates of 37.5 pp for males and 23.6 pp for females. The tables also show that effects on mental ill health on the chances of being NEET are much higher than those associated with other health conditions, for both men and women.Footnote6
4.2 Decomposition
We estimate two versions of Equationequation (3)(3)
(3) – the first just includes qualifications, age and regional variables, for four time-periods and the second full model adds in mental health and household structure for two periods (2000–2007 and 2007–2015), as these variables are not available in these earlier time periods. We also conducted the analysis for active and inactive NEET rates separately – these results are discussed below when informative.
gives the aggregate composition and coefficient effects for each time period (for 1985–2000, we have only the age, education and regional variables, and after 2000 we have all variables included). The total change in NEET rate over the time period is the sum of the composition and coefficient effects The table compares the linear probability model estimates with a non-linear logit model estimate, and shows that the aggregate effects are generally similar, which suggests the linear model is a reasonable approximation, particularly since 2000. It shows decreases in the NEET rate were associated with both improving individual characteristics combined with large coefficient effects in the 1980s (for women) and 1990s (for both). Since 2000, male composition effects have increased NEET rates, while coefficient effects for both men and women have been either small or positive.
Table 3. Comparison of aggregate composition and coefficient effects using linear and non-linear models
gives the decomposed compositional effects – that is, the change in the NEET rates that our model predicts if the relationship between NEET risks and individual characteristics stayed the same across a period of time, but the proportion of people with each of those characteristics changed.Footnote7 Sections of each bar above the axis represent effects that have contributed to a higher overall NEET rate (everything else being equal), while sections of each bar below the line represent effects that have contributed to a lower overall NEET rate (everything else being equal). shows that for both males and females, the fall in those who have no or low qualifications should have pushed NEET rates down considerably, which is not surprising given that having low or no qualifications has historically been associated with much higher chances of being NEET. However, the increase in educational attainment beyond that, specifically to more people with degrees, has little to no effect. For women there are some age effects, as in our data the size of the 16–21 age groups reduced during the time period studied, and NEET rates have been historically higher for women in their mid to late 20s. When we include mental health and family structure variables for the full model, a slightly different picture emerges of the overall composition changes. The effects relating to education stay about the same but the increase in reported mental ill health predicts higher NEET rates in both periods, but particularly after 2007 when the effect is large for both men and women. This is an important compositional effect which has largely offset any compositional effects relating to better educated individuals. In the more restricted model, the effect of this would mistakenly be included as a coefficient effect. The age effects disappear for women when having a child can be included – this is because any relationship between age and NEET risk for women is largely explained by the propensity to have a child, rather than it being due to age specifically.
Figure 4. Compositional effects on NEET rates by gender, 1985–2015 (a) Male (b) Female
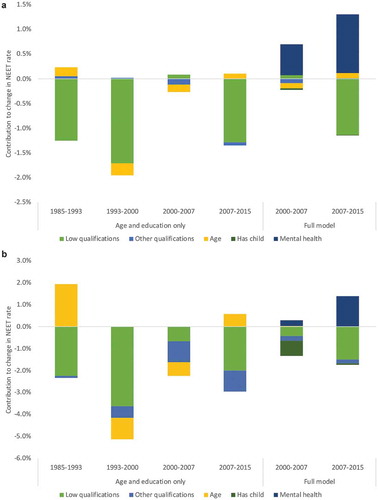
One final observation from is that between 2000 and 2007, there was little change in the overall share of young people with low or no qualifications, and given that having few qualifications is associated with a much higher risk of being NEET, the fact that this group does not continue to shrink is one reason why NEET rates did not fall as much in the years after 2000. It is not immediately obvious why the share of people with low qualifications stopped falling during this period – it fell again in the period after this. However, one reason for this is due to migration – in particular, an increase in new migrants with few qualifications (or, potentially, qualifications that are not recognised in the qualification framework used to gain information of education in the Labour Force Survey). In particular, the share of foreign-born individuals between the age of 16 and 29 in our data jumped from 8.3% to 13.2% between 2000 and 2007, and the proportion of foreign-born individuals in the low-qualified group almost doubled, from 16.6% to 28.7% The proportion of foreign born individuals in the data barely changes between 2007 and 2015 (13.2 to 13.9%), but the composition of the migrant group in terms of low or no qualifications changed at lot between 2007 and 2015 – 50% of foreign born individual had low qualifications in 2007, while 29% had low qualifications in 2015.Footnote8
Our estimates of the composition effects rely on the assumption that the linear probability model provides a good approximation of the probability of being NEET. A binary outcome is better estimated using a non-linear method such as a logit model, but does not lend itself to such straightforward decomposition analysis. However, estimates of the individual variable composition effects can be found from a logit model following the approach set out in Fairlie (Citation2005). The results of this are given in Appendix Table A4. For men, the estimates from the linear probability model and the Fairlie estimates are comparable, in particular they emphasise the important effects of the shift away from low or no qualifications, and the impact of mental ill health. For women, the Fairlie estimates give a much lower weight to qualification effects being behind the fall in NEET rates and a much higher contribution of age (up to 2000) and child care (after 2000, and likely the unobserved factor being picked by age before 2000).Footnote9
The coefficient effects – that is, the part of the change in the NEET rate which can be explained by changes in the relationship between individual characteristics and the risk of being NEET – are reported in Appendix table A5. summarises these effects – we show only the first two periods for the restricted model, and then the results from the full model in the final two periods. Not including all of the variables in the latter two periods has a large impact on the results.
Figure 5. Coefficient effects on NEET rates by gender, 1985–2015 (a) Male (b) Female
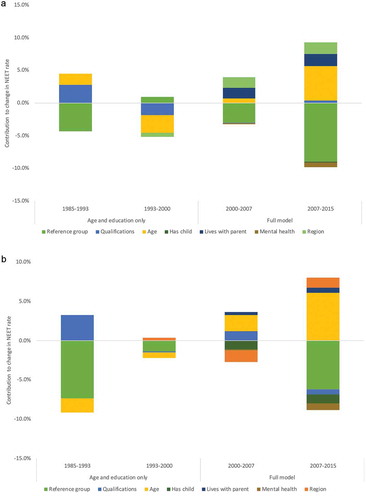
Firstly, there have been some reductions in the relative benefit of acquiring qualifications for both men and women and particularly in the 1980s and 1990s, but nothing that offsets the compositional effect associated with having a more educated workforce. This mean that as more people gained higher qualifications, the relative value of those qualifications has largely held. This is consistent with the notion that the ability of the labour market to provide employment for more qualified workers has not massively outstripped their greater availability.Footnote10
Our observation period corresponds to greater female labour market participation. The reference group effect accounts for almost all of the coefficient effect for women in the 1980s and 1990s, which points to a general change in the labour market position of women. Relative to the situation for teenagers, NEET risks for women in their mid and late 20s fell during this time period, pushing NEET rates down further. This age effect in the 1985–1993 period is largely for inactive NEETs and seem likely to be related to changing gender roles around work and family. Although this is speculative as we cannot control for having a child in these earlier periods, we find that the coefficient effect for having a child is negative in the latter two periods, and that the age coefficient effects are pushed upwards (either less negative or more positive) when having a child can be controlled for. This is consistent with more women being able to (and either wanting to or needing to) work or continue study alongside care responsibilities.
Age effects are also important for men. In the first period, the reference group effect for men is negative, but compared to them older individuals did not see the likelihood of being NEET decrease by as much, leading to little change in NEET rates overall. By contrast, between 1993 and 2000, NEET risks fell for all age groups over 18 as compared to those aged 16–18, which pushed NEET rates down, similarly to women. This age effect is particularly associated with a decline in active NEETs rates, which points to improvements in labour market conditions after the early 1990s recession as the main driver here.
After 2000, differences between London and other parts of the UK play a much larger role. For the period between 2000 and 2007, where in general the economy continued to perform as well as it had in the previous period, these regional effects related to inactive NEET rather than active NEETs – for women, there was an increase in the chance of being (inactive) NEET in London compared to elsewhere and for men a decrease in the chance of being NEET for those in London as compared to most other regions around the UK.
The period following the global financial crisis and recession in 2008–9, and subsequent imposition of austerity measures by the Coalition government saw two main effects. Firstly, there were regional effects for men and women and these were nearly identical overall – outside of London, NEET risks did not improve as much or worsened compared to what happened in London. The predicted effect of living with parents contributed to higher NEET rates relative to those not living with their parents, but the direction of causality cannot be established here – it is possible that given increased living costs, those who were already NEET were more likely to move back home than they would have in the early 2000s.
Secondly, there were age effects which suggested that those over the age of 21 came out of the recession period in a worse position than those aged 21 and under. This mostly affected active NEET rates, which is consistent with the notion that those who enter the labour market after completing education during a downturn face some longer-term scarring effects that can still be observed in their mid and late 20s. However, it is worth remembering that during this time period, a number of policies were introduced to increase participation in education amongst 16–18 year olds, not least an increase in the participation age (see House of Commons Library Citation2018). To test that this is not what is driving the age effect, we ran the same decomposition as above, but excluded those between 16 and 18, so now age effects would be comparing those aged 19–21 (who are outside of the effects of these participation policies) to those who are older. This reduces the size of the age effect, moreso for men that for women, but there is still some age penalties for those over 21 suggesting that there are genuine worsening employment opportunities for those in their mid to late 20s as compared to those in their teens.
5 Conclusion
The main question this paper seeks to address is why so little progress on reducing the chance of being NEET has been made since 2000. Our analysis shows that a key reason for this stasis in NEET rates in the UK is that the composition of young people has changed less dramatically in favour of characteristics which have a lower association with being NEET than was the case during the 1980s and 1990s. In terms of the characteristics of young people today, we highlighted in particular that the fall in the low qualified group has slowed since 2000, and that self-reported mental ill health has risen since 2007.
Added to this is a mixed picture in terms of changing relationships between individual characteristics and NEET risks, which have largely cancelled each other out. In particular after 2007, we see NEET risks increasing in most regions of the UK outside of London, and some evidence of a labour market scarring effect, especially for those who entered the labour market at the start of the 2008 recession. On the other hand, penalities against women with child care responsibility have continued to fall. In general, people living in London, those with children, those not living with parents and those under 21 make up a smaller part of the overall NEET population than we would have expected at the start of the year 2000 (and before). Moreover, while the general health of the labour market in the 1990s saw falling unemployment rates and rising employment, the periods after 2000 has not had a general economy-wide shift that improved labour market outcomes in the same way.
Our analysis points to a number of areas for policy. The first point to note is that we are approaching the limit of what keeping younger people in education and training for longer can do. Further reductions in those without GCSE level qualifications at grade C and above may help reduce NEET numbersFootnote11 but we have little evidence that increased education beyond that point is associated with dramatically lower NEET rates. One area we do not explore in much detail (aside from distinguishing those with apprenticeship) is around the balance between general and vocational education. Dolphin (Citation2014) argues that for those not taking a university route into the labour force, vocational options in the UK are lower quality, less connected to employer needs and couple with insufficient careers advice and guidance than in neighbouring European countries where youth unemployment rates are smaller. It is possible that there are reforms to vocational education in the UK which could enable more young people to find employment, although the UK has a long history of attempting to do so (City & Guilds Citation2014) and these problems persist (Wolf Citation2011). T-Levels represent the most recent attempt by the UK government to reform vocational education in England and their success and attractiveness amongst young people still remains to be seen. The challenge is to ensure they meet employer needs in a way that existing vocational and academic qualifications do not, if NEET rates are to come down further because of them. As they are targeted at those completing GCSEs, they are unlikely to do much for those who have left full-time education, particularly those affected by entering the labour market shortly after the 2008 financial crisis and recession. Moreover, a key feature of their appeal seems to be around the ability to progress to university, which we have shown offers no advantage over current A-Levels in terms of reducing NEET risk.
Our analysis shows that policy recommendations which target skills and employability of young people, or which seek to encourage employment or further training through incentives in the welfare system and guarantees of work placements (e.g. Cooke Citation2013) are missing two key obstacles: mental ill health and childcare. Both of these factors also implicate job quality issues which particularly affect low paid employment (Keep Citation2019). Rather than focusing on work incentives and skill deficits, policies to either tackle increasing mental ill health rates or facilitate (where possible and desirable) some form of labour market participation specific to sufferers of mental ill health could be expected to have some large effects on their own – our analysis showed that mental health problems have a far larger effect on the chance of being NEET than any other category of health problem. In terms of care, NEET rates have been pushed down over this time period by the reduction in the number of women who have children in their teens and 20s. Previous research has linked this to the success of England’s Teenage Pregnancy Strategy that was implemented between 1999 and 2010 (Skinner and Marino Citation2016), and renewing this approach to minimise unplanned pregnancies could reduce NEET rates further. Moreover, while the relationship between having a child and being NEET has weakened over time, the effect is still large among women aged 16–29. This would seem to point to policies that reduce child care costs and facilitate work schedules that make balancing care with work viable for young parents. In extensions of our main analysis, we find no relationship between the availability of part-time work in a region and NEET rates, so the solution here is perhaps not as simple as there being more jobs offering fewer hours, perhaps because such jobs tend to be less secure and attract lower wages, which shifts the trade-off between work and care responsibilities significantly in favour of the latter.
Disclosure statement
No potential conflict of interest was reported by the author(s).
Additional information
Funding
Notes on contributors
Craig Holmes
Craig Holmes is a labour economist at Pembroke College and the Blavatnik School of Government, University of Oxford. His research interests include the economics of education, particularly higher education, occupational change, labour market mobility and inequality, youth employment, and skills policy. He received his D.Phil in Economics from Oxford in 2012.
Emily Murphy
Emily Murphy is a researcher at the Institute for Research on Socio-Economic Inequality (IRSEI) since March 2020. Prior to joining the University of Luxembourg, she worked at the University of Oxford and the University of Zürich. She received her PhD in Social Sciences from the University of Lausanne (NCCR LIVES, 2015), her MSc in Sociology from Oxford University, and her BA in Business, Economics and Social Studies from Trinity College Dublin, Ireland.
Ken Mayhew
Ken Mayhew is Emeritus Professor of Education and Economic Performance and Emeritus Fellow of Pembroke College, Oxford. He is currently a member of the UK Armed Forces Pay Review Body and an Extraordinary Professor at Maastricht University. He was the founding Director of SKOPE, a multi-disciplinary centre on Skills, Knowledge and Organisational Performance, based in the Oxford Department of Education. Ken’s current research focuses on inequality, transitions from education into the labour market, the economics of work-based training, the economics of higher education, low paid work in the UK and Europe and the labour market as a social model.
Notes
1. We choose a linear probability model over a non-linear model such as logit as the results are simpler to interpret. However, we recognise that the two models can give different results, particularly when the estimated probabilities are close to zero or one. We check that the estimated marginal effects are similar to those using a similarly specified logit model, and the results are reported in the appendix in Table A2 – the differences between the estimate effects are small.
2. This paper uses the term ‘post-16ʹ to refer to qualifications that have typically been undertaken after the age of 16, which until recently was the compulsory school leaving age.
3. The LFS health variables have two relevant categories – we define someone who suffers from mental ill health as anyone reporting ‘depression, bad nerves or anxiety’ or ‘mental illness, or suffer from phobia, panics or other nervous disorders’.
4. We define someone as having physical mobility limitations if they report health problems relating to the ‘arms or hands’, ‘legs or feet’ or ‘backs or necks’.
5. As noted in footnote 1, we also estimate Equationequation (1)(1)
(1) as a non-linear logit model – where the dependent variable in Equationequation (1)
(1)
(1) changes to the log odds of being NEET, or: log(Pr(NEET)/[1-Pr(NEET)]). We do this to to ensure that the use of a linear model is not an inappropriate approximation. The results are shown in the Appendix in table A2. The marginal effects are compared to the linear probability model estimates, and the differences are small.
6. In the section 4.2, where we look at the reasons NEET rates have changed over time, we focus only on mental ill health and omit the other health variables.
7. The full table of compositional effects are included in the Appendix Table A3.
8. We checked to see whether the changing composition of the low qualified group mattered for the predicted risks as an extension to our analysis. We included a variable for being foreign-born as well as a variable for being a recent migrant (which is those that are foreign born and arrived in the UK within the previous five years) into our previously estimated regressions, but this had little effect on the other variables. Interacting low qualifications with foreign born showed that in general, NEET risks are lower for foreign born individuals with no qualifications, and were much lower in 2007 compared to 2000, suggesting that arrival of new unqualified migrants between these years were not themselves driving up NEET rates or worsening the overall risk associated with low qualifications.
9. The Fairlie estimates imply a much larger aggregate compositional effect than was found via the LPM model or the logit model.
10. Note that we are not making a causal claim here – that is, we are not saying that the reduction in NEET rates was the result of improved qualifications, which would be a supply side effect driving firms to create more jobs. It is just as possible that demand side factors were already increasing the number of job opportunities for people with higher qualifications (and would have done so regardless of what was happening on the supply side) and qualifications were then used as a sorting mechanism.
11. Presuming, as always with these sorts of inferences, that the effect of gaining qualification on the chances of being NEET rates stays similar to what is has been in recent history.
References
- ACEVO. 2012. Youth Unemployment: The Crisis We Cannot Afford. London: ACEVO Commission on Youth Unemployment.
- Arulampalam, Wiji, Alison Booth, and Mark Taylor. 2000. “Unemployment Persistence.” Oxford Economic Papers 52 (1): 24–50. doi:10.1093/oep/52.1.24.
- Audit Commission. 2010. “Against the Odds: Re-engaging Young People in Education, Employment or Training”. Audit Commission. https://www.bl.uk/collection-items/against-the-odds-reengaging-young-people-in-education-employment-or-training-local-government
- Bell, David, and David Blanchflower. 2011. “Young People and the Great Recession.” Oxford Review of Economic Policy 27 (2): 241–267.
- Berrington, Ann, Juliet Stone, and Jane Falkingham. 2010. “The Changing Living Arrangements of Young Adults in the UK.” Population Trends 138 (1): 27–37. doi:10.1057/pt.2009.45.
- Bynner, John, and Samantha Parsons. 2002. “Social Exclusion and the Transition from School to Work: The Case of Young People Not in Education, Employment, or Training.” Journal of Vocational Behaviour 60 (2): 289–209. doi:10.1006/jvbe.2001.1868.
- City & Guilds. 2014. “Sense & Instability: Three Decades of Skills and Employment Policy”. City and Guilds. https://www.cityandguilds.com/news/october-2014/skills-policy-review
- Cooke, Graeme. 2013. No More NEETs: A Plan for All Young People to Be Learning or Earning. London: IPPR.
- Department for Children, Schools and Families/Office of National Statistics. 2009. “Youth Cohort Study and Longitudinal Study of Young People in England: The Activities and Experiences of 17 Year Olds”: England 2008. https://dera.ioe.ac.uk/9065/1/b01-2009.pdf
- Department for Children, Schools and Families/Office of National Statistics. 2011. “Youth Cohort Study and Longitudinal Study of Young People in England: The Activities and Experiences of 19 Year Olds: England 2010”. https://www.gov.uk/government/statistics/youth-cohort-study-and-longitudinal-study-of-young-people-in-england-the-activities-and-experiences-of-19-year-olds–2010
- Department for Education. 2013. “NEET Statistics Quarterly Brief – January to March 2013”, Statistical First Release. https://www.gov.uk/government/statistics/neet-statistics-quarterly-brief-quarter–1–2013
- Department for Education. 2018a. “Characteristics of Young People Who are Long Term NEET”. https://www.gov.uk/government/publications/characteristics-of-young-people-who-are-long-term-neet
- Department for Education. 2018b. “Participation in Education, Training and Employment by 16–18 Year Olds in England: End 2017”. https://www.gov.uk/government/statistics/participation-in-education-training-and-employment–2017
- Dolphin, Tony. 2014. Remember the Young Ones: Improving Career Opportunities for Britain’s Young People. London: IPPR.
- Dorsett, Richard, and Paolo Lucchino. 2018. “Young People’s Labour Market Transitions: The Role of Early Experiences.” Labour Economics 54 (C): 29–46. doi:10.1016/j.labeco.2018.06.002.
- Eurofound. 2012. “NEETs – Young People Not in Employment, Education or Training: Characteristics, Costs and Policy Responses in Europe”. Luxembourg: Publications of the European Union. https://www.eurofound.europa.eu/sites/default/files/ef_publication/field_ef_document/ef1254en.pdf
- Eurofound. 2016. “Exploring the Diversity of NEETs”. Luxembourg: Publications of the European Union. https://www.eurofound.europa.eu/sites/default/files/ef_publication/field_ef_document/ef1602en.pdf
- Fairlie, Robert W. 2005. “An Extension of the Blinder-Oaxaca Decomposition Technique to Logit and Probit Models.” Journal of Economic and Social Measurement 30 (4): 305–316. doi:10.3233/JEM-2005-0259.
- Feng, Zhiqiang, Dawn Everington, Kevin Ralston, Chris Dibben, Gillian Raab, and Elspeth Graham. 2015. Consequences, Risk Factors and Geography of Young People Not in Education, Employment or Training (NEET). Edinburgh: Scottish Government.
- Furlong, Andy. 2006. “Not a Very NEET Solution: Representing Problematic Labour Market Transitions among Early School-leavers.” Work, Employment and Society 20 (3): 553–569. doi:10.1177/0950017006067001.
- Gregg, Paul. 2001. “The Impact of Youth Unemployment on Adult Unemployment in the NCDS.” The Economic Journal 111 (475): F626–F653. doi:10.1111/1468-0297.00666.
- Gregg, Paul, and E. Tominey. 2005. “The Wage Scar from Male Youth Unemployment.” Labour Economics 12 (4): 487–509. doi:10.1016/j.labeco.2005.05.004.
- Gutiérrez-García, Raúl A., Corina Benjet, Guilherme Borges, Méndez Ríos, Enrique, and María Elena Medina-Mora. 2017. “NEET Adolescents Grown Up: Eight-year Longitudinal Follow-up of Education, Employment and Mental Health from Adolescence to Early Adulthood in Mexico City.” European Child and Adolescent Psychiatry 26 (12): 1–11. doi:10.1007/s00787-017-1004-0.
- House of Commons Library. 2018. “NEET: Young People Not in Education, Employment or Training”. Briefing Paper SN 06705. https://researchbriefings.parliament.uk/ResearchBriefing/Summary/SN06705
- Jann, Ben. 2008. “The Blinder–Oaxaca Decomposition for Linear Regression Models.” The Stata Journal 8 (4): 453–479. doi:10.1177/1536867X0800800401.
- Keep, Ewart. 2019. “Empowering Individual Workers Through Skills–A New Labour Project Revisited.” SKOPE Research Paper No 129.
- Kelly, Elish, and Seamus McGuinness. 2015. “Impact of the Great Recession on Unemployed and NEET Individuals’ Labour Market Transitions in Ireland.” Economic Systems 39 (1): 59–71. doi:10.1016/j.ecosys.2014.06.004.
- Machin, Stephen, Sandra McNally, and Jenifer Ruiz-Valenzuela. 2018. “Entry through the Narrow Door: The Costs of Just Failing High Stakes Exams.” CVER discussion paper no. 014.
- Maguire, Sue. 2014. “NEET, Unemployed, Inactive or Unknown – Why Does It Matter?” Educational Research 57 (2): 121–132. doi:10.1080/00131881.2015.1030850.
- Maguire, Sue. 2018. “‘Who Cares? Exploring Economic Inactivity among Young Women in the NEET Group across England’.” Journal of Education and Work 31 (7–8): 660–675. doi:10.1080/13639080.2019.1572107.
- Office for National Statistics. 2019. “Young People Not in Education, Employment or Training (NEET), UK: February 2019”. https://www.ons.gov.uk/employmentandlabourmarket/peoplenotinwork/unemployment/bulletins/youngpeoplenotineducationemploymentortrainingneet/february2019
- Raaum, Oddbjørn, and Knut Røed. 2006. “Do Business Cycle Conditions at the Time of Labor Market Entry Affect Future Employment Prospects?” The Review of Economics and Statistics 88 (2): 193–210. doi:10.1162/rest.88.2.193.
- Ralston, Kevin, Zhiqiang Feng, Dawn Everington, and Chris Dibben. 2016. “Do Young People Not in Education, Employment or Training Experience Long-term Occupational Scarring? A Longitudinal Analysis over 20 Years of Follow-up.” Contemporary Social Science 2041 (August): 1–18.
- Reilly, O’, Jaqueline Eichhorst, Werner Gábos, András Hadjivassiliou, Kari Lain, David Leschke, Janine McGuinness, et al.. 2015. “Five Characteristics of Youth Unemployment in Europe: Flexibility, Education, Migration, Family Legacies, and EU Policy.” SAGE Open 5 (1): 1–19.
- Rothstein, Jesse. 2019. “The Lost Generation? Scarring after the Great Recession”. https://eml.berkeley.edu/~jrothst/workingpapers/rothstein_scarring_052019.pdf
- Scott, Jan, David Fowler, Pat McGorry, Max Birchwood, Eoin Killackey, Helen Christensen, and Hickie Ian. 2013. “Adolescents and Young Adults Who are Not in Employment, Education or Training. Their Problems are More than Economic.” British Medical Journal 347: 237: f5270. doi:10.1136/bmj.f5270.
- Skinner, S Rachel, and Jennifer Marino. 2016. “England’s Teenage Pregnancy Strategy: A Hard-won Success.” The Lancet 388 (10044): 538–540. doi:10.1016/S0140-6736(16)30589-X.
- Thompson, Ron. 2011. “Individualisation and Social Exclusion: The Case of Young People Not in Education, Employment or Training.” Oxford Review of Education 37 (6): 785–802. doi:10.1080/03054985.2011.636507.
- Social Exclusion Unit. 1999a. “Bridging the Gap: New Opportunities for 16 –18 Year Olds Not in Education, Employment or Training. London: SEU”. https://dera.ioe.ac.uk/15119/2/bridging-the-gap.pdf
- Social Exclusion Unit. 1999b. “Teenage Pregnancy”. London SEU: https://dera.ioe.ac.uk/15086/1/teenage-pregnancy.pdf
- Wolf, Alison. 2011. Review of Vocational Education – The Wolf Report. London: Department for Education.
- Zuccotti, Carolina, and Jacqueline O’Reilly. 2019. “Ethnicity, Gender and Household Effects on Becoming NEET: An Intersectional Analysis.” Work, Employment and Society 33 (3): 351–373.
Appendix
Table A1. LFS variables used
Table A2: Comparison on linear probability model and logit model for NEET risk factors
Table A3: Composition effects from Blinder-Oaxaca decomposition of probability of being NEET, 1985–2015
Table A4: Comparison of composition effects estimated by linear probability model and logit model/Fairlie (Citation2005)
Table A5: Coefficient effects from Blinder-Oaxaca decomposition of probability of being NEET, 1985–2015