
 ?Mathematical formulae have been encoded as MathML and are displayed in this HTML version using MathJax in order to improve their display. Uncheck the box to turn MathJax off. This feature requires Javascript. Click on a formula to zoom.
ABSTRACT
Gas permeability of moulds and cores is an important factor to consider in the casting process. In foundries, gas permeability is measured by using instruments which give dimensionless numbers. This approach enables the comparison of values between samples and is often not quantified in units. In this study, a custom-made measurement system is introduced that applies Darcy’s law, where pressure gradients for different flow rates are studied. The Darcian permeability in standard cylindrical samples was determined using a method that is familiar with those in earth sciences. Two types, steady-state and unsteady-state approaches were used for the calculations, and the difference in permeability values generated by these two methods is discussed. The results of a silica sand sample with furan resin and a 3D-printed sample that consists of artificial granulous material with phenolic resin were compared.
1 Introduction
During the casting process, when moulding materials come in contact with molten metal, they are exposed to a severe thermal shock. This thermal shock results in a series of events which lead to gas evolution from the moulding materials. When the temperature of the mould rises above 100°C [Citation1], the free moisture present in the mould vaporizes. As the mould reaches higher temperatures, the binder system, which includes resin and catalyst, starts to degrade. This free moisture and decomposition reactions of chemicals lead to the release of gases from the mixture. The ability of the material to allow the evolved gases passing through a certain geometry is determined by gas permeability. In certain circumstances, when there is a large amount of the generated gas, and there is not enough time or space for these gases to be vented out, the pressure inside the cores builds up resulting in gas bubbling into the melt. Hence, the pore size and gas permeability act as essential factors to be investigated to prevent this type of casting defect. Winardi et al. studied the mechanism of gas-related defect formation, where the internal core pressure could in certain cases be higher than the metal head pressure up to a certain time period [Citation2]. In cases like these, the core will release gases into the melt, and the released gases can get trapped into the solidifying melt when the casting skin is formed in the mould walls. To be able to avoid defects like these, it is essential to investigate the gas-permeability of the core.
Gas-permeability is measured without units in the foundry industry, mainly using permmeters [Citation3]. The resulting permeability number is dimensionless and can be used as a comparative tool. This study aims to measure the gas-permeability of foundry cores using the Darcy’s law, with an established method prevalent in earth sciences [Citation4]. This study aims to determine the gas permeability of standard cylindrical samples with two different compositions. Data in standard units are essential for modelling the gas evolution and the heat and mass transfer through porous media [Citation5]. All three forms of heat transfer, conduction, convection and radiation occur in moulds, when they come in contact with the molten metal during the casting process [Citation6]. Of these three, heat transport by convection is directly related to the ability of gases passing through sand grains, where gas permeability will be a governing factor. This work provides a novel contribution to foundry technology in the form of data for gas-permeability in Darcian units. The novelty of the study is based on applying two different approaches (steady and unsteady states) for the evaluation of gas-permeability results and on the usage of a completely custom-made test unit.
2 Permeability – theory
Darcy performed steady state unidirectional flow experiments to identify a proportionality between the flow rate and pressure difference for flow through porous medium and proposed the Darcy’s law. Darcy’s law provides a proportional relationship between the flow rate, the viscosity of the fluid, and pressure drop over a given distance in a porous medium. If the flow is in the Darcy regime, it is dominated by the viscous effect. If the inertial effect becomes dominant, the flow velocity becomes a non-linear relation. EquationEq. (1)(1)
(1) . is called Darcy’s equation [Citation7–9].
With K, Darcian permeability, the flow behaviour of a porous material can be measured. If gas is considered as a compressible fluid and when the flow regime is non-Darcian, then Forchheimer’s equation needs to be considered. It is because the inertial effect is high, which has to be taken into account. The Forchheimer’s equation is shown below in EquationEq. (2)(2)
(2) [Citation10].
Forchheimer’s equation is derived from Darcy’s equation. When α is assumed to be µ/K and β is set to 0, the Darcy’s equation could be obtained [Citation11]. Permeability of porous medium can be calculated using different methods. The method and approach are determined by several factors like the time taken for measurement, porous structure of the material and accuracy of results. The methods can broadly be classified into two types, steady state and unsteady state. There are other indirect measurement methods that have been implemented in calculating the permeability of materials [Citation12]. Low permeability materials are usually measured using the steady state method [Citation13]. Steady state method is the most widely used approach since it is simple. It refers to the measurement of the pressure drop for a constant flow of inlet air. The reading is noted when the pressure and the flow rate reach a constant value. This constant pressure and flow rate signify saturation of the porous material for that flow rate. The other method is an unsteady or transient approach where the measurements are recorded even when the pressure or mass flow is not constant [Citation14].
In foundry technology, the Darcian equation has been used by many researchers successfully and has measured the gas permeability in different units using either an apparatus such as LPiR1 [Citation15] or standard permmeter. The LPiR1 is an apparatus that is manufactured by Multiserw-Morek and is used to measure the gas-permeability of foundry moulding materials. A number of authors have used this equipment for the testing of foundry cores. Sarek et al. [Citation16] have used this testing apparatus to measure the gas-permeability of ceramic moulds. The pressure difference was kept standard at 0,98 Kpa. The authors concluded that, for prefired samples, the gas permeability increased until a certain number of coating layers and decreased then. Zych et al. [Citation17] used a modified version of LPiR1 apparatus by attaching a mounted tester and studied the effect of solid-phase fraction in liquid ceramic moulding sand on the gas-permeability. The permeability of the sample in the study was measured in two stages. The first stage was to measure after wax melting and the second stage after the annealing process of the mould at 400–1100°C. S. Paz et al. [Citation18] studied the quality of selected bentonites and bentonite mixtures. They studied six different green sand mixtures with different bentonite/bentonite mixtures and assessed the changes in apparent density, gas permeability, compressive strength, and friability. LPiR1 apparatus was used for the measurement of permeability in this study. The authors reported that the gas-permeability of moulding sand increased for moulding material with 2–3% humidity and then decreased. They also note that there is a significant difference in gas permeability based on the type of bentonite mixture. The mixture with the lowest apparent density resulted in the lowest permeability values. All the above mentioned authors have used a one-point approach for the measurements. Winardi et al. [Citation19] measured the volumetric flow rate of air using a modified form of Forchheimers equation. The authors have reported the influence of coating, effect of binder-type binder content, grain fineness number (GFN), and effects of additives on the volumetric flow rate. Winardi et al. used their own setup to study porous material. In other fields of research, the permeability of sand has been measured and reported to be in the range of 2E-11 to 2E-10 m2 [Citation5]. The variation was due to the variation in porosity. However, in foundry applications, sand is rammed and bound by a binder due to which it is expected to have lower gas permeability and also less deviation in the porosity and apparent density. The present study will focus on measuring the Darcian permeability in m2 and utilise the Darcy’s law to measure the flow rate and pressure gradient in several points instead of a one-point approach.
In the metal casting industry, additive manufacturing is used to produce sand cores and moulds. 3D printing involves layered addition of sand and binder. Printed sand cores have several advantages over the traditional ones in terms of mechanical strength and design. This technique is being widely studied by researchers. Svidro et al. [Citation20] studied the heat transfer properties and thermophysical properties of 3D-printed cores. The authors processed the temperature data obtained from a novel measurement technique to study the decomposition characteristics and thermal properties of 3D-printed sand. Sivarupan et al. [Citation21] studied the effects of printing parameters such as recoater speed and print resolution on the properties of the mould samples such as mechanical strength and permeability.
3 Materials and methods
The dimensions of the cylindrical sample applied were in accordance with the DIN standards 50 × 50 mm. Two different materials were investigated in this study. The samples are shown in . The properties and parameters of the samples investigated are presented in .
Table 1. Parameters and properties of the investigated samples
Figure 1. 3D-printed sand sample (a), furan sand sample (b)
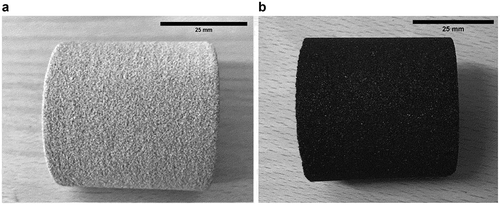
The furan sample was prepared from a Swedish lake sand that is widely used for foundry purposes in Sweden. Sieve analysis was performed on the sand which showed a grain size distribution of multiple (8–9) size fractions between 0,063 and 1 mm. The average particle size was 0,24 mm. The sample contained furfuryl alcohol-based resin and sulphonic acid-based catalyst and was made by conventional manual compaction. The 3D-printed sample was made of single grain size cerabeads, which is an artificial granulous material. The resin used during the additive manufacturing process was phenolic resin. The apparent density of both the samples was set the same. Although the grain shapes of the two sands were known to be different (rounded for cerabeads and sub-angular for silica sand), a separate shape study was not performed.
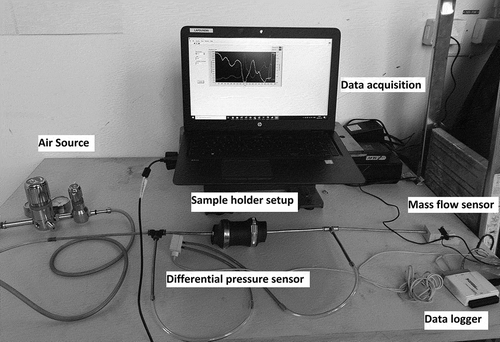
The experimental setup () suitable for room temperature permeability measurements was built up of a sample holder to hold the sand core, airflow tubes, differential pressure sensors, airflow meter, and data acquisition system. The sample was wrapped using a plastic heat shrink tube that provides an air-tight enclosure of the sand core. The tube and the sample were then covered using closing lids on both sides. Air from a compressor was passed through flow tubes and regulated using a pressure regulator and flow valve to control the air flow rate. A differential pressure sensor was placed between the input and the output side of the sample. The pressure sensor was placed at a distance such that entrance and exit defects are not encountered. This sensor measured the pressure difference between a range of 0–2 kPa. The sensor works based on capacitance measurement resulting from the movement of a diaphragm. The flow rate at the outlet end was measured using a flow sensor which has a measuring range of 0–1 m/s of airflow. The flow sensor works based on micro-electromechanical systems. It is capable of detecting low flow rates. The volumetric airflow rate was obtained from the velocity measurements. The pressure was altered in the regulator during each measurement so that there is an increase in the flow rate. After each flow increase, there was a change in the differential pressure between the upstream and the downstream ends. The mass flow sensor in the downstream end measured the flow velocity for each inlet flow rate increase. The flow rate, Q, and the ∆p were found to be in the Darcy flow regime.
Figure 2. Permeability measurement setup
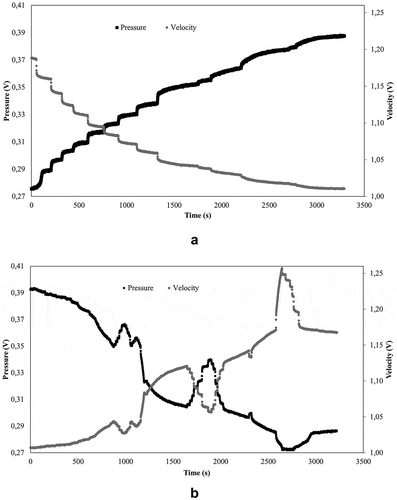
The ∆p vs. flow rate curve indicates a linear relationship, due to which airflow could be considered as an incompressible fluid [Citation22]. The data for pressure and velocity were obtained using two methods. In the first method, using a steady-state approach, data for pressure and flow velocity were obtained only after the sample reaches a constant pressure and velocity. In the next step, inlet flow rate was increased and the next set of data was obtained only after the pressure and flow velocity becomes constant. In the second type of measurement, no time for saturation is given. In this unsteady type of measurement, the increase in the flow rate and the corresponding change in the pressure were analysed. shows the raw data curves obtained for the two types of measurements.
Figure 3. The two types of measurement and calculation approaches. The steady-state type measurement where the recorded pressure and flow velocity were obtained only from the flat portions of the curve (a). Unsteady-state type measurement, where the pressure and flow velocity were obtained for all the points (b)
5 Results and discussion
shows the plot between the Q/A as a function of Δp/L. Here, Q/A, is the volumetric flow rate, calculated from the velocity of the outlet side as a function of the cross-sectional area of the porous foundry core sample. Δp/L is the pressure gradient measured as a function of the length of the porous foundry core sample. Hence, the need for Forchheimer’s equation which will include the inertial effect is ignored. Curve fitting for the obtained data points was performed and the slope was obtained from the first-degree polynomial. A total of five measurements were completed for each sample and the standard deviation for the samples was calculated. The results are presented in .
Table 2. Gas-permeability results calculated based on five measurements for both samples and measurement types
Figure 4. The volumetric flow rate per unit cross-sectional area as a function of the pressure gradient per unit length for the measured samples. Steady-state type measurement for the two samples measured (a), unsteady-state type results (b)
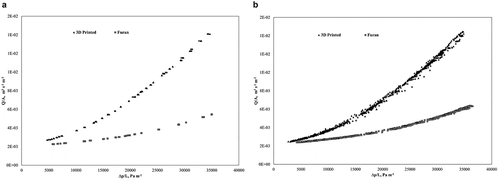
The results showed that the 3D-printed sample is more permeable than the furan sample. The difference in gas permeability is due to various reasons like the difference in the shape of the grains in the two samples investigated. Differences in the grain size distribution (the 3D-printed sample is comprised of a single grain of the size 0,14 mm without finer grains while the furan sand sample with grains as low as 0,09 mm) showed variation in gas permeability. However, the difference between the two samples is not discussed further in this work since the scope was more inclined to discuss the difference in gas-permeability numbers obtained by the different approaches using the Darcy’s law.
In a recently published work, Wisniewski et al. [Citation23] have studied the influence of binder on the gas permeability and porosity of ceramic casting moulds. The authors used their custom-made equipment to measure gas permeability at high temperatures. In their work, they use the Darcy’s law to measure the permeability, and a single-point measurement approach by varying the pressure and study the variation in the flow rate to determine the permeability. In this study, instead of a single-point approach, pressure and flow rates have been measured at a number of points to calculate the results. For the steady state type calculation, approximately 20 data points for the pressure and velocity were considered, while the unsteady state type calculation included a minimum of 500 data points. The data points collected were within the range of the sensors, which is 0–2000 Pa for the pressure and 0–1 m/s for the flow velocity. The more data points available for evaluation, the better will be the accuracy of the slope value, since the slope, µ/K, will determine the permeability of the sample. As a simple tool to compare the nature of resistance to flow, the bulk velocity of the two samples at the same differential pressure could be compared.
Interestingly, the difference in gas permeability for the steady and unsteady state measurements in this study was found to be insignificant for the 3D printed sample, while this difference was more clearer by the furan sample. An explanation for this is that during the steady state measurements, the sample has enough time for saturation of the air inside the core. Conversely, the time for saturation is reduced for the unsteady state measurements. This difference in time taken for saturation determines the difference between the steady and unsteady state measurements. The minor differences between the steady and unsteady state gas permeability numbers for 3D-printed sample are due to the simpler pore structure (owing to the presence of only single size grains). The slightly increased difference in this respect for the furan sample can be explained by the more complex pore structure having a wider range of size fractions.
6 Conclusions
In the present work, the Darcian permeability of traditional furan resin bonded silica sand and 3D printed cerabeads samples bonded by phenolic resin were studied by a custom-made measurement system. As a novel approach in foundry technology, steady- and unsteady-state methods were applied to measure the gas permeability of both samples. The presented approach provides the ability to quantify gas permeability of various foundry sand samples in m2. The main finding of the recent work is, the difference in gas-permeability numbers for the steady and unsteady state measurements within the same type of sand samples. This difference is believed to be originated from the variation in grain size and grain shape in the samples. In order to further clarify the origin of this phenomenon, the pore structure of the studied sand specimens is necessary to be extensively evaluated. The data obtained from the presented research can be directly used for modelling purpose of the gas evolution that occurs during the casting process. The novel test method could be used for further investigations like the effect of grain size distribution, grain shape, and binder type on the permeability of foundry cores or other porous media. The possibility of enhancing this setup to measure permeability at higher temperatures and convective heat transfer coefficient is also being considered.
Nomenclature
Acknowledgements
The present work is part of the synergy project Lean and sustainable design and production of cast iron components. The work was financed by the Swedish Knowledge Foundation. Cooperating parties in the project are Jönköping University, Scania CV AB, Volvo Group Trucks Technology AB, SKF Mekan AB, and SinterCast AB.
Disclosure statement
No potential conflict of interest was reported by the author(s).
References
- Campbell J. Castings. 2nd ed. Oxford: Butterworth Heinemann; 2003.
- Winardi L, Littleton HE, Bates CE. Gas pressures in sand cores. AFS Trans. 2007;115:303–312.
- AFS Mold & Core Test Handbook. 3rd ed. Des Plaines, Ill: American Foundry Society; 2001.
- Ganat T-A-AO. Fundamentals of Reservoir Rock Properties.1st ed.Springer Nature Switzerland AG, Cham; 2020. ISBN 978-3-030-28140-3
- Nield DA, Bejan A. Convection in Porous Media.5th ed. Springer International Publishing AG, Cham; 2017. ISBN 978-3-319-49562-0
- Diószegi A, Diószegi É, Tóth J, et al. Modelling and simulation of heat conduction in 1-D polar spherical coordinates using control volume-based finite difference method. Int. J. Numer. Methods Heat Fluid Flow. 2016;26(1):2–17.
- Lage JL, Antohe BV, Nield DA. Two types of nonlinear pressure-drop versus flow-rate relation observed for saturated porous media. J Fluids Eng. 1997;119(3):700–706.
- Andrade JS, Costa UMS, Almeida MP, et al. Inertial effects on fluid flow through disordered porous media. Phys Rev Lett. 1999;82(26):5249–5252.
- Boomsma K, Poulikakos D. The effects of compression and pore size variations on the liquid flow characteristics in metal foams. J Fluids Eng. 2002;124(1):263–272.
- Forchheimer P. Wasserbewegung durch Boden. Zeits. V. deutsch. Ing. 1901;45:1782–1788.
- Ruth D, Ma H. On the derivation of the Forchheimer equation by means of the averaging theorem. Transp Porous Media. 1992;7(3):255–264.
- Carles P, Egermann P, Lenormand R, et al., Low permeability measurements using steady‐state and transient methods, Paper SCA2007‐07 Presented at the 2007 International Symposium of the Society of Core Analysis, 10–12 Sept, Calgary, Alberta, Canada (2007).
- Liu JF, Wu Y, Cai CZ, et al. Investigation into water retention and gas permeability of Opalinus clay. Environ Earth Sci. 2018;77(5):1–13.
- Christiansen RL, Howarth SM Literature review and recommendation of methods for measuring relative permeability of anhydrite from the Salado Formation at the Waste Isolation Pilot Plant, Sandia report, SAND93-7074, Sandia National Laboratories; Albuquerque, New Mexico (1995).
- https://www.multiserw-morek.pl (accessed on 4th June 2020)
- Sarek D, Trytek A, Nawrocki J. Permeability of mould made by lost-wax casting process. Arch Foundry Eng. 2009;9(1):203–206.
- Zych J, Kolczyk J, Snopkiewicz T. New investigation method of the permeability of ceramic moulds applied in the investment casting technology. Arch Foundry Eng. 2013;13(2):107–112.
- Paź S, Drożyński D, Górny M, et al. Properties of bentonites and bentonite mixtures used in casting processes. Arch Foundry Eng. 2019;19(2):35–40.
- Winardi L, Littleton HE, Bates. CE. New technique for measuring permeability of cores made from various sands, binders, additives and coatings. AFS Transactions. 2005;113:393–406.
- Tóth J, Svidró JT, Diószegi A, et al. Heat absorption capacity and binder degradation characteristics of 3D-printed cores investigated by inverse Fourier thermal analysis. Int J Metalcast. 2016;10(3):306–314.
- Sivarupan T, El Mansori M, Coniglio N, et al. Effect of process parameters on flexure strength and gas permeability of 3D-printed sand molds. J Manuf Processes. 2020;54:420–437.
- Medraj M, Baril E, Loya V, et al. The effect of microstructure on the permeability of metallic foams. J Mater Sci. 2007;42(12):4372–4383.
- Wisniewski P, Sitek R, Towarek A, et al. Molding binder influence on the porosity and gas permeability of ceramic casting molds. Materials. 2020;13(2735):1–13.