
ABSTRACT
Previous research has shown that question characteristics, such as the shape of rating scales, can affect how respondents interpret and respond to questions. For example, earlier studies reported different response distributions for questions employing rating scales in the form of a ladder and in the form of a pyramid. The current experiment, implemented in a probability-based online panel (N = 4,377), re-visits and extends this research by examining how the two graphical layouts (ladder vs. pyramid) affect response behavior and data quality of a question on subjective social stratification. In line with the earlier results, we found that respondents rated their social status lower in the pyramid than in the ladder condition. No differences between the two layouts were found regarding response effort, however, the ladder layout was associated with higher criterion validity. Therefore, we recommend employing the ladder layout when measuring subjective social stratification.
Introduction and research question
Since the early 1980s research on the Cognitive Aspects of Survey Methodology (CASM) has improved our understanding of the cognitive and communicative processes underlying survey responding. Drawing on communication theories (see, for instance, Grice, Citation1975; Sperber & Wilson, Citation1986), researchers have pointed out that understanding survey questions does not only require respondents to decode their semantic meaning, but also to infer their pragmatic meaning. Semantic processes include determining the lexical meaning of words and phrases, whereas pragmatic processes include determining the contextual meaning (Tourangeau et al., Citation2000). Hence, understanding survey questions entails both decoding what they mean and inferring what the surveyor or researcher wants to know.
Figure 1. Screenshot of the question on subjective social stratification with a rating scale in the form of a ladder. Note. We used an optimized survey layout preventing horizontal scrolling and facilitating survey navigation. The screenshot shows the presentation on a PC.
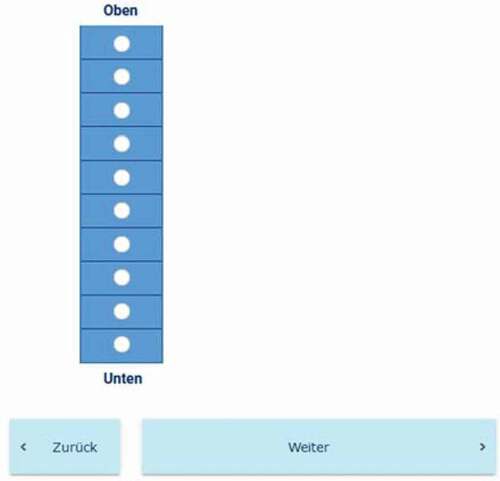
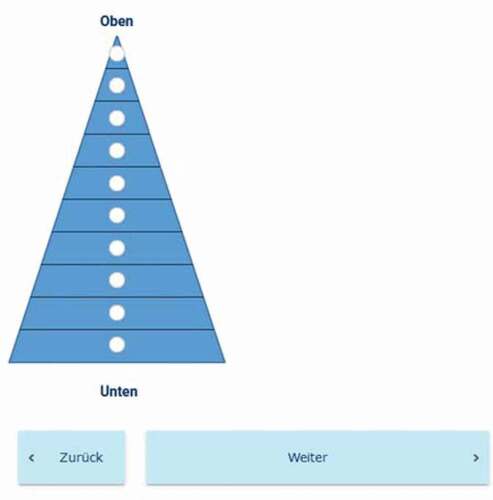
Figure 2. Screenshot of the question on subjective social stratification with a rating scale in the form of a pyramid. Note. We used an optimized survey layout preventing horizontal scrolling and facilitating survey navigation. The screenshot shows the presentation on a PC.
Numerous studies are showing that respondents use the context of survey questions and features of questionnaires, such as the graphical layout of the response categories and numeric values of rating scales when inferring their pragmatic meaning (see Schwarz et al., Citation1998, Citation1991; Smith, Citation1993). Depending on such question and questionnaire characteristics, respondents can arrive at vastly different interpretations of survey questions, affecting response behavior.
Smith (Citation1993) and Schwarz et al. (Citation1998), for instance, investigated how the graphical layout of rating scales influences the answers respondents provide. Examining data from the 1987 International Social Survey Programme (ISSP), Smith (Citation1993) observed a puzzling finding for a question on subjective social stratification. Respondents in nine countries were asked the following question: ‘In our society there are groups which tend to be towards the top and groups which tend to be towards the bottom. Below is a scale that runs from top to bottom. Where would you place yourself on this scale?’ The question was displayed (on a paper questionnaire) with a ten-point, vertically aligned scale that was labeled with ‘top’ and ‘bottom’ at the respective endpoints. In almost all countries, most respondents placed themselves in the middle of the scale. In the Netherlands, however, more than a third of the respondents placed themselves at the bottom of the scale. Arguing that this finding does not match other measures of Dutch society, such as income distributions, Smith (Citation1993) proposed that it was likely the result of a pragmatic response effect. The author found that while the scale was shown as a stack of equal-sized boxes reflecting a ladder in eight of the nine countries, it was shown as a pyramid with the boxes becoming larger from top to bottom in the Netherlands. According to Smith (Citation1993), the Dutch respondents inferred that the graphical layout of the scale (in the form of a pyramid) represented the distribution of the social stratification in the Dutch population (with more people in the lower parts of the scale). This circumstance resulted in a lower subjective social stratification for the Dutch respondents.
Schwarz et al. (Citation1998) built on the research by Smith (Citation1993) and tested his ex-post explanation in an experiment with US college students. Using a survey question on students’ academic performance, they were able to replicate the finding that respondents are more likely to place themselves in the lower part of the scale if it is displayed in the form of a pyramid than in the form of a ladder.
Although the studies by Smith (Citation1993) and Schwarz et al. (Citation1998) provide intriguing examples of the effects of the graphical rating scale layout on response behavior, the authors did not examine the response effort and data quality associated with the two graphical layouts. In this experimental study, we attempt to fill this research gap by answering the following research question: How does the graphical layout of a rating scale (i.e., ladder or pyramid) affect response distributions, response effort measured in terms of response times, and data quality measured in terms of criterion validity? For this purpose, we conducted a web survey experiment in a probability-based online panel.
Method
Experimental design
Respondents were randomly assigned to one of two experimental groups. The first group (n = 2,185) received a vertically aligned rating scale in the form of a ladder (ladder condition). The second group (n = 2,192) received a vertically aligned rating scale in the form of a pyramid (pyramid condition). These two conditions were directly adapted from the studies by Smith (Citation1993) and Schwarz et al. (Citation1998). The Appendix contains screenshots of the two rating scale layouts.
Questions used in this study
Target question
We used the question on subjective social stratification mentioned above, which was taken from the 1987 questionnaire of the ISSP (see also Smith, Citation1993). The question was written in German and was individually presented with a ten-point, vertically aligned rating scale (either in the form of a ladder or a pyramid).
Criterion questions
Three questions on personal income (15 ascending categories), school-leaving qualification (6 ascending categories), and professional qualification (11 ascending categories) were used as criterion measures to evaluate criterion validity.Footnote1 This method has been used in previous research (see, for instance, Höhne & Yan, Citation2020; Yeager & Krosnick, Citation2012). The questions were chosen as criterion questions because they are conceptually relevant to the topic of the target question. In addition, they correlated significantly with the experimentally manipulated target question in the full sample (r > 0.19; p < 0.001). To determine criterion validity, we investigate which one of the two conditions (ladder or pyramid) produces higher correlations between the target question and the criterion questions. The criterion questions were also written in German and used vertically aligned scales with simple radio buttons.
Data
Data for this study were collected in the German Internet Panel, which is part of the Collaborative Research Center 884 ‘Political Economy of Reforms’ at the University of Mannheim. The German Internet Panel is based on an initial recruitment in 2012 and two refreshing recruitments in 2014 and 2018. While the recruitments in 2012 and 2014 are based on a three-stage stratified probability-based sample of the German population, the recruitment in 2018 is based on a two-stage stratified probability-based sample of the German population. For a detailed methodological description of the German Internet Panel, we refer interested readers to Blom et al. (Citation2015).
Sample characteristics
For this study, we use data from wave 48 in July 2020. In total, 4,408 respondents participated in wave 48. Of these respondents, 31 broke off before being asked any study-relevant questions. As a result, 4,377 respondents remain for statistical analysis. On average, these respondents were 52 years old and 48.1% of them were female. In terms of education, 12.9% had graduated from a lower secondary school, 31.1% from an intermediate secondary school, and 52.4% from a college preparatory secondary school or university. Further, 0.8% still attended school or had finished without a diploma and 2.8% reported another degree than mentioned above.
To evaluate the effectiveness of random assignment and the sample composition between the two experimental groups, we conducted chi-square tests. The results showed no significant differences regarding age, gender, and education.
Results
Response distributions
We first examined whether presenting the rating scale in the form of a ladder or a pyramid resulted in different response distributions between the two experimental groups. As shown in , the graphical layout of the rating scales indeed affected the obtained responses with more respondents placing themselves in the lower half of the rating scale in the pyramid condition (57.5%) than in the ladder condition (26.5%). A chi-square test revealed that the difference in response distributions is statistically significant.
Table 1. Response distributions (in percentage) and median response times (in seconds) of the target question on subjective social stratification by experimental condition (ladder or pyramid)
Response effort
In a second step, we examined whether one of the two graphical layouts is easier for respondents to process than the other. Following Lenzner et al. (Citation2010), we used response times as an indicator of the effort required to understand and respond to the question on subjective social stratification. We conducted a non-parametric Mann-Whitney U test to determine median differences between the two experimental groups. As shown in , median response times were only slightly longer in the pyramid condition (21 seconds) than in the ladder condition (20 seconds). This difference is not statistically significant.
Criterion validity
Finally, we examined which of the two graphical layouts is the more valid measure of social stratification (i.e., which response distribution better reflects respondents’ social status). To do so, we investigated the criterion validity of both graphical layouts and compared the strength of the correlations between the target question on subjective social stratification and the criterion questions on personal income, school-leaving qualification, and professional qualification, respectively. The criterion validity analyses were conducted estimating unstandardized OLS regression coefficients.
As shown in , for two out of three cases, the correlations between the target and the criterion questions differed significantly between the two experimental groups. Specifically, the ladder condition produced significantly higher correlations between the target question and the criterion question on school-leaving qualification and between the target question and the criterion question on professional qualification than the pyramid condition (see last column of ).
Table 2. OLS regressions predicting personal income, school-leaving qualification, and professional qualification with subjective social stratification (unstandardized coefficients)
Discussion and conclusion
Extending earlier research by Smith (Citation1993) and Schwarz et al. (Citation1998), this study examined how the graphical layout of rating scales in the form of a ladder or a pyramid affects response distributions, response effort, and criterion validity of a question on subjective social stratification. We found that respondents were more likely to place themselves in the lower half of the rating scale in the pyramid condition than in the ladder condition. This finding replicates previous results reported by Smith (Citation1993) and Schwarz et al. (Citation1998), suggesting that respondents assume the graphical rating scale layout to represent the actual distribution of the social stratification in the population (with the pyramid layout suggesting more people to be in lower social groups).
With respect to response effort, we found that median response times were quite similar in both experimental groups, and thus that none of the two layouts was easier for respondents to process than the other. This finding suggests that both layouts conform with respondents’ expectations of the distribution of social stratification in the population. To put it differently, neither of the two layouts seem to be overly counterintuitive to respondents, which would probably be the case if, for example, the pyramid was turned upside down (suggesting that more people are at the top than at the bottom of society). Of course, this is only an ad hoc explanation which calls for future research.
The criterion validity analyses revealed that employing the graphical layout in the form of a ladder produces higher-quality data than using the pyramid layout. This applies when using school-leaving qualification and professional qualification as criterion measures. Even though personal income was strongly correlated with the target question on subjective social stratification (and thus can be considered a good criterion measure; see ), no differences in validity were found when using this variable as a criterion measure. This is a puzzling finding which calls for more refined research. Concerning the other two criterion measures, it seems that the shift of responses towards the bottom of the scale in the pyramid condition is responsible for the lower criterion validity associated with this graphical layout.
There are two limitations to this study that provide avenues for future research. First, we only examined the effects of the graphical rating scale layout for one question measuring subjective social stratification. Future research could investigate whether and to what extend the graphical layout effects are also observable when using questions on other topics. Second, we only used one indicator for data quality, namely criterion validity. Thus, future research could extend this research by using more or other indicators, such as test-retest reliability.
Our findings have theoretical and practical implications. From a theoretical perspective, we were able to replicate findings by Smith (Citation1993) and Schwarz et al. (Citation1998) more than two decades after the original publications. Moreover, we extended this earlier research in several ways. First, we used a different survey mode (web) than applied in the original studies. Second, we conducted an experiment instead of analyzing secondary data counfounding the graphical layout and country (Smith, Citation1993). Finally, we obtained responses from a probability-based sample instead of a convenience sample of college students (Schwarz et al., Citation1998). All in all, this study supports the notion that respondents systematically use the context of survey questions and seemingly unimportant or formal features of questions when inferring their pragmatic meaning. On the applied side, our findings advocate for employing the ladder layout when measuring subjective social stratification, because this format produces higher-quality data than the pyramid layout.
Acknowledgments
The authors are grateful to Tobias Rettig (University of Mannheim) for his great support during and after data collection.
Disclosure statement
No potential conflict of interest was reported by the authors.
Additional information
Funding
Notes on contributors
Timo Lenzner
Timo Lenzner ([email protected]) is a senior researcher at the GESIS Pretest Lab, GESIS – Leibniz Institute for the Social Sciences. His research interests focus on questionnaire design and evaluation, web surveys, and usability.
Jan Karem Höhne
Jan Karem Höhne (hoehne@uni-mannheim.de) is postdoctoral researcher at the Collaborative Research Center 884 ‘Political Economy of Reforms’ at the University of Mannheim (Germany) and research fellow at the ‘Research and Expertise Centre for Survey Methodology (RECSM)’ at the Universitat Pompeu Fabra in Barcelona (Spain). His research combines survey methodology, psychology, computer science, and data science.
Notes
1. We recoded the scales of all criterion questions from an ascending to a descending direction so that they correspond to the scale of the target question.
References
- Blom, A. G., Gathmann, C., & Krieger, U. (2015). Setting up an online panel representative of the general population: The German internet panel. Field Methods, 27(4), 391–408. https://doi.org/https://doi.org/10.1177/1525822X15574494
- Grice, H. P. (1975). Logic and conversation. In P. Cole & J. L. Morgan (Eds.), Syntax and semantics: Vol. 3: Speech acts (pp. 41–58). Academic Press.
- Höhne, J. K., & Yan, T. (2020). Investigating the impact of violations of the “left and top means first” heuristic on response behavior and data quality. International Journal of Social Research Methodology, 23(3), 347–353. https://doi.org/https://doi.org/10.1080/13645579.2019.1696087
- Lenzner, T., Kaczmirek, L., & Lenzner, A. (2010). Cognitive burden of survey questions and response times: A psycholinguistic experiment. Applied Cognitive Psychology, 24(7), 1003–1020. https://doi.org/https://doi.org/10.1002/acp.1602
- Schwarz, N., Grayson, C. E., & Knäuper, B. (1998). Formal features of rating scales and the interpretation of question meaning. International Journal of Public Opinion Research, 10(2), 177–183. https://doi.org/https://doi.org/10.1093/ijpor/10.2.177
- Schwarz, N., Knäuper, B., Hippler, H.-J., Noelle-Neumann, E., & Clark, L. N. (1991). Rating scales: Numeric values may change the meaning of scale labels. Public Opinion Quarterly, 55(4), 570–582. https://doi.org/https://doi.org/10.1086/269282
- Smith, T. W. (1993). Little things matter: A sampler of how differences in questionnaire format can affect survey responses. GSS Methodological Report No. 78. National Opinion Research Center.
- Sperber, D., & Wilson, D. (1986). Relevance: Communication and cognition. Harvard University Press.
- Tourangeau, R., Rips, L. J., & Rasinski, K. (2000). The psychology of survey response. Cambridge University Press.
- Yeager, D. S., & Krosnick, J. A. (2012). Does mentioning “some people” and “other people” in an opinion question improve measurement quality? Public Opinion Quarterly, 76(1), 131–141. https://doi.org/https://doi.org/10.1093/poq/nfr066