
ABSTRACT
Participatory Theme Elicitation (PTE) is a new approach to increasing user-involvement in qualitative data analysis. In this five-step method, participants independently identify themes in the data using open card sorting, and are supported in their development of a set of themes that reflect all participant views. We describe and evaluate PTE with a case study, where nine lay researchers identified five core themes in qualitative data from an online intervention with depressed adults. Total participation time was approximately 6 hours. Evaluation data revealed high levels of satisfaction with the PTE process and the themes generated. The strong commitment to public engagement in social science research and limited guidance on methods for effective participatory analysis of qualitative data highlight the value and growing need for robust standardised approaches such as PTE.
Introduction
User involvement and collaboration, particularly within social science research, have been building momentum for a number of years. It is now a widely accepted pre-requisite for research funding, and effective involvement of users is recognised as a critical issue for research topics as diverse as health services, child protection and environmental management (Garfield et al., Citation2016; Ives, Damery, Redwod et al. 2012; Cornwall & Jewkes, Citation1995; Van Bijleveld et al., Citation2015). Involving users can generate new knowledge and insight which enriches the quality of research findings (Gamble et al., Citation2014; Hawkins et al., Citation2017) Moreover, the rise of ‘co-production’ as a recognised approach has led to more workable solutions to crucial and complex social issues (Hawkins et al., Citation2017; Osborne, Radnor and Strokosch; Osborne et al., Citation2016; Boyle & Harris, Citation2009). Multiple guidelines have been developed (Involve, Citation2018; Sten. et al., Citation2006).
In practice, engagement is more common during planning and design (Concannon et al., Citation2014) despite emerging research suggesting that involving lay partners within data analysis can be equally beneficial as for other research steps (Garfield et al., Citation2016). Some argue the reasons for this are mainly practical due to the time and financial implications associated with participatory analysis methods (Campbell & Vanderhoven, Citation2016). In addition, there may also be a reluctance on behalf of researchers to share power at such a crucial stage of the process (Julkunen & Ruch, Citation2016).
Common approaches to participatory analysis of qualitative data include some form of team-based coding activity (Flicker & Nixon, Citation2014; Jackson, Citation2008; Stevenson & Taylor, Citation2017; Sweeney et al., Citation2013). In general, lay researchers are trained in the coding process and teams are structured so that everyone has an equal voice regarding analysis and interpretation (Flicker & Nixon, Citation2014; referred to as ‘multiple coding’). Other approaches (e.g., Stevenson & Taylor, Citation2017) do not formally code the data, but instead conduct various activities with users that are designed to organise and interpret qualitative data, such as role plays, handouts and posing specific questions. Supported by careful facilitation, these approaches have enabled lay researchers to contribute differing interpretations that have led to more nuanced analysis. While this demonstrates the value of including lay researchers in qualitative analysis, the barriers surrounding time, cost and the practicalities of training lay individuals remain. In addition, adopting the methods of the academic researchers may automatically privilege the academic perspective within teams comprised of both experienced and newly trained coders.
This paper describes an innovative approach to participatory qualitative data analyses known as Participatory Theme Elicitation (PTE). This approach has five key steps and has been developed to overcome the barriers associated with team-based coding, but still access the different perspectives of lay researchers. PTE uses open card sorting, an established method to collaboratively organise information. In an open sort, the items to be organised are each listed on separate cards. Several sorters each place cards with similar items into piles (see PTE step 3 below for more detail). The piles from each sorter are combined into an overall set of piles (see PTE step 4). While card sorting is most commonly used in information architecture to, for example, organise software menus into categories that are meaningful for intended users (Righi et al., Citation2013), there is little restriction on the type of information or items that can be organised. Of most relevance to qualitative data analysis, open sorts are used to investigate conceptual similarity in psychology (Miller, Citation1969) and as one element of cultural domain analysis in anthropology (Bernard et al 2016, chapter 18).
PTE extends the idea of open sorting in two ways. The first is to use network methods to combine the individual sorts rather than the standard approaches of hierarchical clustering or multi-dimensional scaling with spatial clustering. The second is to embed the sorting in a participatory process so that the lay researchers can modify the themes that emerge from the sort and then guide the interpretation of the agreed themes (see full process, but particularly step 5).
Previous work (Best et al., Citation2017, Citation2019; Yap et al., Citation2020) has demonstrated proof-of-concept, that PTE is an accessible and practical method that can be used with lay researchers to organise qualitative data into themes that may differ from those identified by academic-led analysis. This study develops and evaluates the participatory process of PTE. We use a case study to ground the description, working with a panel of nine lay researchers analysing qualitative data taken from a feasibility randomised controlled trial for adults with depression. The full qualitative analysis, including the PTE outcomes, is described elsewhere (Best et al., Citation2019). The objectives of this study are to:
describe the method of PTE in sufficient detail that it can be adopted by other researchers;
assess whether the PTE method supports the generation of user-developed themes; and
evaluate the acceptability of the PTE method among lay researchers (extending the previous proof-of-concept study that focused on acceptability from the perspective of the academic researchers).
This study does not compare network methods to the existing approaches for combining sorts. Such a comparison requires multiple cases and is therefore deferred until further studies have used PTE. However, the accessibility and acceptability of network methods is examined as part of objective 3. The case study presented uses qualitative data obtained in health research, but the method is independent of the data content and is expected to be useful in any broadly defined social science with an interest in user participation.
Context: The DES Study
Qualitative data used in this project were collected as part of the DES study (Trial Number: NCT03288506). The study was an 8-week online peer-led support group for depression to test the feasibility of video-conferencing software (Skype) to deliver a group-based intervention for depression. Participants were recruited via online registration and the service was promoted through local radio, newspaper and social media.
The data analysed by the lay researchers in this PTE study were gathered at the end of the intervention (Week 8). Two online groups completed the 8-week intervention with semi-structured interviews conducted with five participants and three group facilitators across both groups (n = 8). Interviews were conducted either face-to-face or online (via Skype) and lasted between 20 mins – 45 mins. Audio recordings were taken and these were transcribed verbatim and anonymised.
Methods
The methods described in this section relate to the PTE elements only. Ethical approval for the current study was approved by the University Ethics Committee. PTE is designed to fit within conventional research designs, with little modification needed to support the supplementary components of the approach. The qualitative analysis of the intervention is presented elsewhere (Best et al., Citation2019).
Recruitment
A convenience sample approach (Bryman, Citation2004) was used to recruit lay researchers to undertake the PTE method. This was achieved through contacts at two local mental health charities. Information packs and consent forms were provided to interested individuals. Inclusion criteria for lay researchers were having previous experience of using services for depression and no prior knowledge of the intervention. The academic research team liaised closely with staff in those charity organisations to ensure that potential lay researchers were not actively suicidal and their mental health had been relatively stable for a period of six months or more. Nine lay researchers signed up to take part (n = 9) (see Appendix A). Ages ranged from 20 to 63 years old, with three males and six females. All participants completed secondary level education with three having University degrees.
The PTE process has five key steps (explained below) with lay researchers involved three of the steps, conducted in two workshops. All nine lay researchers participated in the first workshop, and six returned for the second workshop (see Appendix A).
Participatory theme elicitation
PTE implementation involves five key steps delivered in the following sequence: (1) data selection; (2) capacity building; (3) open sorting; (4) data grouping and (5) analysis and interpretation.
Step one: data selection
Recordings from the eight interviews were transcribed verbatim. One member of the academic research team [TMC] initially reviewed each transcript and selected excerpts that could be easily understood as standalone statements. The mechanics of this approach are similar to Lincoln and Guba (Citation1985) ‘cutting and sorting’ method, but no formal coding of data took place during this activity and no conscious effort was made to group data together or select excerpts based on potential significance. The only terms of reference were that the excerpts were broadly representative of the larger dataset. This produced an initial list of 170 anonymised excerpts. This list was then given to a lay project advisor [CC] with lived experience of depression and, together with TMC, they reviewed and narrowed this list to a final set of 49 excerpts (see Appendix B for full list of excerpts, with reference codes ID01 – ID49). The decision to limit the number of excerpts was based on several factors, including previous user feedback regarding PTE sorting and the potential for participant fatigue.
Step two: capacity building
The academic research team developed two, 60 minute training sessions including (1) an overview of the online intervention and research project; (2) a brief overview of qualitative and quantitative research; (3) an overview of PTE and user involvement within research and (4) sorting techniques used to group data together. These sessions were delivered back-to-back with a short break. Lay researchers were not all available on the same day and therefore this session was conducted on three occasions (two group-based sessions and one individual session).
Training sessions were designed to be interactive and included short videos and other media. Images as well as excerpts were used to demonstrate possible sorting techniques for the analysis of qualitative data. For example, lay researchers were provided with images of different products and asked to sort these into groups by similarity; some categorised by colour, and others by food groups such as fruit or vegetable. After completion of sample exercises, discussion took place regarding the subjective nature of qualitative research and analysis.
It is also important to note the differences between capacity building activities within PTE and formal research methods training. The latter has been associated with what Ives et al. (Citation2013) refer to as the ‘professionalization paradox’ in mind. This is a process whereby the lay researcher achieves some level of professional socialisation through in-depth training. As such, their position as a lay researcher is undermined. In contrast, for PTE, the training is limited, explicitly focusing on the validity of different approaches to sorting to promote confidence in the sorting task (step 3) and participation in the discussion (step 5).
Step three: open sorting
In the third step, lay researchers independently sort the excerpts into piles (see ). This step is partially informed by other qualitative open sorting and grouping methods (see Jackson, Citation2008; Lincoln & Guba, Citation1985; Rosenberg & Park, Citation1975; Sayles et al., Citation2007). The 49 excerpts chosen as part of the data selection process were provided in information packs given to lay researchers when they arrived. The packs also contained a project information sheet, consent form, an evaluation form and blank sheets of paper to create pile labels. Instructions were to sort the excerpts into piles, based on similarity, using whatever criteria they found relevant (Rosenberg & Park, Citation1975) with a minimum of two piles. Participants were further instructed that excerpts that cannot be grouped (placed) with others are to be placed in their own pile rather than create a ‘miscellaneous’ pile. No further instructions were given as researchers were cautious that over instruction may limit or constrain analysis (Garfield et al., Citation2016). Lay researchers sorted independently, with no influence on each other’s sorting. Members of the academic research team were available to clarify any questions regarding excerpts but did not offer opinions or interpretation. A PowerPoint slide containing task instructions was visible throughout. This task was completed by the lay researchers in the same workshop as their capacity building.
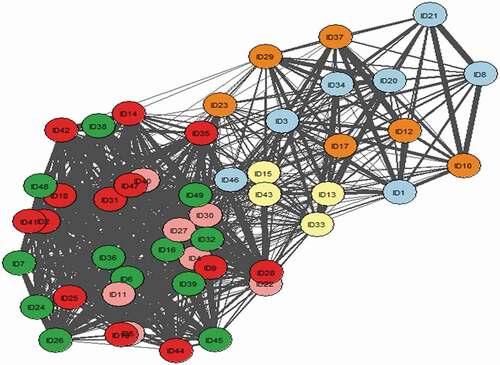
Figure 1. Network diagram: The network of excerpts (shaded circles), with the thickness of the edge indicating the number of so-researchers who sorted the pair of excerpts into the same pile. The colour indicates groups identified in Step 3: Group 1 (light blue); Group 2 (green); Group 3 (pink); Group 4 (red); Group 5 (yellow) and Group 6 (orange).
After sorting was complete, each lay researcher had between 3 and 12 piles of excerpts. These piles were labelled by the lay researcher who conducted the particular sort and stapled together (see Appendix C).
Step four: data grouping
The objective of the data grouping step is to construct a set of piles that, to the extent possible, reflects the consensus between the separate sorts in step 3. Piles from each member were recorded and uploaded into a Microsoft Excel spreadsheet by PB who was not involved in initial data selection. The spreadsheet columns are (1) anonymised lay researcher; (2) the excerpt ID reference code and (3) the pile (an example is provided in Appendix D).
A similarity score was calculated for each pair of excerpts that simply counts the lay researchers (out of 9) who had placed the pair of excerpts into the same pile. A network was constructed with nodes to represent excerpts and edges for any non-zero similarity score (that is, at least one lay researcher placed the two excerpts in the same pile). The similarity score was converted into a distance weight by taking its inverse.
In network science, community detection algorithms are established methods to identify clusters within the network where there is a relatively high edge density, with relatively few edges between two clusters (Fortunato, Citation2010). For the purposes of PTE, such clusters indicate agreement between lay researchers that some group of excerpts are sufficiently similar to be placed in the same pile and different from excerpts placed in other piles. For this application, we used algorithms that are able to take into account the distance weight for each edge (referred to as weighted community detection in the network science literature) so that the excerpts that are placed together by more lay researchers are more likely to be placed together in the proposed groups. In addition, the excerpt that is ‘most close’ to all others was identified for each group. This is the excerpt with the shortest average (weighted) path to all other excerpts and is a common measure of centrality. All network analysis was conducted using the igraph package in R (Csardi & Nepusz., Citation2006; R Core Team, 2015).
Initially, the Louvain algorithm (Blondel et al., Citation2008) identified four communities. However, one of the communities was relatively large and the edge betweenness approach (Girvan & Newman, Citation2002) was used to break it into three smaller groups. This resulted in six groups, displayed at displayed at figure 2. The number of excerpts contained with each group ranged from 4-13 (see Appendix E).
Step five: data analysis and interpretation
Two weeks after data sorting was complete, six (of the original nine) lay researchers returned to undertake the final part of the PTE process, development of themes in the qualitative data excerpts. The three remaining lay researchers could not attend for the following reasons – family-caring responsibilities (n = 1), illness (n = 1) and work commitments (n = 1). On arrival, each lay researcher was provided with a copy of the network diagram, an information pack containing the six network groupings, a pen and a notepad. After describing the network information, academic research team members read out all of the excerpts contained within each group and asked if any further clarity was needed on the analysis task. Flipchart paper was also provided and the session was audio recorded.
The network information comprised:
A proposed set of six core groupings based on the combined results from lay researcher pile sorting during Step Three;
Identification of the central excerpt within each grouping; and
Visual representation of relationships between excerpts (see )
As PTE is designed as a user-based approach to qualitative data analyses, numerical data regarding exact distances excerpts and other detailed information were not provided. However, lay researchers were advised that this information could be interpreted (visually) from the network diagram itself e.g., strength of relationship between excerpts could be extrapolated through their proximity to each other and the thickness of lines between excerpts. The strength of groups could be interpreted through compactness of the excerpts within a group and separation from excerpts in other groups. Themes were described to lay researchers as something ‘important about the data in relation to the research question, and represents some level of patterned responses or meaning’ (Braun & Clarke, Citation2006, p. 82).
Lay researchers proceeded to discuss relationships and possible themes within each individual grouping using the network diagram and groups as a starting point. Academic research team members recorded key points, codes and developing themes on flipchart paper as well as any other information lay researchers felt were relevant, but did not provide opinions or interpretation. Lay researchers reviewed and discussed each group separately in numerical order (which is arbitrary). Once this was completed, they debated possible outliers and refined themes further. No time limit was set for data analysis and interpretation, which was completed over a two-hour period. This was followed by a final 15 minute group interview discussing the acceptability/value of this approach.
Evaluation of participatory theme elicitation
For the evaluation of PTE, semi-structured group interviews (10–15 minutes) were conducted at two separate time points during the PTE method (post Step 3 and Step 5). As the capacity building and data sorting sessions were run on three separate occasions, there were three separate post Step 3 interviews. During these interviews, feedback was sought on the sorting task and training provided e.g., (1) general understanding of sorting task; (2) suitability of excerpts; (3) number of excerpts and; (4) content of training. The final group interview (n = 1) took place immediately after data analysis (Step 5) and included all six lay researchers who had participated in the data analysis step. Feedback taken here related to the data analysis process (length, acceptability, usefulness of network diagram and groupings) as well as the PTE method in its entirety.
A short 10-item questionnaire was also administered to supplement interview data following Step 3. The questionnaire sought specific information regarding the training materials, sorting task and background of lay researchers and included questions relating to – (1) duration of training, (2) length of excerpts, (3) number of excerpts, (4) understanding of sorting task and (5) information provided (see Appendix F).
Results
User Generated Themes
Lay researchers produced five core themes about the depression intervention using the PTE method. These included; (1) challenges of using the online service; (2) benefits of accessing an online service; (3) role of technology in facilitating help-seeking; (4) therapeutic processes and outcomes within an online context and; (5) service improvements. As a result, thematic relationships were identified within five of the six groups produced via network analysis techniques during Step Four. Appendix G has a brief summary of the excerpts used to develop themes within each grouping.
Lay researchers developed multiple themes and sub-themes within Groups 1, 2, 3, 4 and 6 however, no thematic relationship was identified within Group 5. Instead, Group 5 excerpts (if relevant) were used to support themes in other groups. Lay researchers also felt that some of the excerpts contained within Group 3 (ID04, ID11 and ID30) were equally relevant to themes developed within Group 2. As such, while the final groups largely reflect the proposed groupings (produced at Step Four), some changes were made by lay researchers. This indicates that lay researchers felt comfortable using PTE to support rather than dictate the analysis process. Full discussion of the thematic content generated during this task and its contribution to knowledge of online services for depression is outside the remit of this article and is presented elsewhere (Best et al., Citation2019). However, the following example, taken from Group 1, highlights the processes through which lay researchers developed themes using PTE.
The theme development (Group 1 example)
Lay researchers began by reviewing the network diagram (light blue dots) as academic research team members read out Group 1 excerpts (). Network data revealed ID03 was identified as the most central. Each lay researcher spent a few minutes working independently identifying patterns and generating ideas based on the excerpts contained within Group 1 and cross-referencing this with the network diagram. Group discussion then took place organically with little prompting from academic research team members.
Table 1. List of group 1 excerpts
It was noted early on that ID20 and ID34 were (visually) the closest together within the group and that they both appeared to relate to group attendance. This gave lay researchers early confidence in the usefulness of the network diagram. A single, over-arching theme (challenges of using the online service) was generated fairly quickly and confirmed through the central excerpt (ID03) which stated ‘the technology was just a wee bit of an issue, but … I think resolved itself because when [we] moved into an office in our building where we have a good system’. Lay researchers used all three pieces of network data available (i.e. grouping, diagram and central excerpt) to develop this theme. Later on, lay researchers added an additional excerpt under this theme (ID10) that was contained in another grouping (Group 6). This was justified mostly through the content of the excerpt itself e.g., ‘I just think that the technology got in the way a little bit because, if you’d be talking to someone, there’d be a little bit of feedback … when you’re not there to pick up on non-verbal cues as easily, it can be a little bit challenging’ (ID10). However, its inclusion was also supported through the network diagram which showed a direct relationship (edge) between ID10 and ID21, which was located in Group 1. The thickness of the line between excerpts was also noted and discussed by lay researchers as further justification for its inclusion.
It is important to note that while PTE is designed to offer a hybrid approach to the user analysis of qualitative data, the extent to which the network data available is used to inform theme generation is at the discretion of the lay researchers. In most cases, lay researchers relied heavily on this for guidance but as confidence grew this was not always the case. For example, later in the session, lay researchers returned to Group 1 and developed three specific sub-themes – (a) technical issues of physically using the service (b) barriers to communication (in-group) and; (c) increased sense of self-awareness. The latter sub-theme (increased sense of self-awareness), was revisited on several occasions and caused much discussion among the group. The debate mainly centred upon whether this sub-theme could be discredited or confirmed using the network diagram and whether, as lay researchers, they should interpret the excerpts based on surface-level meaning (explicit) or whether they should ‘read between the lines’ (interpretative). Members of the academic research team did not offer any opinion on this issue apart from acknowledging that the group were free to interpret the data in whatever way they saw fit. As such, this provides an interesting, real life, example of theory generation supported by, but not dictated by, the PTE method. This sub-theme was developed from three main excerpts – ID21, ID34, ID46.
Initially, the group decided to code this as ‘group composition’ but suggested that they return to it later in the session. When this occurred, one lay researcher discussed how the cluster of excerpts within this sub-theme reminded him of the individuality and sense of ‘presence’ that one must feel when taking part in an online group (particularly given the geographical distance between users). This observation generated more discussion, whereby lay researchers reflected upon their own experiences of group therapy and related it to the qualitative data. There was a sense that one could feel very much ‘under the spotlight’ when it was their turn to speak as they knew that others would have to watch intently to pick up non-verbal cues (ID21). It was postulated that it might also cause some group users to look for relatable features in others in order to feel comfort (e.g., males – ID34).
Interestingly, rather than theorising the wider implications in relation to the literature (e.g., social presence theory etc.), (Short, Short et al., Citation1976) lay researchers reflected upon their own experiences of group therapy and thus provided a level of ‘insider’ knowledge that would have been otherwise absent. There was some acknowledgement that additional data were needed to fully support this finding – particularly as the network diagram placed these excerpts furthest apart from each other (suggesting a weaker relationship). It was also noted that the links between ID46 and the others appeared to be moderated through ID03 and therefore the network diagram could not fully support this conclusion. Nonetheless, they were keen for its inclusion within the analysis and this is perhaps indicative of the confidence generated from taking part in earlier PTE steps (capacity building and sorting).
Evaluation of the PTE method
Feedback on the PTE method was positive with interview data suggesting that as lay researchers progressed through the various steps, their interest in the DES study increased, for example, ‘I now understand more about what you guys are doing … .I’m now even more interested in this’ [lay researcher 3]. One lay researcher also stated, “I found it very intense but was surprised how engaged I remained throughout [lay researcher 5]. A sense of ownership also began to emerge as the lay researchers saw value in what they were doing – ‘I was looking forward to coming back and seeing how it all came together’ [lay researcher 2]. It was noted that by presenting excerpts in smaller groups it felt less ‘daunting’ as it ‘was easier to review 6 or 7 quotes together than try to keep all 49 in your head’ [lay researcher 5]
Questionnaire data revealed that lay researchers felt the training (Step 2) was pitched at an appropriate level (Appendix B). Six lay researchers rated the information and training provided as ‘excellent’ with three rating it as ‘very good’. The number of excerpts presented during the sorting task was also rated as ‘just right’ with qualitative data revealing that lay researchers were cautious regarding increasing this number further. In terms of improvements, it was suggested that some additional examples of the sorting task using ‘test data’ would be beneficial. There was also a sense that the sorting task itself was a key part of the training and this increased confidence in the quality of data analysis during Step 5. For example, one lay researcher stated, ‘it would have been very difficult to do this bit [analysis] if we hadn’t had done the sorting’ [lay researcher 3]. It was also suggested by some that the entire PTE process could be performed within a single day. The rationale was that the data would be ‘fresher’ in their minds.
The network diagram and groupings given to lay researchers at the beginning of Step Five provided a useful starting point for user-led analysis. Moreover, it prevented a single individual from monopolising the group or imposing their views on others. One lay researcher commented that ‘if we hadn’t of done that I probably would have just sat and agreed’ [laughing] [lay researcher 4]. Interestingly, lay researchers felt that the group discussion greatly improved the quality of analysis. One lay researcher noted that ‘the second part (discussion) has helped to make the final themes better’ [lay researcher 2]. This was supported by others e.g., ‘sub-themes are more defined than when I completed the sorting task’ [lay researcher 7]. Reflecting upon the added value of group analysis, one lay researcher noted how his views and ultimately the themes changed and evolved as time went on,
“it’s really interesting when you’re getting other people’s perspectives, rather than just sitting in your own wee bubble … when you hear someone’s perspective it can make the quote speak to you in a different way than you hadn’t thought of” [lay researcher 3].
Views on the facilitation provided by members of the academic research team were also positive. Lay researchers felt that it helped keep the session ‘on track’ and provided independent moderation of discussion. There was no (reported) sense that academic research team members influenced the generation of themes – “you need a bit of leadership otherwise it would have taken much longer … but I feel like we came up with the themes ourselves [lay researcher 3].
Discussion
Objective 1: describe the method of PTE in sufficient detail that it can be adopted by other researchers
The authors have described all five steps contained within the PTE method. A case example of qualitative data analysed using PTE has been presented as well as feedback taken from lay researchers involved throughout the process. No concerns were expressed by lay researchers or by members of the academic research team regarding the implementation of open sorting or network analysis within a wider participatory process. Appendix H includes further details of the PTE protocol.
Most of the steps are straightforward. However, the grouping (step 4) requires specialist skills in network analysis. In order to make the method accessible to any researcher, the authors have developed an online platform to easily produce the network diagram (available at www.ptegroups.net/main). Researchers with no experience of network analyses can upload a spreadsheet in the appropriate format, and the website will construct the weighted network and apply the selected community detection algorithm. The network diagram and groups can then be downloaded.
Objective 2: to assess whether the pte method supports the generation of user-developed themes
The example given above demonstrates the process through which lay researchers, using the PTE method, were supported to develop their own themes. Broadly speaking, the thematic content developed using PTE was similar to previous and current literature in the field (Griffiths et al., Citation2012; Mallow et al., Citation2016), supporting the validity of this approach. Moreover, there were some interesting observations and unique insights confirming the ‘added value’ of user involvement in data analysis. Core themes suggested that participants who took part in the online intervention found it largely beneficial. This was mainly due to ease of access, quality of facilitation and a reduced sense of anxiety from being able to link in from a familiar environment. Themes were developed from five of the six groups presented to lay researchers suggesting that network analysis techniques applied during Step 4 produced relevant groups.
At the beginning, lay researchers relied heavily on the network groupings in order to develop thematic content. It was noted that having a smaller number of excerpts narrowed the focus of discussion and prevented lay researchers from feeling overwhelmed. The network data provided lay researchers with a framework with which to generate discussion based on observable data. The diagram offered further opportunity to debate possible relationships and discuss the strength of connections between excerpts (e.g., distance apart or thickness of adjoining line). Lay researchers were informed at the beginning of Step 5 that the diagram represents the best ‘mathematical fit’ following the sorting task and that there was no expectation that they form themes from within these groups. That being said, the network analyses did, in fact, produce some common thematic groupings (e.g., themes developed within five of the six groups and only a small number of excerpts were re-allocated). Together with the six network groupings, the information provided enabled members of the academic research team to take a ‘back seat’ as lay researchers had sufficient information in which to generate discussion without researcher prompting.
It is also important to note that the network diagram delivered a mixed picture whereby groups appeared scattered and dispersed – perhaps indicating level of disagreement among lay researchers during sorting. Nonetheless, lay researchers were still able to use the visual information provided to confirm/challenge potential relationships within groups (e.g., sub-themes). In the example given above, lay researchers ultimately chose to rely more on their own experiences to interpret the meaning behind the generated theme (increased sense of self-awareness); however, the network diagram was a focal point of this discussion wherein they debated the validity of this theme (e.g., no direct connection within the group – ID21 to ID46). As time progressed and confidence grew, lay researchers used the network data to confirm their decisions regarding a possible theme rather than dictate it. On previous occasions (Best et al., Citation2017) the network diagram has produced more defined groups; however, the extent to which this has influenced the development (and quality) of generated themes is unclear.
A key goal of PTE is to provide a ‘robust, accessible and reproducible approach to user involvement in data analyses’ (Best et al., Citation2017, p. 18). However, it is also important that PTE provides sufficient room for flexibility so as not to directly influence outcomes. Lay researchers in this study adopted a variety of approaches in order to make sense of the data. The most interesting of which occurred when they used excerpts across the different groups to support themes. This meant that generated themes had more ‘evidence’ in which to support their existence. Often, initial ideas were developed and expanded through group discussion. This provided a useful layer of scrutiny for each new theme.
While PTE is informed by the literature on qualitative data analysis (Saldana, Citation2016), it does not seek to replicate complex methodological procedures and apply them to end-user populations. Rather the goal is to provide a specific framework for data analysis (Morse, Citation2015) in which themes can be developed in a manner accessible to those with little or no formal training. However, key stages and techniques are still identifiable with the PTE method when one examines the process more closely. For example, capacity building during Step 2 provided the context for coding and theme generation during Steps 3 and 5 by giving a detailed overview of the research study. In addition, descriptive coding (Saldana, Citation2016) is evident during Step 3 when lay researchers are encouraged to identify ‘similarities and differences in the data’ (Castleberry & Nolen, Citation2018: 808) and assign labels to excerpts as a process of organisation (see ). Finally, Step 5 provided an opportunity for the data (e.g., groups of codes) to be thematically organised and contextualised through shared discussion and debate among those with lived experienced. While PTE simplifies the analysis process for end-user populations, the extent to which the loss of complexity is compensated by the insider knowledge of lay researchers is unknown and subject to further study. It may well be that PTE is more suitable for particular types of studies, such as intervention-based process evaluations where the focus is geared toward information that can be garnered at a semantic, rather than latent level of coding (Braun & Clarke, Citation2006).
Objective 3: to evaluate the acceptability of the pte method among lay researchers
Findings suggest that PTE is both an acceptable and credible approach to user-led participatory analysis. Lay researchers did not report feeling overburdened during the process and there is some evidence to suggest that motivation actually increased as time went on. The network diagram and initial groupings provided a useful starting point that increased focus and reduced reliance on researcher input or facilitation. Moreover, it lessened the impact of a smaller number of individuals imposing their views on others.
There is also some preliminary evidence to suggest that PTE facilitated lay researchers to go beyond semantic level descriptions by reflecting upon their own experiences. This is an important point as the specificity behind this, often touted, benefit of user participation is seldom demonstrated within the wider literature. Of course, this also introduces a risk that the themes reflect lay researcher experience rather than arising from an analysis of the data. Evaluating acceptability of the PTE method also highlighted the following potential outcomes -
Reduced researcher influence over the participatory analysis process
A good starting point for individuals with no training or background in qualitative data analyses
Provides support for user-led theme generation
An accessible and time-limited alternative to other participatory analyses methods
Overall, feedback suggests the five-step PTE approach was acceptable for lay researchers. The number of excerpts used and length of time set aside for capacity building, sorting and analysis was also found to be appropriate. Flexibility should be encouraged within the data analysis stage and lay researchers should be made aware than the network groupings and diagrams are for guidance purposes only.
Strengths and limitations
While card sorting methods have been used in participatory qualitative data analysis, the practice is not widespread. One existing method (Stevenson [REF]) has the lay researchers sort and group through discussion. The individual sorts of PTE and network analysis construction of initial groups ensure those groups represent the perspectives of all lay researchers equally. It is also considered that the process could easily be adapted for virtual delivery, thus increasing its accessibility. As such, this study is both novel and innovative. Nonetheless, there are several potential limitations.
The study provided a relatively limited number of excerpts to lay researchers and this may have unintentionally narrowed the number of themes and limited the depth of analysis. Efforts were made to mitigate this by involving a lay project advisor (and service user) in data selection and selecting diverse excerpts.
Further, one selection criterion for excerpts was that they could stand alone and, when used in the sorting, these excerpts were presented as independent sentences. This approach separates the excerpts from their context and raises the possibility that the lay researcher interpretation of an excerpt is different than what was intended in the source material.
The number of lay researchers involved could be expanded. However, one must consider the impact that increased numbers may have on data analysis (Step 5) in regards to timing, group facilitation etc. Only six individuals who completed Step 3 (sorting) were available at Step 5 (analysis). As such, all views may not have been fully represented. Moreover, the suitability of PTE within non-intervention-based research designs is yet to be tested.
Finally, the network-based community detection algorithms used in this study were selected as they are popular in the social networks literature. However, there are many algorithms available and the network of excerpts represents a different type of relationship than is typical in social networks. Further research is required to compare the clusters generated by different algorithms and assess whether specific algorithms are more or less appropriate for PTE grouping.
Conclusion
In conclusion, lay researchers described the PTE method as accessible and enjoyable with participation time approximately 5–6 hours in total. The method should therefore appeal to a wide range of researchers seeking to improve or introduce user-led analyses and perspectives within their work. This is particularly true of qualitative data generated through intervention-based evaluations as opposed to research exploring individuals’ lived experiences, where the use of excerpts could remove important contextual information. The data presented here also demonstrate how open card sorting and network analysis methods can be successfully incorporated into a participatory framework. Further iterations of PTE would do well to include some additional modelling to strengthen the robustness of the community detection algorithms. This process would also benefit from an increased number of users applying the PTE method. It would also be useful to assess the acceptability of PTE from a researcher/academic perspective – particularly in regard to accessibility, cost, implementation and value.
However, we do not seek to turn this important process into a mechanical approach that is overly manualised, process-driven and ultimately meaningless. We are also conscious of those who are wary of involving ‘machines’ in qualitative-based research and are reminded of the words of Bernard and Ryan (Citation2010: 73) – ‘ultimately, we [humans] are responsible for all analysis … computer based content … [will] just be another tool that will (1) make the analysis of qualitative data easier; and (2) lead to much wider use and appreciation of qualitative data in all the social sciences’. The main goal of PTE is to provide a practical and flexible approach to increasing user-involvement in qualitative data analysis that can be easily incorporated into current research designs (principally those that are intervention-based) and reduces the potential for researchers to influence the process. Moreover, PTE adds value by enabling a broader range of perspectives on the data collected, thereby enriching the analysis and contributing to the rigour of the research. While the study presented here was conducted in the context of health research, the method is sufficiently general to be used in other social science disciplines seeking to involve lay researchers in the qualitative analysis process.
Disclosure statement
There are no relevant financial or non-financial competing interests to report.
Additional information
Funding
Notes on contributors
Paul Best
Dr Paul Best is the founder of the Immersive Technologies and Digital Mental Health Network within the School of Social Sciences, Education and Social Work at Queen’s University Belfast (QUB). He is a qualified social worker, cognitive behavioural therapist and Programme Director (UGR) for Social Work at Queen’s University, Belfast. His primary research interests relate to the use of immersive technologies in the treatment of mental health conditions as well as participatory approaches to data analysis. Email: [email protected]
Jennifer Badham
Dr Jennifer Badham is an applied mathematician with a background in health policy. Her research uses agent-based modelling, social network analysis and other complex systems methodologies to understand the ways in which individual decisions, social structure and social phenomena mutually influence and constrain each other. Email: [email protected]
Tracey McConnell
Dr Tracey McConnell is a Marie Curie Senior Research Fellow, School of Nursing and Midwifery at Queen’s University Belfast. Her research has focused on improving mental health outcomes and improving palliative and end-of-life care for patients and their families. Tracey’s methodological expertise includes mixed-method realistic reviews/evaluation to help identify what works, for whom, and in what circumstances when designing, implementing and evaluating complex healthcare interventions. Tracey also has methodological expertise in Randomised Controlled Trials. Email: [email protected]
Ruth F Hunter
Dr Ruth F Hunter is a Reader (Associate Professor) in Public Health at the Centre for Public Health at Queen’s University Belfast. Her research has focused on health behaviour change and social network analysis. Email: [email protected]
References
- Bernard, R. H., & Ryan, G. W. (2010). Analysing qualitative data: systematic approaches. SAGE Publications. 9780761924906.
- Best, P., Badham, J., Corepal, R., O’Neill, R., Tully, M., Kee, F., & Hunter, R. (2017). Network methods to support user involvement in qualitative data analyses: an introduction to participatory theme elicitation. Trials, 18(559). 1–14 https://doi.org/https://doi.org/10.1186/s13063-017-2289-5
- Best, P., McConnell, T., Davidson, G., Badham, J., & Neill, R. (2019). Group based video-conferencing for adults with depression: findings from a user-led qualitative data analysis using participatory theme elicitation. BMC Research Involvement and Engagement, 5(1). 1–11 https://doi.org/https://doi.org/10.1186/s40900-019-0173-z
- Blondel, V. D., Guillaume, J.-L., Lambiotte, R., & Lefebvre, E. (2008). Fast unfolding of communities in large networks. Journal of Statistical Mechanics: Theory and Experiment, 10. DOI: https://doi.org/10.1088/1742-5468/2008/10/P10008
- Boyle, D., & Harris, M. (2009). The challenge of co-production. New Economics Foundation.
- Braun, V., & Clarke, V. (2006). Using thematic analysis in psychology. Qualitative Re-search in Psychology, 3(2), 77–101. https://doi.org/https://doi.org/10.1191/1478088706qp063oa
- Bryman, A. (2004). Social research methods (2nd ed.). Oxford University Press.
- Campbell, H., & Vanderhoven, D. (2016). Knowledge that matters: Realising the potential of co-production. In Report. 1–70. N8 ESRC Research Partnership.
- Castleberry, A., & Nolen, A. (2018). Thematic analysis of qualitative research data: Is it as easy as it sounds? Currents in Pharmacy Teaching & Learning, 10(6), 807–815. https://doi.org/https://doi.org/10.1016/j.cptl.2018.03.019
- Concannon, T. W., Fuster, M., Saunders, T., Patel, K., Wong, J. B., Leslie, L. K., & Lau, J. (2014). A systematic review of stakeholder engagement in comparative effectiveness and patient-centered outcomes research. Journal of General Internal Medicine, 29(12), 1692–1701. https://doi.org/https://doi.org/10.1007/s11606-014-2878-x
- Cornwall, A., & Jewkes, R. (1995). What is participatory research? Social Science & Medicine, 41(12), 1667–1676. https://doi.org/10.1016/0277-9536(95)00127-S
- Csardi, G., & Nepusz., T. (2006). Complex Systems. In The igraph software package for complex network research. 1695. 1–9: 190
- Flicker, S., & Nixon, S. (2014). The DEPICT model for participatory qualitative health promotion research analysis piloted in Canada, Zambia and South Africa. Health Promotion International, 30(3), 616–624. https://doi.org/10.1093/heapro/dat093
- Fortunato, S. (2010). Community detection in graphs. Physics Reports, 486(3–5), 75–174. https://doi.org/https://doi.org/10.1016/j.physrep.2009.11.002
- Gamble, C., Dudley, L., Allam, A., Bell, P., Goodhare, H. Hanley, B., Preston, J., Walker, A., Williamson, P and Young, B. (2014). Patient and public involvement in the early stages of clinical trial development: A systematic cohort investigation. British Medical Journal (BMJ) Open, 4, 7 e005234. DOI: https://doi.org/10.1136/bmjopen-2014-005234
- Garfield, S., Jheeta, S., Husson, F., Jacklin, A., Bischler, A., Norton, C., & Franklin, B. D. (2016). Lay involvement in the analysis of qualitative data in health services research: A descriptive study. In BMC Research Involvement and Engagement (pp. 2).
- Girvan, M., & Newman, M. E. J. (2002). Community structure in social and biological networks. Proceedings of the National Academy of Sciences, 99(12), 7821–7826. https://doi.org/https://doi.org/10.1073/pnas.122653799
- Griffiths, K., Mackinnon., M., Crisp., A., . J., Christensen, H., D., . A., ., Bennett, K.,and Farrer, L.. (2012). The effectiveness of an online support group for members of the community with depression: a randomised controlled trial. PLoS ONE, 7(12), e53244. https://doi.org/https://doi.org/10.1371/journal.pone.0053244
- Hawkins, J., Madden, K., Fletcher., A., Midgley, L. Grant, A., Cox, G., Moore, L., Campbell, C., Murphy, S., Bonell, C., and White, J. (2017). Development of a framework for the co-production and prototyping of public health interventions. BMC public health, 17: 689.
- Involve. (2018). Guidance on co-producing a research project. http://www.invo.org.uk/wp-content/uploads/2018/03/Copro_Guidance_Mar18.pdf
- Ives, J., Damery, S., & Redwod, S. (2013). PPI, paradoxes and Plato: Who’s sailing the ship? Journal of Medical Ethics, 39(3), 181–185. https://doi.org/https://doi.org/10.1136/medethics-2011-100150
- Jackson, S., . F. (2008). A participatory group process to analyze qualitative data”. progress in community health partnerships. Research, Education, and Action 2008). :, vol. 2 no. 2, pp. 161–170. https://doi.org/https://doi.org/10.1353/cpr.0.0010
- Julkunen, I. H. G., & Ruch, G. (2016). Relationship-based research in social work: Understanding practice research. In G. Ruch & I. Julkunen (Eds.), Getting to the heart of relationships in social work research in practice (pp. 217–224). Jessica Kingsley Publishers.
- Lincoln, Y. S., & Guba, E. G. (1985). Naturalistic Inquiry. Sage.
- Mallow, J., Petitte., A., Narsavage., T., Barnes, E., G., Theeke, E., Mallow, B., . K., & Theeke., L., . A. (2016). The use of video conferencing for persons with chronic conditions: a systematic review. E-health telecommunication systems and networks. Vol. 5. (pp. 39–56). https://doi.org/https://doi.org/10.4236/etsn.2016.52005.
- Miller, G. A. (1969). A psychological method to investigate verbal concepts. Journal of Mathematical Psychology, 6(2), 169–191. https://doi.org/10.1016/0022-2496(69)90001-7
- Morse, J., . M. (2015). Critical analysis of strategies for determining rigor in qualitative inquiry. Qualitative Health Research, 25(9), 1212–1222. https://doi.org/https://doi.org/10.1177/1049732315588501
- Osborne, S. P., Zoe, R., & Strokosch, K. (2016). Co-production and the co-creation of value in public services: A suitable case for treatment? Public Management Review, 18(5), 639–653. https://doi.org/https://doi.org/10.1080/14719037.2015.1111927
- Righi, C., James, J., Beasley, M., Day, D. L., Fox, J. E., Gieber, J., Howe, C., & Ruby, L. (2013). Card sort analysis best practices. Journal of Usability Studies, 8(3), 69–89. uxpajournal.org/wp-content/uploads/sites/8/pdf/JUS_Righi_May_2013.pdf
- Rosenberg, S., & Park, K. M. (1975). The method of sorting as a data-gathering procedure in multivariate research. Multivariate Behaviour Research, 10(4), 489–502. https://doi.org/https://doi.org/10.1207/s15327906mbr1004_7
- Saldana, J. (2016). The coding manual for qualitative researchers (3rd ed.). Sage Publications.
- Sayles, J., . N., Ryan, G., . W., Silver, J., . S., Sarkisian, C., . A., & Cunningham, W., . E. (2007). Experiences of Social Stigma and Implications for healthcare among a diverse population of HIV positive adults. Journal of Urban Health, 84(6), 814–828. https://doi.org/http://doi.org/10.1007/s11524-007-9220-4
- Short, J., Williams, E., & Christie, B. (1976). The social psychology of telecommunications. Wiley.
- Sten., A., John., B., & Edwards, R. (2006). The health planner’s toolkit. Queen’s Printer for Ontario.
- Stevenson, M., & Taylor, B., . J. (2017). Involving individuals with dementia as lay researchers in analysis of findings from a qualitative study. Dementia, 1. 18 https://doi.org/https://doi.org/10.1177/147130121769090
- Sweeney, A., Greenwood, K., Williams, S., Wykes, T., & Rose, D. (2013). Hearing the voices of service user researchers in collaborative qualitative data analysis: The case for multiple coding. Health Expectations, 16(4), 89–99. https://doi.org/https://doi.org/10.1111/j.1369-7625.2012.00810.x
- van Bijleveld, G. G., Dedding, C. W. M., & Bunders‐Aelen, J. F. G. (2015). Children’s participation within child protection. Child & Family Social Work, 20(2), 129–138. https://doi.org/https://doi.org/10.1111/cfs.12082
- Yap, J., McCartan, C., Davidson, G., White, C., Bradley, L., Webb, P., Badham, J., Breslin, G., & Best, P. (2020). An exercise intervention for people with serious mental illness: Findings from a qualitative data analysis using participatory theme elicitation. Health Expectations, 23(6), 1579–1593. https://doi.org/https://doi.org/10.1111/hex.13141
Appendix A.
Recruitment of Co-researchers
Appendix B
Full list of excerpts and groups produced during Step Four
Appendix C
Photo of Co-researchers undertaking the sorting task.
Table 500.
Spreadsheet Input during Step Four
Appendix E.
Number of Excerpts within each group
Appendix F:
Training Evaluation Form
Participatory Theme Elicitation (PTE) Training Evaluation Form
We would appreciate if you could take a few minutes to share your opinions with us so we can improve on this training.
Please return this form to the organizer at the end of the training. Thank you.
Date:________________________
The duration of training was: a. Too short b. Just right c. Too long
The length of quotes were a. Too short b. Just right c. Too long
The number of quotes were a. Too short b. Just right c. Too long
StronglyStrongly
agreedisagree
I understood the sorting task12345
Please rate the following:
ExcellentVery GoodGoodFairPoor
Information provided
The training overall
What did you most appreciate/enjoy/think was best about the training day?
________________________________________________________________________________________________________________________________________________________________________________________________________________________________________________
Any suggestions for improvement?
________________________________________________________________________________________________________________________________________________________________________________________________________________________________________________
Your Background
Gender a. Male b. Female9. Age ____________
10. Educational Background N/A GCSE A-Level NVQ Degree
Other (please specify ____________________________________)
Thank you!
Please return this form to the organizer at the end of the training session.
Appendix G.
Summary of themes developed across groups
Appendix H:
Protocol for PTE
Participatory Theme Elicitation Protocol
Step 1: Data Selection
Identify qualitative dataset
Select excerpts for inclusion
Cut excerpts into individual strips or segments
Step 2: Capacity Building
Provide an overview of the project
Discuss different types of research data (qualitative, quantitative etc.)
Describe the Participatory Theme Elicitation method
Demonstrate the subjective nature of qualitative analysis through sorting activities (e.g., images of fruits and vegetables)
Step 3: Data Sorting
Provide each co-researcher with a set of excerpts
Each co-researcher is to group their excerpts into piles, with at least two piles, no minimum pile size, and no ‘miscellaneous’ pile.
Emphasize that this is an independent activity
Step 4: Data Grouping
Create a weighted network of excerpts, with an edge wherever at least one co-researcher placed the pair of excerpts in the same pile and the edge weight given by the number of co-researchers who placed the excerpts together.
Apply a community detection algorithm to the network to create groups of excerpts.
Note that step 4 can be completed online, see [ANONYMISED LINK]
Step 5: Data Analysis
Gather co-researchers together
Audio record session for accuracy
Present network diagram and groupings
Emphasize that the network data are only for guidance purposes
Discuss the relationships between excerpts contained within each group
Examine possible outliers or excerpts that might be better placed elsewhere