
 ?Mathematical formulae have been encoded as MathML and are displayed in this HTML version using MathJax in order to improve their display. Uncheck the box to turn MathJax off. This feature requires Javascript. Click on a formula to zoom.
ABSTRACT
Social research methodologists have postulated that the transparency of survey procedures and data processing is mandatory for assessing the Total Survey Error. Recent analyses of data from cross-national surveys have demonstrated an increase in the quality of documentation reports over time and significant differences in documentation quality between the projects. This research note replicates previous results with an extended set of documentation-related quality indicators describing the degree of completeness of information at the consecutive steps of the survey cycle. It also extends earlier findings by indicating no significant relationship between the quality of the survey documentation and the quality of the survey itself. We analysed a meta-data set of survey characteristics, studying all available up-to-date methodological reports of 1,145 national surveys from four large-scale multi-wave projects: the European Quality of Life Survey (2003–2016), European Social Survey (2002–2018), European Values Study (1981–2017), and International Social Survey Programme (1985–2018).
Introduction
Detailed survey documentation is crucial for assessing the quality of a survey (Jedinger et al., Citation2018) as every fieldwork decision may impact the Total Survey Error (Biemer, Citation2010). Thus, secondary data users require access to informative and transparent project documentation when working on survey datasets (Blank & Rasmussen, Citation2004).
Standards for producing survey documentation evolved in parallel, and many different rules were developed simultaneously (Mohler et al., Citation2010). One of the most prominent propositions was the result of a collaboration between researchers and survey organisations from North America and Europe. The Data Documentation Initiative, introduced almost 30 years ago, specified basic standards for the compilation and presentation of survey procedures and data archives (Vardigan et al., Citation2008). Nevertheless, none of the proposed solutions has become commonplace.
Two recent empirical studies examined the quality of data protocols from large-scale cross-national multi-wave surveys. Kołczyńska and Schoene (Citation2018) focused on selected waves of 22 projects from different continents, while Jabkowski and Kołczyńska (Citation2020a) analysed five pan-European surveys. Both papers indicated nonignorable cross-project differences in the quality of survey documentation and an increase in the quality over the years. However, neither studied the relationship between survey and documentation quality.
This research note replicates and extends previous findings. We used data from four cross-national multi-wave surveys conducted (in most cases) on probability samples of the entire adult population of a given country: the European Quality of Life Survey (EQLS; 2003–2016), European Social Survey (ESS; 2002–2018), European Values Study (EVS; 1981–2017), and International Social Survey Programme (ISSP; 1985–2018). We took the methodological characteristics of national surveys from the dataset produced by Jabkowski and Kołczyńska (Citation2020b) and updated these data on the most up-to-date waves of each project, i.e. ESS (9/2018), EVS (5/2017), and ISSP (2016–2018). We worked on a dataset containing methodological information from about 1,145 national surveys in total.
We first introduce the documentation- and survey-quality measures and specify multilevel regression models to test their relationship. Then, we describe the differences in the quality of survey documentation between the four projects and indicate changes over time. Finally, we study the relationship between the survey and the documentation quality, which constitutes our unique contribution to the literature. The conclusions of our study support the findings of those methodologists for whom survey documentation plays a crucial role in assessing the quality of the survey, as methodological protocols constitute an essential source of information when determining survey errors.
Methods
Measures of documentation quality
We checked project documentation and datasets for detailed information on the 11 survey steps according to the items listed in in the Results section. Each survey in country i, year t, and project p received a score of 1 in every item if the documentation or dataset contained appropriate information and 0 if not. Additionally, for each national survey, we calculated four indexes of documentation quality – each as an unweighted mean of scores obtained by each national survey within a particular set of items – relating to the (1) target population and sampling design (, items [i], [ii], [iii]), (2) fieldwork procedures (items [iv], [v], [vi], [vii]), (3) response rate and survey outcomes (items [viii], [ix]), and (4) weighting variables (items [x], [xi]). We also calculated the index of the overall documentation quality as an unweighted mean of scores obtained by each national survey within all 11 items.
Table 1. Quality of methodological documentation by the project.
Measure of survey quality
We assessed the quality of the survey by calculating the absolute sample bias according to the internal criterion of representativeness (Kohler, Citation2007). The internal criterion compares the proportion of females in a subsample of respondents living in two-person households inhabited by heterosexual couples with the expected proportion of females, which equals 0.5. The measure of absolute bias for country i, year t, and project p express the formula:
where is a fraction of female respondents in a subsample and
represents a subsample size; note that when the absolute bias is larger than 1.96, the deviation is statistically significant at alpha equal to 0.05.
It must be noted that Kohler (Citation2007, p. 59) pointed out two main reasons for the deviation of the proportion of each gender from 0.5 in a subsample of respondents who are married or living in a civil partnership in two-person households. First, some two-person households may be inhabited by same-sex couples, which may decrease the accuracy of the internal criterion of representativeness as reporting same-sex couples in cross-national surveys is expected to increase over time (Fischer, Citation2016). The EVS and the ISSP do not report the gender of any household member other than the respondent; hence, we could not restrict the calculation of absolute bias to heterogenous couples. However, the ESS and the EQLS (both projects record all household members’ gender and relationship to the respondent) indicate that the share of same-sex couples in a two-person household is on mean equal to 1.7% and 3.2%, respectively. More importantly, the correlation between the absolute bias excluding same-sex couples and the same indicator that does not exclude same-sex couples is 0.99 for the ESS and 0.95 for the EQLS (for details, see supplementary materials). Second, Kohler (Citation2007) similarly noted that deviations of each gender from 0.5 may also occur when the drop-out from the sampling population is gender-specific, i.e. when the target population in the given survey uses a nationality or citizenship criterion, in which case only one person from a mixed-nationality or mixed-citizenship couple would be eligible to participate in the survey. However, none of the projects we analysed includes nationality or citizenship as an eligibility criterion for sampling.
The most recent implementation of the internal criterion in a large-scale quality evaluation of surveys from different cross-country projects was seen in a paper by Jabkowski et al. (Citation2021). The authors discussed the limitations of the internal measure; however, they also demonstrated the superiority of the absolute value of sample bias over other measures of sample quality and its easy applicability for secondary data users. One advantage is that, unlike other measures, it does not rely on benchmarks that must be derived from reliable external population statistics (Eckman & Koch, Citation2019), and the internal measure does not require design weights (usually not available in survey datasets). Moreover, the measure of absolute bias is based solely on items omnipresent in survey questionnaires, i.e. household size, gender, and respondent’s marital status. Therefore, it can be calculated in most cases. More importantly, within the Total Survey Error framework, the measure of absolute bias captures multiple errors of representation (Groves & Lyberg, Citation2010), which are also referred to respondents’ selection issues, i.e. sampling error, coverage error, and nonresponse error at the unit- and item-level (Weisberg, Citation2005). As such, rather than capturing specific errors in the survey process, the measure of absolute bias probes the final quality of the sample by pointing to irregularities in the survey process.
Models for testing the relationship between the survey and the documentation quality
To test the relationship between the survey quality and the quality of its methodological documentation, we ran a series of cross-classified multilevel regressions with absolute bias as the dependent variable, the measure of the overall quality of survey documentation, and the survey project as independent variables. Since the surveys are nested within a dozen countries and years, we used both variables to cluster observations; it is to be noted that having only four projects, we decided not to use the project name as a clustering factor. Additionally, to ensure that the results of our analyses are robust to model design, we ran regressions on different subsets and with different specifications.
Model 1 works on a dataset of 1,066 surveys for which we were able to calculate the measure of absolute bias (which leaves out 79 samples). We also excluded three countries with only one survey each, which enabled the analyses of country-level random effects. For country i, year t, and project p, the specification of Model 1 is as below:
where is the grand intercept,
and
represent country and year random intercepts, respectively,
and
are regression coefficients for two dependent variables, i.e. the documentation quality and the project name, and
is the residual.
To check whether the well-documented ESS surveys did not bias the regression results, we specified Model 2 on two subsets of the analysis. Subset 1 contained 832 surveys out of 1,063 after excluding 231 ESS samples, while Subset 2 additionally excluded 147 surveys carried out before 1999 to make the time span more comparable across the projects. Model 2 also incorporates project name as a moderator, which allowed us to test whether the relationship between the absolute bias and the documentation quality was uniform across the projects:
where is the grand intercept,
and
are country and year random intercepts, respectively,
,
, and
are regression coefficients for documentation quality, project name, and the interaction of both variables, and
is the residual.
Results
We started with the analysis of between-project differentiation of the quality of survey documentation. provides the percent of national surveys with appropriate information in the methodological protocols according to items [i]–[xi], the means of four documentation quality indexes, and the mean of the overall documentation quality index.
First, we replicated the results presented by Jabkowski and Kołczyńska (Citation2020a, p. 193). Compared to the three others, the best-documented project is the ESS. Only four ESS surveys scored below 1. Latvia in wave 3 and Lithuania in wave 4 did not produce weighting variables; Romania in the third wave omitted weights and information on fieldwork dates, and Turkey in wave 4 did not contain information regarding the implementation of back-checking procedures.
Second, compared to the ESS, the EQLS had worse documentation. The main reason is that the EQLS incorporated design weights starting with the third wave, and the documentation of the third wave did not contain information on response rates. The EVS and ISSP scored lowest on documentation quality indexes; however, both projects have the longest duration and were started in the early 1980s when cross-national surveys were rare and there were no documentation standards.
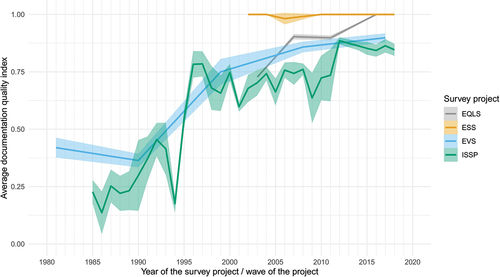
To further analyse the cross-project differences in the quality of survey protocols, adds the year of the project’s wave to the comparison. Broken lines represent the mean values of the overall documentation quality in each project’s wave, while the surrounding area indicates a 95% confidence interval of the mean. The results demonstrate a notable increase in the quality of survey documentation, and the between-projects differences become much smaller in the newest rounds of each project.
Figure 1. Cross-project differences and changes in survey documentation quality over time.
Before discussing the results of the multilevel regression models, we will briefly analyse cross-project differences in the absolute value of sample bias (supplementary materials contain detailed descriptive statistics alongside a figure with a visualisation of within- and between-project differences in the values of absolute sample bias). By-project comparison of the mean value of absolute sample bias and the standard error of the mean indicates minor differences between the four projects and considerable within-project variation (the means range from 1.30 in the EQLS to 1.41 in the ESS, with their respective standard errors varying from 0.97 to 1.58, respectively). Likewise, the medians are generally very similar and slightly deviate from 1 for each project. Notably, the third quartile of the project’s distribution of absolute bias is close to the cut-off point of 1.96, reaching 1.84 for EQLS and ESS, 2.00 for EVS, and 1.85 for ISSP. The latter means that around 25% of the surveys within each project exhibit bias that reach statistical significance at the alpha level equal to 0.05.
The last part of our study focuses on the relationship between survey quality and documentation quality. provides the results of the multilevel regressions specified in the methods section. Note that the EQLS constitutes the reference category; thus, the regressions do not provide estimates of coefficients for this project.
Table 2. Model estimates of the coefficient on the absolute value of sample bias.
Model 1 did not provide any evidence for the existence of a significant relationship between the absolute sample bias and the overall documentation quality of surveys from the four projects; it also showed that the means of absolute sample bias in the ESS, EVS and ISSP did not deviate significantly from the mean in the EQLS. Note that the result of Model 1 echoes our previous descriptive analysis of cross-project differences in the absolute sample bias. Model 2 added the interaction effect between the project name and documentation quality and worked on a subset that excluded ESS data from the analysis (Subset 1) as almost all national surveys within this project reached the highest value of the indexes of documentation quality; additionally, Model 2 worked on Subset 2 which excluded surveys before 1999 to make the projects time-span comparable. Regressions on both subsets resulted in very similar estimates of regression coefficients. Notably, the results indicated that the relationship between the documentation quality and the absolute value of sample bias observed in the EQLS was negative (i.e. the higher the documentation quality and the lower absolute bias); however, it was still negligible. Moreover, the relationship became even weaker in the EVS and the ISSP.
In summary, none of the models implemented in our analysis indicated a significant impact of the overall documentation quality on the absolute value of sample bias, even if we controlled for the moderation effect of the project on the analysed relationship between the survey name and documentation quality. This result means that even poorly documented surveys can be of high quality, i.e. have a low absolute value of sample bias. Nonetheless, when the low-quality surveys are not accompanied by detailed information on sampling, fieldwork, and other steps of the survey cycle, secondary data users cannot recognise the potential sources of bias. Thus, they should eliminate the results of such surveys from their analyses.
Concluding remarks
Our analyses demonstrated notable cross-project differences in the quality of survey documentation, with a considerable boost in the documentation quality over time, especially in the latest waves of the four projects analysed. Our contribution to the literature stems from an investigation of the relationship between survey quality and documentation quality. We did not find any evidence supporting the existence of a significant relationship between the internal measure of absolute bias and the quality of methodological reports. Consequently, our results demonstrated that survey producers and data users should not treat the latter as a proxy for the former. However, one should note that this study is limited to only one specific measure of sample bias based on the internal criterion of representativeness. Despite this limitation, our findings strengthen the role of survey documentation in determining the sources of the Total Survey Error. When the sample bias is significant, the only way to recognise the potential sources of survey errors is to study how certain sampling and fieldwork procedures decrease survey quality.
Research data and replication files
To facilitate research openness, transparency and reproducibility, replication materials and the datasets for analysis are available in this repository https://osf.io/b9adk/
Disclosure statement
No potential conflict of interest was reported by the author(s).
Additional information
Funding
Notes on contributors
Piotr Jabkowski
Piotr Jabkowski is an associate professor at the Faculty of Sociology Adam Mickiewicz University in Poznan, and a member of Sampling and Weighting Experts Panel in the European Social Survey for rounds 10 and 11. His research focuses on the methodology of cross-country comparative surveys, the total survey error paradigm and sampling theory.
References
- AAPOR. (2016). Standard definitions: Final dispositions of case codes and outcome rates for surveys. https://www.aapor.org/AAPOR_Main/media/publications/Standard-Definitions20169theditionfinal.pdf
- Biemer, P. P. (2010). Total survey error: Design, implementation, and evaluation. Public Opinion Quarterly, 74(5), 817–848. https://doi.org/10.1093/poq/nfq058
- Blank, G., & Rasmussen, K. B. (2004). The data documentation initiative: The value and significance of a worldwide standard. Social Science Computer Review, 22(3), 307–318. https://doi.org/10.1177/0894439304263144
- Eckman, S., & Koch, A. (2019). Interviewer involvement in sample selection shapes the relationship between response rates and data quality. Public Opinion Quarterly, 83(2), 313–337. https://doi.org/10.1093/poq/nfz012
- Fischer, M. M. (2016). Identifying same-sex couples in cross-national survey data: A comparison of same-sex couples’ demographic and socio-economic traits in six European countries. DANS Symposium Publications, 8
- Groves, R. M., & Lyberg, L. (2010). Total survey error: Past, present, and future. Public Opinion Quarterly, 74(5), 849–879. https://doi.org/10.1093/poq/nfq065
- Jabkowski, P., & Kołczyńska, M. (2020a). Sampling and fieldwork practices in Europe: Analysis of methodological documentation from 1,537 surveys in five cross-national projects, 1981–2017. Methodology. European Journal of Research Methods for the Behavioral Science, 16(3), 186–207. https://doi.org/10.5964/meth.2795
- Jabkowski, P., & Kołczyńska, M. (2020b). Supplementary materials [Reserch data] to: Sampling and fieldwork practices in Europe: Analysis of methodological documentation from 1,537 surveys in five cross-national projects, 1981–2017 Methodology. European Journal of Research Methods for the Behavioral Science 16(3), 186–207. https://doi.org/10.23668/psycharchives.3461
- Jabkowski, P., Cichocki, P., & Kołczyńska, M. (2021). Multi-project assessments of sample quality in cross-national surveys: The role of weights in applying external and internal measures of sample bias. Journal of Survey Statistics and Methodology. https://doi.org/10.1093/jssam/smab027
- Jedinger, A., Watteler, O., & Förster, A. (2018). Improving the quality of survey data documentation: A total survey error perspective. Data, 3(4), 45. https://doi.org/10.3390/data3040045
- Kohler, U. (2007). Surveys from inside: An assessment of unit nonresponse bias with internal criteria. Survey Research Methods, 1(2), 55–67. https://doi.org/10.18148/srm/2007.v1i2.75
- Kołczyńska, M., & Schoene, M. (2018). Survey data harmonization and the quality of data documentation in cross‐national surveys. In T. D. Johnson, B.-E. Pennell, I. Stoop, & B. Dorer (Eds.), Advances in comparative survey methods: Multinational, multiregional, and multicultural contexts (3MC) (pp. 963–984). Wiley. https://doi.org/10.1002/9781118884997.ch44
- Mohler, P. P., Hansen, S. E., Pennell, B.-E., Thomas, W., Wackerow, J., & Hubbard, F. (2010). A survey process quality perspective on documentation. In J. A. Harkness, M. Braun, B. Edwards, T. P. Johnson, L. Lyberg, P. P. Mohler, B.-E. Pennell, & T. W. Smith (Eds.), Survey methods in multinational, multiregional, and multicultural contexts () (pp. 299–314). https://doi.org/10.1002/9780470609927.ch16
- Vardigan, M., Heus, P., & Thomas, W. (2008). Data documentation initiative: Toward a standard for the social sciences. International Journal of Digital Curation, 3(1), 107–113. https://doi.org/10.2218/ijdc.v3i1.45
- Weisberg, H. F. (2005). The total survey error approach: A guide to the new science of survey research. University of Chicago Press.