
ABSTRACT
Using secondary data has many advantages, but there are also many limitations, including the lack of relevant information. This article draws on a previous study that used secondary data to investigate substance use in young, elite athletes. Three types of missing data appeared: missing data, lack of information about the data collection process, and unavailable data. Other concerns were also highlighted, such as coverage and sampling errors. The impacts of secondary data on scientific research results can be divided into unavoidable changes and researchers’ choices. The research question should guide the option to use secondary data, and it is essential to assess the level of constraint that will result from it early on. Additionally, along with the quality of information available, consistency in questionnaires is vital for broadening the scope and ensuring research progress.
Introduction
Scientific researchers should ideally conduct their studies in total independence, without interference from funders of the study, politics, editors, publishers or any other authority. Also, objective quality should assess scientific papers without interference from the reviewers’ ideas or the editors’ political views. However, certain constraints, such as financial dependencies, time limits and data availability, can significantly influence the research and publication process. Using secondary rather than primary data is a good illustration of such constraints.
Secondary data refers to pre-existing data initially collected by the research team or another team to answer other research questions (Smith, Citation2008) and is data that was not intended (dedicated to) for a planned study. It may have been collected in different ways and might be quantitative or qualitative, but this manuscript focuses on quantitative data collected through a questionnaire. The use of secondary data is increasing, and social scientists are no exception to this rule (Punch, Citation2013). There are advantages to using secondary data. Indeed, according to Kiecolt and Nathan (Citation1985, p. 11), secondary data ‘requires less money, less time, and less personnel and is, therefore, attractive in times of economic fluctuations when the funds available for research are limited or uncertain’. Thus, data analysis can start immediately. However, it also means that the research project will have to deal with the specifics and possible shortcomings of the existing database, such as missing data (MD), a high attrition rate, or, more generally, a non-representativeness of the study population. This paper explores how these limitations influence, or even shape, scientific research.
This manuscript presents the limitations in secondary data in a real case study on substance consumption by young, elite athletes in Switzerland. In the beginning, we intended to write an article from a longitudinal perspective and target various substances. However, we went through freely available databases as we did not have funding to collect the essential data relevant to our study. As a result, we identified the C-SURF study (Gmel et al., Citation2015) as the study of interest. The C-SURF study was recent and longitudinal (baseline and two follow-up waves). Moreover, it involved young people in Switzerland and included questions about many legal and illegal substances. However, the use of this database led to the following difficulties:
It was impossible to distinguish between elite athletes and other respondents.
The dataset only included men of Swiss nationality, excluding all women and all non-Swiss nationals.
The number of MD, even at baseline, was relatively high according to our standards.
The two follow-up waves of the study had a relatively high attrition rate.
Some important questions for our study were only asked at a baseline level.
All five points above are related to the notion of missing information. Points 1 and 5 are also associated with the specific needs of the research question, and point 2 refers to a data coverage error. We had to abandon the longitudinal aspect of our study due to points 4 and 5 but could still publish a study based on available data (Diatta & Berchtold, Citation2020). This process motivated us to write a discussion paper about the limitations of using secondary datasets, especially regarding missing information problems. Throughout this article, we will take the perspective of social scientists and consider a population and sample of real people, but our ideas should be easily transferable to other fields.
The quest for data
Working with a probability sample of the target population is the gold standard of quantitative data collection in the social sciences. The collected data of a study can be cross-sectional, conducted at one time, or longitudinal. Longitudinal studies include prospective surveys, repeated interviews or questionnaires with the same people at different times, and retrospective surveys consisting of a single questionnaire or interview to collect data on the past and present. Surveys with different persons at various points in time also exist. The survey collected data must follow guidelines to be representative of the population of interest (Draugalis et al., Citation2008; Kelley et al., Citation2003). In addition, they must also include all the information necessary to assess the research question.
However, not all the studies undertake the recruitment of participants and data collection. Firstly, these processes are very long, expensive and require human resources that are not always available. Secondly, people are less and less willing to respond to surveys, including scientific ones (Boyle et al., Citation2021; Leeper, Citation2019), even when they are directly or indirectly concerned with the subject and the study results (Berchtold et al., Citation2017). Also, with the Internet and social media development, surveys, especially non-scientific ones such as market research, have increased. And this increase in survey solicitations is one of the many reasons for the decrease in response rates (Czajka & Beyler, Citation2016).
Therefore, using existing data rather than collecting new data is an alternative way for researchers to conduct studies. Some open data policies even encourage the use of secondary data. For instance, in article 47 of its funding regulation (the 2016 revised form), the Swiss National Science Foundation ‘obliged grantees to make the research results available to the public in an appropriate manner’.
Despite the benefits, previous studies have highlighted the pitfalls of secondary data that impact its use (Hox & Boeije, Citation2004; Kiecolt & Nathan, Citation1985; Smith, Citation2008; Vartanian, Citation2011). For instance, researchers cannot tailor questionnaires to their needs in the case of secondary data obtained through quantitative surveys. A direct consequence of this situation is the risk of not having information on specific dimensions essential for the new study or a lack of precision or accuracy in assessing these dimensions. Also, the population corresponding to the existing data may differ from that required in the new study. Finally, the different choices made in data collection and management (e.g. modes of data collection, inclusion/exclusion criteria, sample size, MD management, treatment of extreme values, level of documentation, metadata, paradata) may be poorly documented and cannot be modified posteriorly.
These points imply that the reuse of previously collected data can significantly impact the conduct of a new research project, fundamentally altering some of its key aspects and, consequently, its results.
Missing information in secondary data
MD represents data that should have been collected but was not. There is abundant literature on the causes and types of MD as well as on the remedies (Allison, Citation2001; Little & Rubin, Citation1987; McKnight et al., Citation2007; Pham et al., Citation2018; Resche-Rigon & White, Citation2018; Rubin, Citation1976; Schafer & Graham, Citation2002; White et al., Citation2011). Textbooks in survey analysis emphasise the need to follow an appropriate data collection protocol to ensure optimal data quality and prevent MD. When using secondary data is the only option and essential information is missing, researchers have to deal with MD – either by ignoring the MD, either by using a maximum likelihood estimation procedure, or applying an imputation procedure (R. J. A. Berchtold, Citation2019; R. J. A. Little & Rubin, Citation2019; Schafer, Citation1997) .
In general, the use of secondary data can imply three different types of missing information:
Missing data in the classical non-response sense, either at the unit or item level.
Lack of information on the data collection process or on the data itself.
Unavailable data (collection of the data was not planned).
Missing data in the classical non-response sense
The first type of missing information concerns MD, which occurs in almost all quantitative studies and affects many data analyses (Huque et al., Citation2018). Dong and Peng (Citation2013) considered MD occurrence a rule rather than an exception in quantitative research. The proportion of MD can be significantly substantial depending on the study’s design or the topic’s sensitivity. For example, longitudinal studies, increasingly used nowadays, are prone to unit-level MD because of attrition (Tsiatis et al., Citation2014), but sensible questions about participants’ income, sexual behaviour, or substance use are likely to lead to item-level MD (Kim et al., Citation2007; Studer et al., Citation2013).
This paper will not discuss the causes and direct consequences of classical MD but rather the different issues linked to using a secondary database. For example, when using secondary data, it is almost always impossible to return to the data collection phase once it has been completed by re-interviewing part of the original sample or matching the MD entries with the administrative records. Therefore, some treatment forms must be applied when missingness (at the item or unit level) occurs in a database. However, additional difficulties and risks could arise when secondary researchers perform such treatments. For example, users perform different methods between two secondary analyses of the same dataset. Or when reinforcing the central tendency of variables by using a constant imputation procedure, such as mean imputation rather than random imputation.
Similarly, using a single imputation rather than a multiple imputation procedure will lead to underestimated variances that negatively impact confidence intervals and statistical tests. Therefore, the results obtained by different research teams working with the same database could be contradictory and affect the reproducibility of the research results. For this reason, some organisations (e.g. Swiss Statistics in the case of publicly available samples from the last census) provide a complete dataset that includes MD already imputed. Still, these treatments remain isolated cases, and it is always worthwhile to discuss the relevance of the choices made during the imputation phase.
Lack of information on the data collection process or on the data itself
The second type of missing data is a short description of the secondary database. Some of its characteristics can be unavailable or hidden when performing secondary analyses if the sampling design is not fully described. For instance, researcher users of the secondary data could be unaware that stratification occurred during the sampling phase. Thus, not using the information on stratification could impact the results as all observations would be considered independent when they are not, leading to an artificial increase in statistical power. Also, if the conditions used for asking or not asking the respondents’ questions are unclear, non-respondents that should be considered logical MD can be interpreted as not-logical MD.
Similarly, it is essential to know which data was imputed and how if there were MD in the original dataset. If MD were imputed before publishing the available dataset, it is essential to know how they were imputed. Otherwise, the MD percentage on each of the original variables should at least be provided. To show another example, if metadata are incomplete, researchers can misunderstand the exact meaning of some variables or some of the given answers. For instance, if the possible modalities of a variable are {female, male, other}, it is unclear whether the respondents had been asked about sex or gender, two different concepts even related. Therefore, the dataset could be problematic if its anonymisation was incorrectly performed before releasing it for public use. And if the primary researchers erased some essential information for its correct interpretation. On the other hand, it could seem like a good idea to suppress all information regarding both sex and gender in the final database, especially since crossing these two variables can easily help identify some persons in a database. However, such information could prove crucial for research in gender studies, and it is also often used as a controlling factor in statistical analyses.
These common problems call thus for strict guidelines and caution during the production of databases intended to be reused by other researchers. These guidelines and caution have a cost because they require expertise, technologies, good research data management and infrastructures. However, such tasks and necessary operations are rarely performed as meticulously as they should be. Mons (Citation2020) wrote that fixing such problems ‘will require more resources than the scientific community is willing to face’. Hence, using experts from renowned data repositories, like FORS in Switzerland (forscenter.ch), U.K. Data Service in the U.K. (www.ukdataservice.ac.uk/), or GESIS in Germany (gesis.org), should be considered a valuable option.
Unavailable data
The third type of missing information relates to data that would prove essential for a secondary research project, but the database’s promoters never collected it. Because they do not need it for their research project, it can be information entirely missing. For example, having household size without a sufficient degree of precision to be useful (e.g. we know the size of the households, but we do not know how many people in each household are dependent, such as young children). This information is unavailable because it did not seem helpful at the time of data collection or perhaps because the related questions were removed from the questionnaire to keep it sufficiently short. Here, we reach the limits of secondary data. Indeed, the lack of information can lead to drastic changes in a research question or hypothesis. Therefore, under the assumption that no better database is available for performing the required secondary analysis, the researchers have to weigh the pros and cons of 1) modifying their research question and/or hypotheses, 2) collecting new data with additional induced costs, and 3) calling off the research project.
The co(u)rse of our research project
Our previous study (Diatta & Berchtold, Citation2020) aimed to investigate the link between young elite sports practice and the consumption of different legal and illegal substances. The objective was to examine how substance use differs between young, elite athletes and their non-elite peers and how it evolves. In addition, we investigated whether the practice of sports at a high level could be considered a protective factor against substance use. Such questions are reasonable as, in the collective imagination, sports are seen as a healthy practice, fundamentally incompatible with substance consumption. Moreover, it may explain the lack of data on the consumption of substances by young athletes, especially in Switzerland, except possibly for doping product consumption.
Target population
According to our research question, the target population was all individuals between 17- and 22-years old living in Switzerland. In 2010, this target population comprised 576,592 individuals, 7.26% of the total Swiss population. As interviewing each member of the target population is impossible, researchers generally consider only a sample to gather data (Groves et al., Citation2011). Therefore, we searched for publicly available databases with the following minimal requirements: a) the data should come from adolescents or young adults living in Switzerland, b) the sample should include a subsample of elite athletes, c) the data should have detailed information regarding the use of both legal and illegal substances, and d) the data should be a longitudinal study over several years. The only database that met these requirements was C-SURF (https://www.c-surf.ch/), but it also had limitations. For one, The C-SURF study was conducted only among Swiss male citizen recruits for the military service of the Swiss army.
In Switzerland, military service is mandatory for all male citizens. Therefore, recruits take part in a two-day recruitment process when they are 19 years old. All young Swiss males who took part in this recruitment process from 23 August 2010 to 15 November 2011 in three different recruitment centres were invited to participate in the C-SURF study (baseline). These centres cover 21 of the 26 Swiss cantons. Later, two follow-ups were held during 2012–2014 and 2016–2018. An additional follow-up was conducted in 2019–2020, but these data were unavailable when the current study was held, so we did not consider it here.
For any sample used to study an underlying population, accurate population coverage is required to make sound statistical inferences. However, the representativeness of the C-SURF sample is questionable because of the method used to select the units. Only a minority of those who attended the two-day recruitment agreed to answer the C-SURF questionnaire – 15,066 recruits, representing 2.61% of the target population. Therefore, we did not have a probabilistic or quota-based sample, and the C-SURF sample must be considered a convenience sample. Moreover, the sample cannot even be viewed as a random sample taken from all recruitment participants. The documentation of the sample did not mention any comparison between participants and non-participants to identify possible systematic differences. Even if this sampling method is ubiquitous in research, mainly due to its convenience, it presents two major issues: coverage and sampling errors.
Coverage error
Coverage error is the difference between the population structure under study and the sample structure used to perform the analyses. In our case, there was an apparent mismatch between the C-SURF sample and our population of interest. Indeed, based on our research design, young adults living in Switzerland included Swiss men living in the French and German parts of the country but also women, foreign young adults, and people from Italian and Romansch language areas. However, the C-SURF data do not cover all the target population segments or anybody under 18 years. The non-inclusion of these categories of the target population represents a fundamental limitation for our research question. For example, from a substance consumption point of view, substantial differences exist between women and men (Moore et al., Citation2005) . Furthermore, Henchoz et al. (Citation2014) have shown that demographic characteristics are determinants of physical activity in young people. Thus, the results obtained from the C-SURF study were undoubtedly not fully generalisable to Switzerland’s entire young adult population.
Sampling error
Sampling error refers to the deviation between population parameters and sample estimates. In this case, of the 15,066 eligible units, only 7,556 individuals, or 1.31% of our target population, consented to participate (). Also, only 6,528 individuals among the consenters answered the questionnaire (Gmel et al., Citation2015). Thus, more than 50% of the recruits did not participate in the study. In general, the behaviour of respondents regarding substance use differs significantly from that of non-respondents, as shown in (Kim et al., Citation2007) . Therefore, coverage and sampling errors became critical because they led to a loss of precision, affecting the overall validity of our results (Groves et al., Citation2011; Hwang & Fesenmaier, Citation2004).
Figure 1. Coverage and sampling errors.
Research question
Another issue encountered during our study was that it was impossible to distinguish elite athletes from their peers in the C-SURF database. This is due to the fact that there were no questions about the respondents’ level of sport participation. Therefore, we had to construct a proxy from the combination of several variables. The example above illustrates a critical problem when using secondary data. That is the unavailability of information when the purposes of secondary data analysts do not match those of the primary data promoters (Kiecolt & Nathan, Citation1985). Such issue with secondary data is not always considered MD in the literature. However, in referring to the work of Heitjan and Rubin (Citation1991) and Heitjan (Citation1994), who view coarsened data as MD, and to the one of Schafer and Graham (Citation2002), who consider latent variables as MD, we can consider these pitfalls in the data as another form of MD in the context of secondary data.
Secondary data constraints are challenging and can drive researchers to alter their research questions based on the available data. Given the difficulty of clearly distinguishing between elite athletes and their peers, we modified our group of interest by categorising the participants based on their activity levels rather than their sports practice. However, we were aware that previous studies, such as those conducted by (Caspersen et al., Citation1985), have demonstrated that physical activity and sport are different concepts. Furthermore, physical activity is quite broad and includes sports and other physical activities, such as work-related activities. For this reason, relying on the notion of physical activity represented a significant shift from our original idea of comparing elite athletes with their peers.
To enable better identification, our definition of elite athletes also had to incorporate a notion of duration. Because, becoming established elite athlete results from a process that generally begins during childhood and continues during adolescence and young adulthood. Therefore, it was essential to ensure that classified respondents in our main group of interest pursued this level of activity for several years. Accordingly, we categorised respondents based on three complementary concepts: regularity, frequency and duration of physical activity. Thus, we defined four groups of physical activity levels (low, medium, high and other). C-SURF’s longitudinal design and the available information inconsistency throughout the waves had the major impact on this definition. Only one out of three variables used to define the groups at baseline was available in other waves (the regularity variable). We could not replicate in the two follow-ups the baseline four-group classification because the questionnaire was inconsistent between waves or the short questionnaire sent to non-respondents to increase the response rate does not cover those variables used for categorising the participants. Therefore, we had to give up the longitudinal component of our study to focus only on baseline cross-sectional data.
Another indirect consequence of difficulty identifying elite athletes is that we had to add an ‘other’ category, representing respondents whose physical activity level was unclear. Because they did not meet the conditions for inclusion in one of the three different groups, some of their answers to the three questions used to define the groups seemed contradictory. For example, someone said they had done physical activity several times in the last week but also said they had not done any physical activity in the previous year.
This other group comprised no less than 3,004 respondents, compared with 338, 996, and 316 respondents classified in low, medium, and high physical activity levels.
Missing items and unit missing
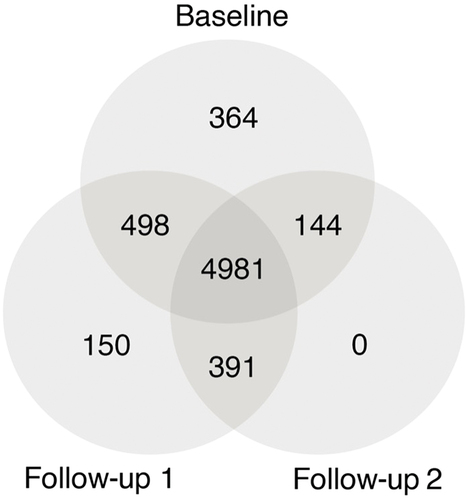
Lack of information regarding data collection worsens the proportion of missing information, either at the item or unit level. The C-SURF study had dropouts, late entry, and intermittent participants at the unit level. Dropouts are participants who left the study after baseline or the first follow-up. Late entry participants did not attend baseline but did respond to both follow-ups. Finally, intermittent participants who missed the first follow-up answered only to the same follow-up and were all present in the C-SURF study at the unit level. shows the number of respondents for each situation: 4,981 (baseline, follow-up 1, follow-up 2), 498 (baseline, follow-up 1), 144 (baseline, follow-up 2), 391 (follow-up 1, follow-up 2), 364 (baseline only), 150 (follow-up 1 only), 0 (follow-up2 only). Adding up the numbers in , 6,528 people responded to at least one wave of the survey, including 5,987 at baseline, 6,020 at follow-up 1, and 5,516 at follow-up 2. In the specific case of the C-SURF study, the number of respondents was slightly higher at follow-up 1 than at the baseline; we generally observed a gradual decrease in the number of available participants in longitudinal surveys (Schafer & Graham, Citation2002). For instance, a longitudinal three-wave analysis of the C-SURF data, without any action to impute MD, would only concern 4,981 respondents, that is, 76.3% of those who participated in at least one wave of the survey, or 65.9% of those who agreed to participate in the survey. This reduction in sample size is often a problem because the probability of answering is generally not uniform to the original full sample or a representative sample of the population under study, leading to further bias error (De Silva et al., Citation2017)
Figure 2. Distribution of the 6,528 respondents who participated in at least one wave of the C-SURF study.
In addition to unit-level missingness, we had to deal with item-level MD caused by participants who agreed to participate but did not provide an answer to some of the questions. Missing data are especially problematic when the sensitivity of the research subject may impact the level of missing information. For instance, studies dealing with the consumption of substances often face a high rate of MD (Studer et al., Citation2013), and the C-SURF research study is no exception.
Furthermore, there is the impact of using the short questionnaire to increase response rate on the categorisation of groups. includes both the complete and short questionnaires, but in practice, the number of short questionnaires was 82, 135 and 83, respectively, in all three waves. When doing everything possible to keep participants in the survey is commendable, using a shortened questionnaire implies that some information will be missing for a part of the sample. Here, questions we used to categorise participants into different levels of physical activity and some questions regarding substance use were missing. Among the variables used in our previous publication (Diatta & Berchtold, Citation2019), only 13 (15.66%) of the variables used had no missing values. The proportion of missing values was substantial, ranging from 8.30% to almost 70.54% among the 6,528 recruits who participated in at least one wave of the C-SURF study.
To summarise, the lack of information on the C-SURF survey itself, the inconsistency of available information from one wave to another, and finally, the unavailability of critical data required by our research question negatively impacted the construction of the proxy variable of physical activity and, hence, the whole study. Indeed, we could not classify all individuals with MD at either the unit- or item-level on one of the variables used to create our proxy into the three physical activity groups of interest (low, medium, and high). Consequently, we added those individuals to the group of ‘other’ participants who did not fulfil the inclusion criteria or had contradictory answers to some of the questions. To consider these issues and for more consistency in the activity group categorisation, we took two actions. First, we consider only baseline data. Second, we suppressed the group ‘other’ from all analyses because it was too heterogeneous to be compared to the three other physical activity groups.
Due to our different choices, many participants were excluded from the analysis, leaving us with a sample of n = 1,650. This sample is perhaps not so small according to research standards but much smaller than we had expected when beginning our study. Much of this decrease in the sample size can be directly related to the mismatch between our research question and the secondary data we chose to use. In addition, we did not consider in our analysis more than three-quarters of the recruits who consented to answer the C-SURF study, which is wasteful in terms of information (Van Buuren, Citation2018). Even if our strategy for dealing with missing information was a listwise deletion approach rather than a complete case analysis, the main disadvantages are pretty similar (King et al., Citation2001). From a statistical perspective, this is critical for both the point estimates and the statistical power of the analyses. Indeed, the sample size is a significant feature in statistics. Ellis (Citation2010) stated that ‘power is related to the test sensitivity, but the sample size is usually the most important’ (p. 69). Thus, the ability to highlight significant differences through analyses was seriously impacted.
Discussion
Researchers conduct every day many studies using secondary data. Some of these research studies face the problems described in this article. Our reflection is unique in that we not only conducted research marked by problems caused by a perhaps partially inappropriate choice of data, but we decided to draw out the consequences and expose them. In this way, we hope to help other researchers to make more informed choices in the future than we have done. In particular, we offer a set of recommendations for assessing how to effectively use an identified database to conduct a study as planned.
We were aware that doing our study with the C-SURF database would lead to a completely different article than initially planned. Nevertheless, we decided to continue taking the risk of working on a population much more restricted than anticipated and adapting our research question. First, we considered the level of activity practice rather than the level of sports practice. Then, we worked with a proxy built from the combination of three different available variables to assess each respondent’s level of physical activity. Moreover, we rejected performing a longitudinal study due to the lack of information and inconsistency in the available information.
Despite all these changes and the limitations implied by such modifications, the article published in the journal (Diatta & Berchtold, Citation2020) contributes to at least three different areas. First, it is one of the first to specifically consider differences in substance use as a function of the level of physical activity, especially in the Swiss context. Second, it considers a large number of different substances. Finally, in the case of tobacco and cannabis, the consumption level and consumption mode are considered.
The ethical question of whether it was a good choice to reshape many of our original ideas remains. Here, we used secondary data, knowing that the research project would deal with the specificities and possibly the shortcomings of this existing database, such as the presence of MD, a high attrition rate, and, more generally, a non-representativeness of the population under study. Still, it is easy to apply the same ideas to all datasets, not only to secondary ones, and formulate this fundamental question: To what extent does missing information influence or even shape scientific research?
We can classify the different impacts of the dataset on the final results into two types: unavoidable changes and choices made by researchers.
In our case, using the C-SURF data is a researcher’s choice. But if we have no other choice but to use that data due to a lack of an alternative, we can classify as unavoidable changes everything related to the structure of the sample. In particular, women and non-Swiss citizens were excluded. Using weights would not have allowed us to correct these two issues unless we assume that women and non-Swiss citizens behave exactly like Swiss males regarding physical activity practice and substance use. Such assumptions contradict the literature (Henchoz et al., Citation2014; Moore et al., Citation2005). Additionally, because no variable allowed us to identify elite athletes, we could not replicate the definition of groups at baseline for the two follow-up waves of the C-SURF study independent of our will.
Researcher decisions also affected the study. For example, the MD, at least at the item level, could have been imputed, which would have resulted in a larger sample and more statistical power. Moreover, statistical weights could have been used to ensure better representativeness of our final sample of Swiss males regarding language area and Swiss cantons. Treatment of MD, especially by imputation has detractors, but is it less critical to let the amount and nature of missing information partly shape the research project? Should we stop any research project that the nature of the available data would influence? Of course, there is an arbitration to be made here, but can scientific research live with compromises?
Research policies and the convenience of secondary data partly help promote their use in recent years. Apart from saving money, time, and human resources, secondary data have other advantages, such as bringing social benefits or promoting further research (Smith, Citation2008). However, the use of secondary data also has many limitations, especially when the new research question does not match the purpose of the primary research.
Kiecolt and Nathan (Citation1985) also state that using secondary data can be risky. Throughout our article, we have highlighted that careful considerations and data availability are among many other elements that should determine using secondary data. First, the choice of the dataset must be guided by the research question because a given question requires a minimal set of information to be analysed. From this perspective, our article has limitations since this minimal set of information (being an elite athlete in the long term) was unavailable. Furthermore, the proxy we used based on the notion of physical activity at a given time was not entirely satisfactory. In addition, researchers should carefully assess the consistency of questions from one wave to the next in longitudinal surveys before selecting a database.
Conversely, the promoters of longitudinal data collection should ensure more than minimal coherence between the questionnaires used in each wave of data collection. Even if this is not necessary from their point of view, this will benefit many other researchers who could then reuse the data more easily. Such coherence could even be promoted by the funders of data collection, such as state scientific foundations, to limit the waste of money on new data collection. Nonetheless, even if using the exact measurements from one publication to another allows for better comparability of the results, in the future, it may also lead to a lack of originality, and some aspects of our society can be entirely left out. Thus, Kiecolt and Nathan (Citation1985) suggest including new items of the same measures in follow-up questionnaires to broaden the scope of research and ensure progress in research.
It is difficult to identify research based on secondary data that has encountered the same problems as those mentioned in this article because scientific publications’ ‘limitations’ sections are usually limited to the essentials. Similarly, if research had to be abandoned because of such problems, it certainly did not result in subsequent publications in peer-reviewed journals. Instead, we can mention examples from our previous projects. For instance, in a study on the age of first use of legal and illegal substances, we could not include the most common substance, alcohol, because the corresponding question was not asked (Berchtold et al., Citation2010). In another study, we have shown that the frequency of recording specific temporal data impacts directly these data’s analysis results. However, it is impossible to change this recording frequency a posteriori (Berchtold & Sckett, Citation2007). As a final example, it can be argued that meta-analyses or even literature reviews can only be carried out if the articles on which they are based contain sufficiently standardised measures or results. Their absence will lead to the non-inclusion of perhaps essential studies.
Recommendations
Based on the research in this article and our own experience, here is a list of recommendations that researchers interested in using secondary data should pay attention to:
Begin by clearly defining the research question and hypotheses. Based on this, identify all necessary information or variables, including control variables.
Specifically, identify the population to be studied. Are there explicit inclusion and exclusion criteria?
Determine whether the study requires cross-sectional or longitudinal data.
Based on the above, identify potential databases and ensure that they meet the needs of the study.
Review the database documentation to understand the data collection design and identify possible coverage or sampling error issues. Also, ensure that all variable metadata are present.
In the case of longitudinal data, check which questions were included in each survey wave.
Analyse missing data (or processing that may have been done in advance of such data) to ensure that it will not excessively impact the planned analyses.
If specific data characteristics are not in perfect adequacy with the prerequisites of the envisaged study, determine as soon as possible if this calls into question the realisation of the study to avoid having to adapt the research study as it progresses perpetually.
Conclusion
This paper looked at the issues we had using secondary data to investigate a research question. There is a shared responsibility among all persons involved in analysing such data and disseminating the corresponding results regarding these issues. Of course, users may take the main part of this responsibility because they choose to use a specific dataset. If they decide to use it, they must carefully evaluate its possible shortcomings and its consequences on their results. Moreover, limitations caused by the data should be documented and made available to everyone who has to evaluate the research. The data collectors also have their share of responsibility. Indeed, they have the possibility 1) to include a sufficient number of items in their questionnaires and to ensure a sufficient degree of similarity in the questionnaires used for each wave (in the case of a longitudinal survey); 2) to fully document their datasets with metadata and paradata. Still related to data collectors, two other actors can impact the quality, hence the reusability of the data. The first one is the funders of data collection, who can impose rules regarding good practices that should be followed during data collection and archiving. The second one is the specialists of data repository services who can explain how to archive datasets that can be useful to other researchers.
Finally, any study aims is to increase our knowledge and understanding so that government agencies, commercial companies or the general audience can use the results. Ideally, the publisher of an article or the end-user of a report should be aware of the possible issues linked with using secondary data. Also, they should question the ethics of publishing an article and/or using study results to make decisions or elaborate on new politics.
Acknowledgments
The authors are grateful to the SNSF for its financial assistance. The authors wish to thank all the reviewers who gave their time to peer review this article.
Disclosure statement
No potential conflict of interest was reported by the authors.
Additional information
Funding
Notes on contributors
Ibrahima Dina Diatta
Ibrahima Dina Diatta is a doctoral student in statistics applied to humanities and social sciences at the University of Lausanne. His research focuses on the impact of missing data on statistical analysis and on the application of statistics in the medical field.
André Berchtold
André Berchtold is a professor of statistics at the Institute of Social Sciences of the University of Lausanne. He is a specialist in Markov models, categorical data and the treatment of missing data. His areas of application include adolescent health, substance use, and life courses.
References
- Allison, P. D. (2001). Missing data (Vol. 136). Sage publications.
- Berchtold, A. (2019). Treatment and reporting of item-level missing data in social science research. International Journal of Social Research Methodology, 22(5), 431–439. https://doi.org/10.1080/13645579.2018.1563978
- Berchtold, A., Akre, C., Barrense-Dias, Y., & Suris, J.-C. (2017). Collecting data among chronically ill adolescents and their parents: How to get their attention? SAGE Research Methods Cases. https://doi.org/10.4135/9781473974777
- Berchtold, A., Jeannin, A., Akre, C., Michaud, P.-A., & Suris, J.-C. (2010). First use of multiple substances: Identification of meaningful patterns. Journal of Substance Use, 15(2), 118–130. https://doi.org/10.3109/10550880903422747
- Berchtold, A., & Sckett, G. P. (2007). The time resolution in lag-sequential analysis: A choice with consequences. Journal of Data Science, 5(3), 357–378. https://doi.org/10.6339/JDS.2007.05(3).340
- Boyle, J., Berman, L., Dayton, J., Iachan, R., Jans, M., & ZuWallack, R. (2021). Physical measures and biomarker collection in health surveys: Propensity to participate. Research in Social and Administrative Pharmacy, 17(5), 921–929. https://doi.org/10.1016/j.sapharm.2020.07.025
- Caspersen, C. J., Powell, K. E., & Christenson, G. M. (1985). Physical activity, exercise, and physical fitness: Definitions and distinctions for health-related research. Public Health Reports, 100(2), 126–131. https://stacks.cdc.gov/view/cdc/66195.
- Czajka, J. L., & Beyler, A. (2016). Declining response rates in federal surveys: Trends and implications. Mathematica Policy Research, I(202), 1–54. https://www.mathematica-mpr.com/our-publications-and-findings/publications/declining-response-rates-in-federal-surveys-trends-and-implications-background-paper
- De Silva, A. P., Moreno-Betancur, M., De Livera, A. M., Lee, K. J., & Simpson, J. A. (2017). A comparison of multiple imputation methods for handling missing values in longitudinal data in the presence of a time-varying covariate with a non-linear association with time: A simulation study. BMC Medical Research Methodology, 17(1), 114. https://doi.org/10.1186/s12874-017-0372-y
- Diatta, I. D., & Berchtold, A. (2020). Substance use as a function of activity level among young Swiss men. Swiss Medical Weekly, 2020(150), w20197. https://doi.org/10.4414/smw.2020.20197.
- Dong, Y., & Peng, C.-Y. J. (2013). Principled missing data methods for researchers. SpringerPlus, 2(1), 222. https://doi.org/10.1186/2193-1801-2-222.
- Draugalis, J. R., Coons, S. J., & Plaza, C. M. (2008). Best Practices for Survey Research Reports: A Synopsis for Authors and Reviewers. American Journal of Pharmaceutical Education, 72(1), 11. https://doi.org/10.5688/aj720111
- Ellis, P. D. (2010). The essential guide to effect sizes: Statistical power, meta-analysis, and the interpretation of research results. Cambridge University Press.
- Gmel, G., Akre, C., Astudillo, M., Bähler, C., Baggio, S., Bertholet, N., Clair, C., Cornuz, J., Daeppen, J.-B., Deline, S., Dermota, P., Dey, M., Dupuis, M., Estévez, N., Foster, S., Gaume, J., Haug, S., Henchoz, Y., Kuendig, H., … Wang, J., & others. (2015). The Swiss cohort study on substance use risk factors–findings of two waves. Sucht, 61(4), 251–262. https://doi.org/10.1024/0939-5911.a000380
- Groves, R. M., Fowler, F. J., Jr, Couper, M. P., Lepkowski, J. M., Singer, E., & Tourangeau, R. (2011). Survey methodology (Vol. 561). John Wiley & Sons.
- Heitjan, D. F. (1994). Ignorability in General Incomplete-Data Models. Biometrika, 81(4), 701–708. https://doi.org/10.2307/2337073
- Heitjan, D. F., & Rubin, D. B. (1991). Ignorability and coarse data. The Annals of Statistics, 19(4) , 2244–2253. https://doi.org/10.1214/aos/1176348396
- Henchoz, Y., Baggio, S., N’Goran, A. A., Studer, J., Deline, S., Mohler-Kuo, M., Daeppen, J.-B., & Gmel, G. (2014). Health impact of sport and exercise in emerging adult men: A prospective study. Quality of Life Research, 23(8), 2225–2234. https://doi.org/10.1007/s11136-014-0665-0
- Hox, J. J., & Boeije, H. R. (2004). Data collection, primary vs. secondary.Kimberly Kempf-Leonard ed. In Encyclopedia of social measurement (pp. 593–599). Elsevier Inc. https://doi.org/10.1016/B0-12-369398-5/00041-4
- Huque, M. H., Carlin, J. B., Simpson, J. A., & Lee, K. J. (2018). A comparison of multiple imputation methods for missing data in longitudinal studies. BMC Medical Research Methodology, 18(1), 168. https://doi.org/10.1186/s12874-018-0615-6
- Hwang, Y.-H., & Fesenmaier, D. R. (2004). Coverage error embedded in self-selected Internet-based samples: A case study of Northern Indiana. Journal of Travel Research, 42(3), 297–304. https://doi.org/10.1177/0047287503257501
- Kelley, K., Clark, B., Brown, V., & Sitzia, J. (2003). Good practice in the conduct and reporting of survey research. International Journal for Quality in Health Care: Journal of the International Society for Quality in Health Care, 15(3), 261–266. https://doi.org/10.1093/intqhc/mzg031.
- Kiecolt, K. J., & Nathan, L. E. (1985). Secondary analysis of survey data (Vol. 53). Sage.
- Kim, S., Egerter, S., Cubbin, C., Takahashi, E. R., & Braveman, P. (2007). Potential implications of missing income data in population-based surveys: An example from a postpartum survey in California. Public Health Reports, 122(6), 753–763. https://doi.org/10.1177/003335490712200607
- King, G., Honaker, J., Joseph, A., & Scheve, K. (2001). Analyzing incomplete political science data: An alternative algorithm for multiple imputation. American Political Science Review, 95(1), 49–69. https://doi.org/10.1017/S0003055401000235
- Leeper, T. J. (2019). Where have the respondents gone? Perhaps we ate them all. Public Opinion Quarterly, 83(S1), 280–288. https://doi.org/10.1093/poq/nfz010
- Little, R. J.A., & Rubin, D. B. (1987). Statistical analysis with missing data. John Wiley & Sons, Inc.
- Little, R. J. A., & Rubin, D. B. (2019). Statistical analysis with missing data (Vol. 793). John Wiley & Sons.
- McKnight, P. E., McKnight, K. M., Sidani, S., & Figueredo, A. J. (2007). Missing data: A gentle introduction. Guilford Press.
- Mons, B. (2020). Invest 5% of research funds in ensuring data are reusable. Nature, 578(7796), 491. https://doi.org/10.1038/d41586-020-00505-7
- Moore, M. J., & Chudley, E., & others. (2005). Sport and physical activity participation and substance use among adolescents. Journal of Adolescent Health, 36(6), 486–493. https://doi.org/10.1016/j.jadohealth.2004.02.031
- Pham, T. M., Carpenter, J. R., Morris, T. P., Wood, A. M., & Petersen, I. (2018) Population-calibrated multiple imputation for a binary/categorical covariate in categorical regression models. Statistics in Medicine, 38(5),792–808. https://doi.org/10.1002/sim.8004
- Punch, K. F. (2013). Introduction to social research: Quantitative and qualitative approaches. Sage.
- Resche-Rigon, M., & White, I. R. (2018). Multiple imputation by chained equations for systematically and sporadically missing multilevel data. Statistical Methods in Medical Research, 27(6), 1634–1649. https://doi.org/10.1177/0962280216666564
- Rubin, D. B. (1976). Inference and missing data. Biometrika, 63(3), 581–592. https://doi.org/10.1093/biomet/63.3.581
- Schafer, J. L. (1997). Analysis of incomplete multivariate data. CRC press.
- Schafer, J. L., & Graham, J. W. (2002). Missing data: Our view of the state of the art. Psychological Methods, 7(2), 147–177. https://doi.org/10.1037/1082-989X.7.2.147.
- Smith, E. (2008). Pitfalls and promises: The use of secondary data analysis in educational research. British Journal of Educational Studies, 56(3), 323–339. https://doi.org/10.1111/j.1467-8527.2008.00405.x
- Studer, J., Baggio, S., Mohler-Kuo, M., Dermota, P., Gaume, J., Bertholet, N., Daeppen, J.-B., & Gmel, G. (2013). Examining non-response bias in substance use research—Are late respondents proxies for non-respondents? Drug and Alcohol Dependence, 132(1–2), 316–323. https://doi.org/10.1016/j.drugalcdep.2013.02.029
- Tsiatis, A. A., Kenward, M. G., Fitzmaurice, G., Verbeke, G., & Molenberghs, G. (2014). Handbook of missing data methodology. Chapman and Hall/CRC.
- Van Buuren, S. (2018). Flexible imputation of missing data. CRC press.
- Vartanian, T. P. (2011). Secondary data analysis. Oxford University Press.
- White, I. R., Royston, P., & Wood, A. M. (2011). Multiple imputation using chained equations: Issues and guidance for practice. Statistics in Medicine, 30(4), 377–399. https://doi.org/10.1002/sim.4067